Thank you Scot.
I am a little confused by the conclusion that “(2) the relative power of U.S. capital continues to wane,” which appears to be based on your discussion regarding Figure 3 and “net profit shares. ”
1. The conclusion is based on Figures 2 and 3.
I thought power (and, therefore, relative power) is determined by market value (i.e., capitalization), not by net profit shares (i.e., earnings multiplied by the number of shares outstanding). By factoring out share price, you’ve eliminated any consideration of differential discount rates and differential “hype,” which conceivably could result in lesser profits representing greater power. What do the relative market capitalization data show?
2. You are correct that, according to our CasP view, differential capitalization is the ultimate power yardstick, and that differential profit gives only a partial picture. However, there is something to be gained by looking at net profit only, since, over the very long haul, it is the main driver of capitalization.
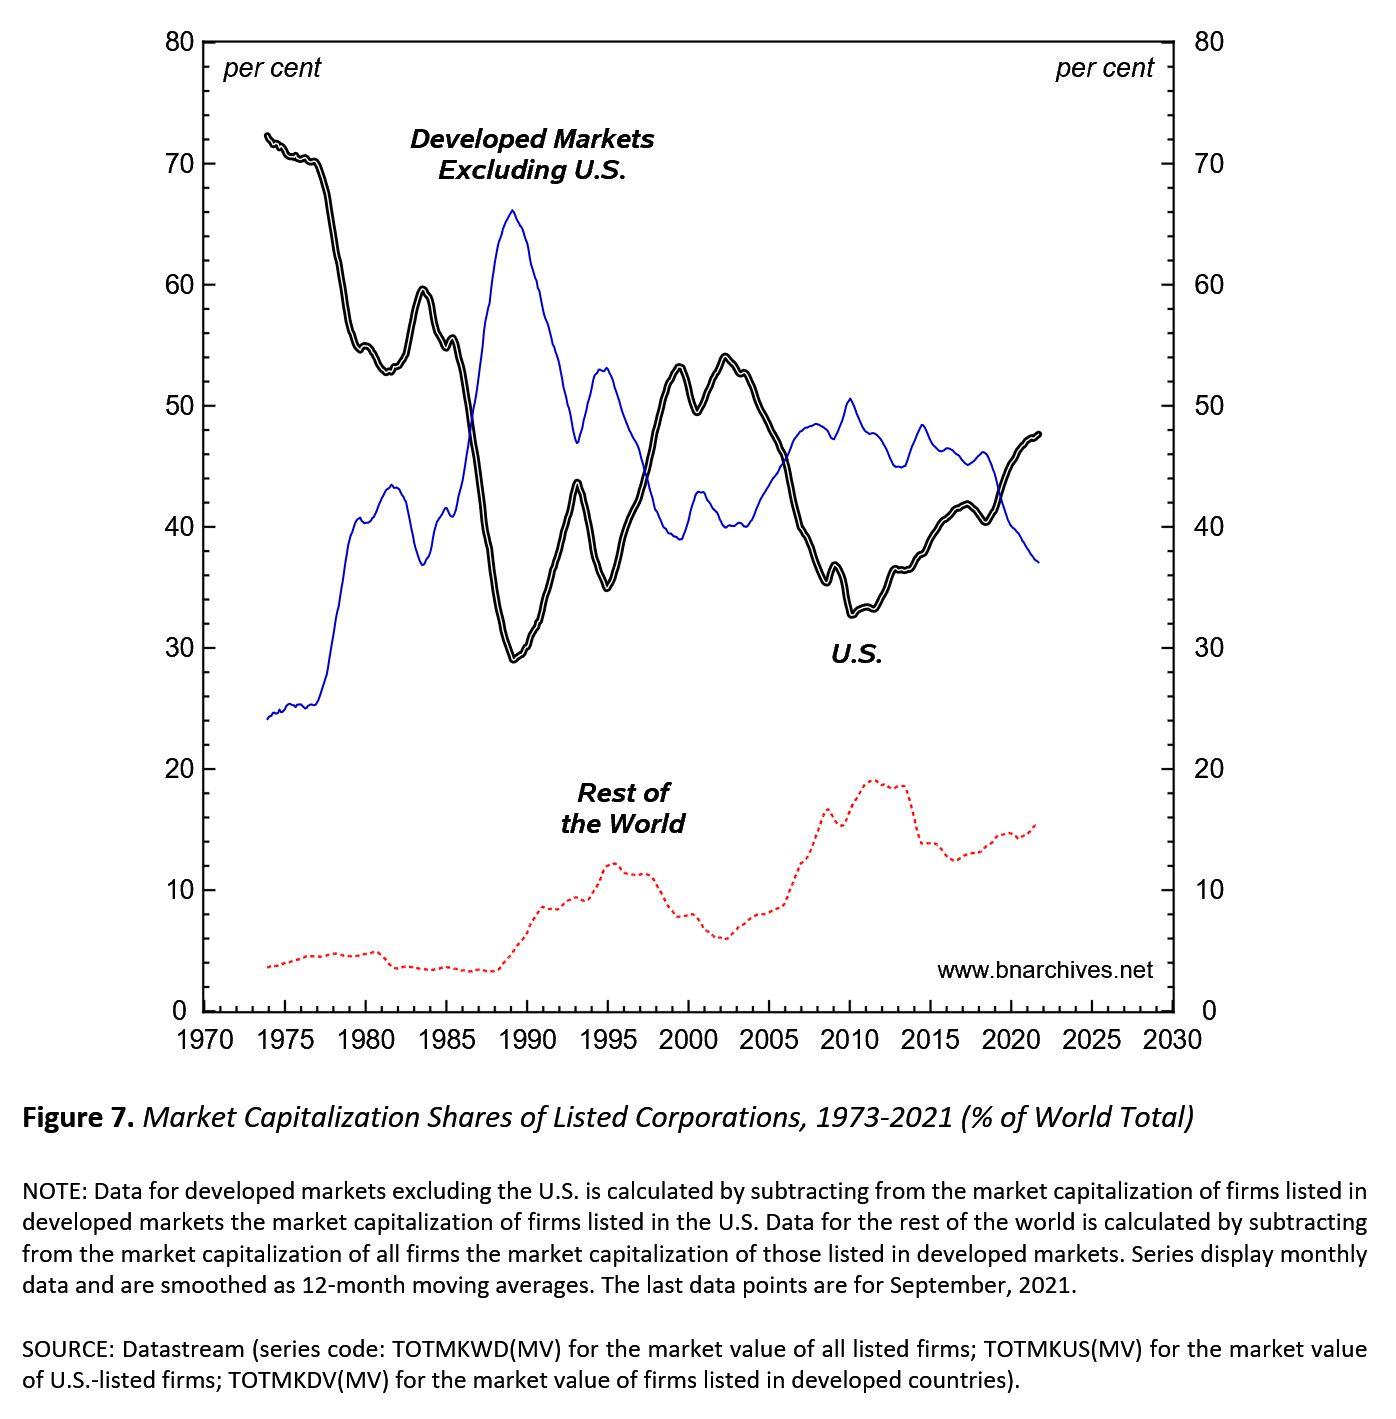
In any event, here is the figure for the global distribution of market capitalization. The downtrend of the U.S. share is not as steep as in the net profit figure, but it is negative nonetheless. And remember that these data start only in the mid 1970s. My hunch is that the U.S. share of global market capitalization in the 1950s was higher.