
Is the Penn World Table Credible?
October 17, 2021
Originally published at joefrancis.info
Joe Francis
Last year the eighth edition of the Penn World Table (PWT) was released to considerable fanfare – indeed, one commentator described it as ‘a special day for all researchers and practitioners of economics‘. Yet its series for Argentina raises more questions than it answers.
PWT 8.0’s major innovation was go beyond what I have previously described as the standard ‘Penn methodology’. To recap, it consists of the following:
- Begin with an estimate of nominal GDP in US dollars in a more or less recent base year.
- Adjust that estimate for differences in the price level, in order to arrive at an estimate in international purchasing power parity (PPP) dollars.
- Extrapolate backwards from that recent PPP base-year estimate using a volume index of the country’s GDP drawn from its national accounts.1
The problem with this procedure is that it is vulnerable to errors in the price levels and the national accounts. Consequently, different versions of the PWT have produced different historical GDP estimates.
Figure 1 illustrates the problem using Argentina’s GDP per capita relative to the United States according to the three previous versions of the PWT. As can be seen, there is considerable disagreement between them. All show the standard story of Argentina’s decline, but there is no agreement about what level it declined from or to where.
Figure 1
Argentina in the Penn World Tables 5.6 to 7.1
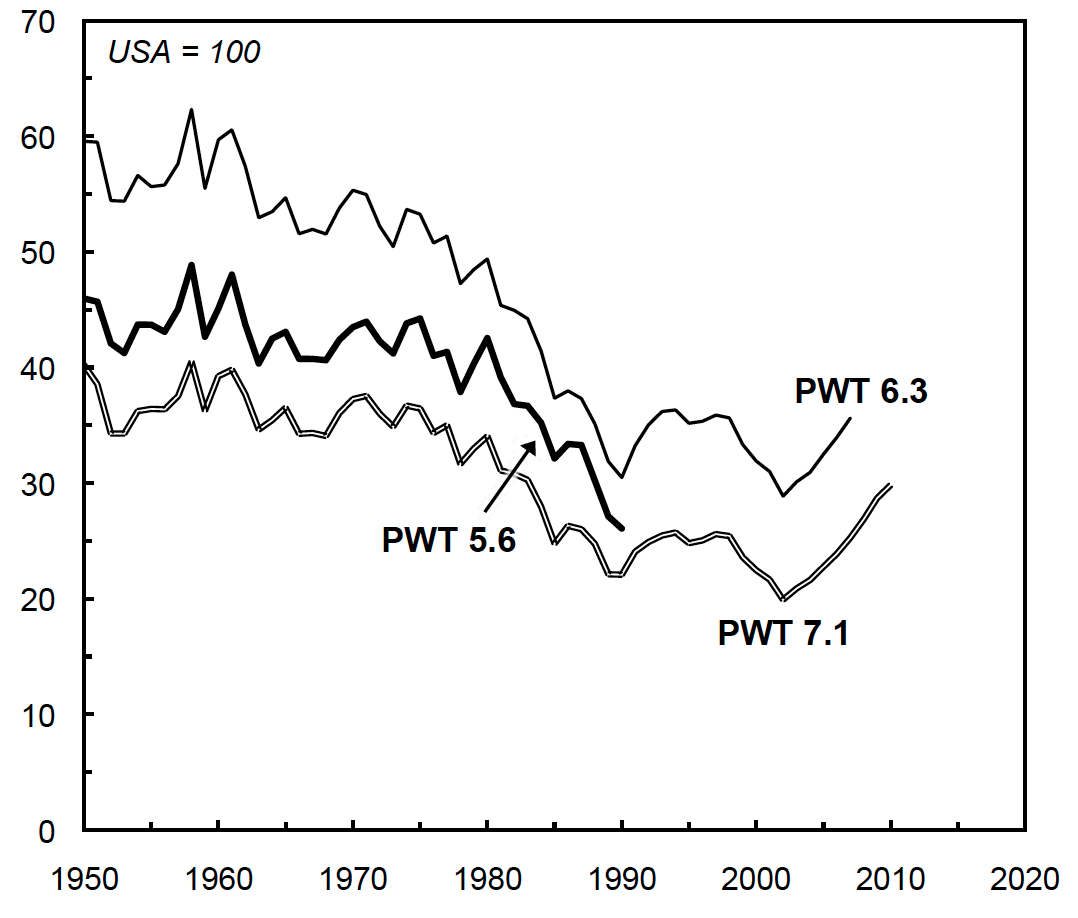
Source: PWTs, Series RGDPCH.
Aware of this problem, the authors of the PWT 8 have tried to fix it. Their solution is to use multiple benchmarks, then use the national accounts to interpolate between, and extrapolate from, them. The assumption appears to be that the benchmark estimates are likely to be correct, so errors are introduced with the national-accounts data. Integrating all available benchmarks should therefore reduce the number of errors by making the estimates less reliant on the national accounts.
For Argentina, the results of this new Penn methodology can be seen in Figure 2, where the PWT 8 series is compared with the PWT 7.1 series. For the new PWT 8 series, benchmarks for Argentina for 1980, 1996, and 2005 were taken from the United Nations/World Bank International Comparison Program (ICP), and Argentine national accounts data were used for the extrapolations and interpolations. As can be seen, the result is striking: Argentina’s decline has disappeared!
Figure 2
Argentina in the Penn World Tables 7.1 and 8.0
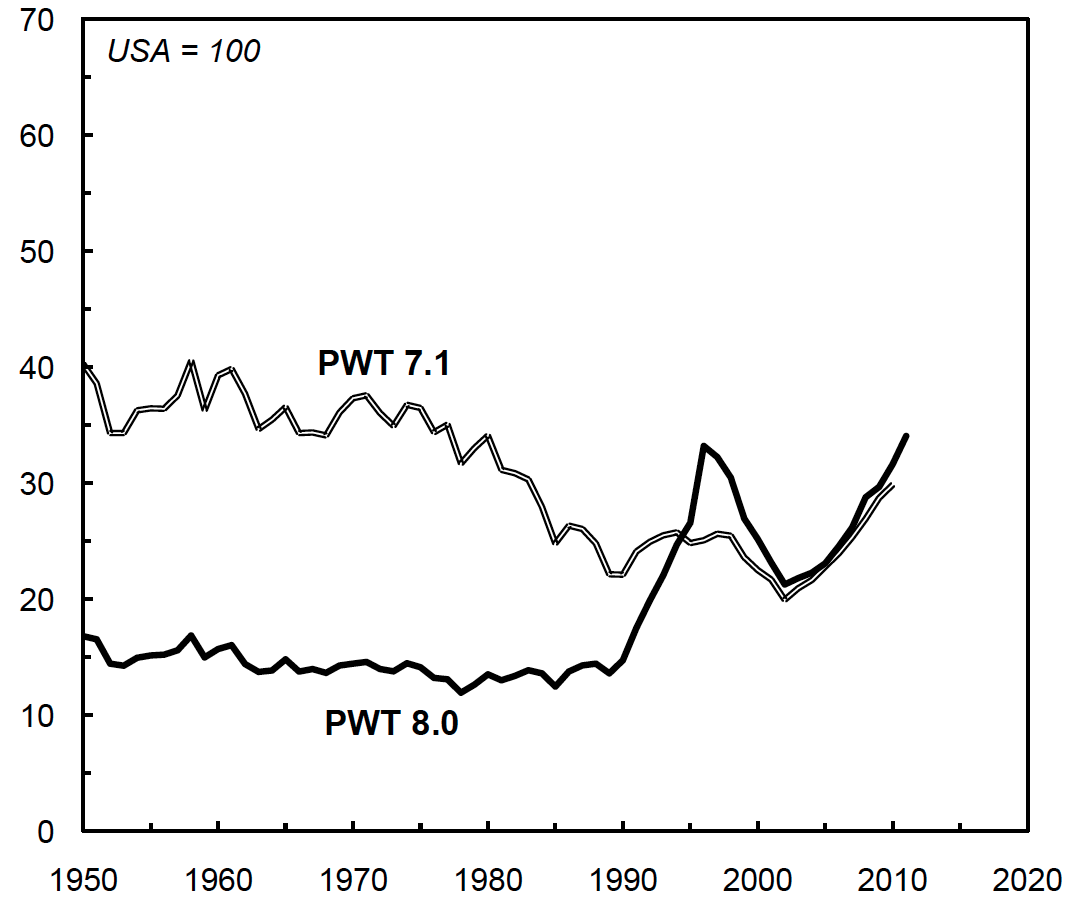
Sources: PWT 7.1, Series RGDPCH; and PWT 8.0, Series RGDPE and POP.
Faced by Figure 2, one option is to revise Argentina’s post-war history. If the new PWT 8 series is accepted, the whole narrative of the ‘Argentine decline’ will have to be rewritten, as the country apparently did not lose significant ground vis-à-vis the United States from the 1950s through the 1980s, then began to catch up with it dramatically, if unevenly, from the 1990s. Alternatively, we could just ignore PWT 8.0 and return to the old methodology, despite its obvious problems, and insist on Argentina’s decline.
My own response, however, is somewhat different. Rather than accepting either of the Penn series, I would argue that we should take both as measures of our ignorance. That two methodologies can produce such divergent results demonstrates how little we still know about Argentina’s history.
Footnote
- In practice, the same results can be achieved with slightly different procedures. In the case of the more recent PWTs, the authors seem to begin with the estimates of price levels in the recent base year, then extrapolate backwards and forwards using price indices drawn from the national accounts converted into US dollars using exchange rates. Those long-term price levels are then applied to national-account estimates of GDP, again converted to US dollars. The result is the same. ↩