
The Business of Strategic Sabotage

SHIMSHON BICHLER and JONATHAN NITZAN
January 2023
Abstract
In a recent article, Nicolas D. Villarreal claims that our empirical analysis of the relation between business power and industrial sabotage in the United States is unpersuasive, if not deliberately misleading. Specifically, he argues that we cherry-pick specific data definitions and smoothing windows to ‘achieve the desired results’; that these ‘results are driven by statistical aberrations’; and that his own choice of variables pretty much invalidates our conclusions. In this brief response, we offer an easy-to-follow, step-by-step reply to his complaints.
Keywords
business, capitalist income, industry, Marxism, strategic sabotage, unemployment
Citation
Bichler, Shimshon, and Nitzan, Jonathan. 2023. ‘The Business of Strategic Sabotage’. Review of Capital as Power, Vol. 2, No. 2, pp. 81–95.

1 Introduction
MARXISTS love to hate the theory of capital as power, or CasP for short. And they have two good reasons. First, CasP criticizes the logical and empirical validity of the labour theory of value on which Marxism rests. And second, it offers the young at heart a radical, non-Marxist alternative with which to research, understand and contest capitalism. With these reasons in mind, it is only understandable that most Marxists prefer to keep Pandora’s box closed, and few challenge CasP directly.
Sometimes, though, the wall of silence breaks, typically by a lone Marxist who lashes out at the ‘idealist’ renegades of forward-looking capitalized power and reiterates the good old ‘material reality’ of backward-looking labour time. Since these occasional critics are often confident in their dogma and rarely bother to understand the CasP research they criticize (let alone the broader body of CasP literature), their critiques scarcely merit a response. But occasionally, they accuse us of empirical wrongdoing – and these charges do call for a reply.
Such accusations are levelled in a recent paper by Nicolas D. Villarreal (2022), titled ‘Capital, Capitalization, and Capitalists: A Critique of Capital as Power Theory’. In his article, Villarreal claims that our empirical analysis of the relation between business power and industrial sabotage in the United States is unpersuasive, to put it politely (Nitzan and Bichler 2009: 236-239). He argues that we cherry-pick specific data definitions and smoothing windows to ‘achieve the desired results’; that these ‘results are driven by statistical aberrations’; and that his own choice of variables pretty much invalidates our conclusions.
Unfortunately, Mr. Villarreal’s empirical counter-analysis leaves much to be desired. His ‘reproduction/refutation’ of our work is not only poorly documented, but also uses incorrect variables, including ones that differ from those labelled in his own figures (gross instead of net income, domestic instead of national variables, national categories mixed with domestic ones, etc.). So instead of trying to reverse-engineer his results, here is our own easy-to-follow, step-by-step reply to his complaints. Hopefully, this reply will make future critics a bit more careful with their dismissive arguments.
2 Industry and Business
Most people treat ‘industry’ and ‘business’ as synonyms. Economists and lay people will refer to the ‘auto business’ in the same way business analysts and politicians might speak of the ‘financial industry’. These representations assume that the material processes of production and consumption and the monetary venues of capitalism are part and parcel of the same thing, serving each other and moving pretty much in the same direction.
But not everyone shares this view. According to early twentieth-century thinker Thorstein Veblen (1904; 1923), industry and business in fact are two distinct entities with very different, if not opposite, properties.
For Veblen, industry is the overall material context of society. When treated separately from business institutions, its key purpose is the efficient production of quality goods and services for the betterment of human life. Achieving this goal depends on the systematic organization of production and the reasoned application of knowledge. And this organization and application is inherently communal: it hinges on resonating workmanship, collaboration, cooperation and integration throughout society, both spatially and temporally.
By contrast, business means investment for profit, carried through purchases, sales and societal manipulations for the purpose of pecuniary capital accumulation. And this goal – as well as the means of achieving it – is a matter of power, and only power.1 Whereas industry is communal, collaborative and integrated, business depends and thrives on dissonance, conflict and antagonism among owners and between owners and the underlying population.
Over time, these opposite characteristics have given rise to totally different languages. Whereas the language of industry is absolute – it seeks the good life – that of business is differential: to augment one’s power relative to others.
3 Sabotage
Considered as ‘ideal types’, industry and business are orthogonal, in both ends and means. But in practice, they are deeply intertwined.
Industry as such does not need business. Left to its own device, the resonance of industrial cooperation, collaboration, integration and planning is self-contained. In this sense, the effect on industry of any extra-industrial intervention can only be nil or negative, by definition (if the effect is positive, the impacting entity is not exogenous to industry, but part of it).
By contrast, business is entirely dependent on industry. Without industry – i.e., without the combined effort of society to reproduce and better itself – business has nothing to exert power over, dominate and redistribute. Business per se – namely, purchases, sales and manipulation for the sake of redistribution and differential accumulation – is external to industry proper and therefore has nothing to contribute to it. Its only connection to industry is negative, via ‘sabotage’.
Anything that can undermine the resonance of industry is a potential business asset. The private ownership of plant, equipment and knowledge (intellectual property); the ability to manipulate and leverage government policy and control the underlying population via education, propaganda and advertisement; the power to undermine autonomous thinking, restrict creative collaboration and humane planning, block the free movement of people and things, induce war and destroy the natural environment – these are all means with which business can sabotage industry. And whatever can sabotage industry can be used to extort income from it by threatening to incapacitate its activity. This sabotage, says Veblen, is the ultimate source of all business income and the basis on which pecuniary investment and the accumulation of capital rest.
4 Strategic Sabotage
But sabotage can be a double-edged sword. Too little of it, causing insignificant damage to industry, will yield little return for business, so it is imperative that the threat to industry be substantial and credible. But if the damage by business to industry grows too large, the result can be industrial disintegration, societal instability and the possibility of business collapse.
This double-sided relation is illustrated in Figure 1. The horizontal axis represents the utilization of industrial capacity. The rightmost position shows industry working at full socio-technical capacity (100%). At this point, business sabotage of industry is nil. The leftmost point represents the opposite extreme, where business sabotage is complete and industry is at a standstill (capacity utilization = 0%).
The vertical axis represents the power of business, measured by the relative share of capitalists (profit and net interest) in national income. This axis ranges from 0% (business has no power) to 100% (full business power) – though in the figure here we extend it only to 25% for illustration purposes.
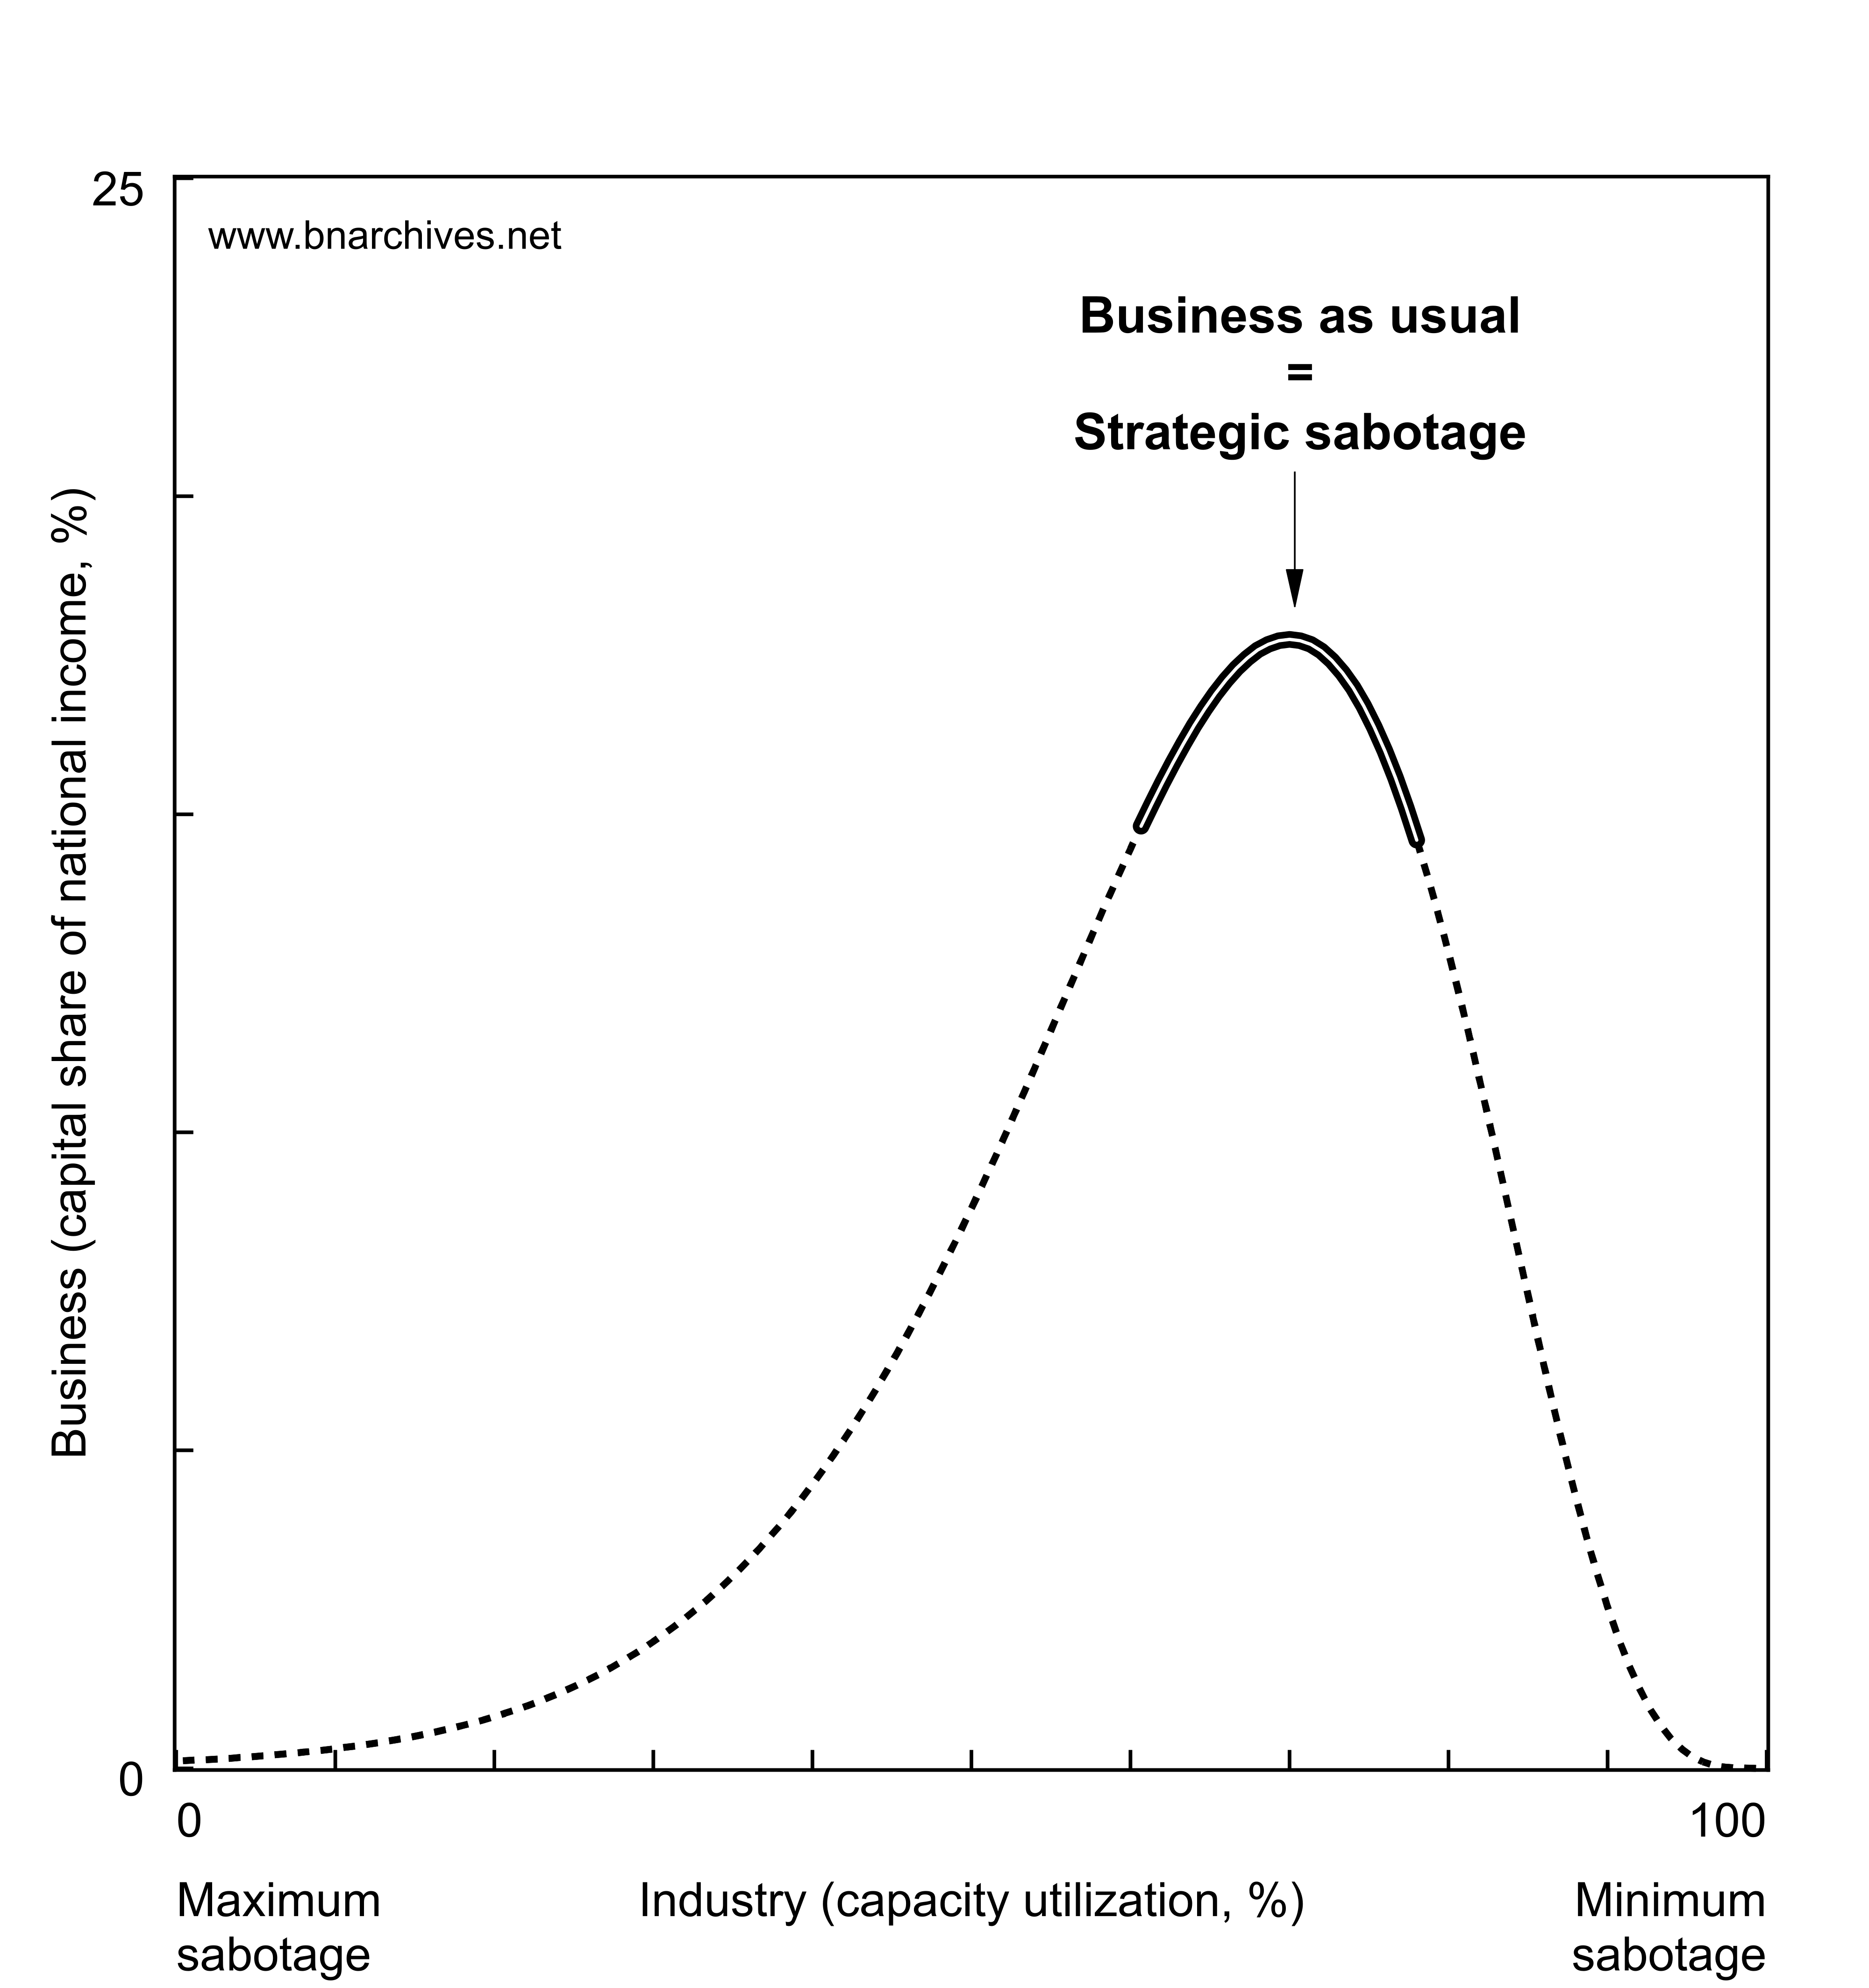 Figure 1: Industry versus business
According to our chart, the relationship between industry and business is inherently nonlinear. With no sabotage exerted over industry (rightmost point on the horizontal axis), business earnings are nil and the share of capital in national income is 0% (bottom point on the vertical axis). As business sabotage grows and industrial capacity utilization declines (leftward movement on the horizontal axis), capitalist earnings rise as a share of national income (upward movement on the vertical axis).
However, this inverse relationship of slowing industry (due to sabotage) and rising capitalist income share (for that very reason) can hold only for so long. At some point, the growth of industrial sabotage becomes too severe, undermining society’s cohesion and eliciting greater resistance from the underlying population. And if the sabotage continues to rise, mounting conflicts are bound to cause the capital share of national income to decline. This reversal is illustrated by the top arc of the curve.
From this point onward, more sabotage and further declines in capacity utilization (leftward movement) cause business power to diminish (marked by a falling national income share of capital); and if the sabotage becomes complete (reaching the leftmost point on the horizontal axis), business too comes to an end.
This analytical exposition serves to suggests why in capitalism ‘business as usual’ requires that the sabotage of industry be strategic – i.e., neither too cold, nor too hot. And the recent history of the United States seems to confirm this hypothesis.
5 The U.S. Case
Figure 2 examines the relevant U.S. data. The horizontal axis shows the rate of unemployment, a proxy for the general level of industrial sabotage (plotted inversely with the unemployment rate increasing from right to left).2 The vertical axis proxies the power of business using the national income share of pretax profit (including inventory valuation allowance and capital consumption adjustment) and net interest.3 And the historical relationship between these two variables, each smoothed as a 5-year trailing average, is clearly nonlinear and very much in line with the analytical portrayal in Figure 1.
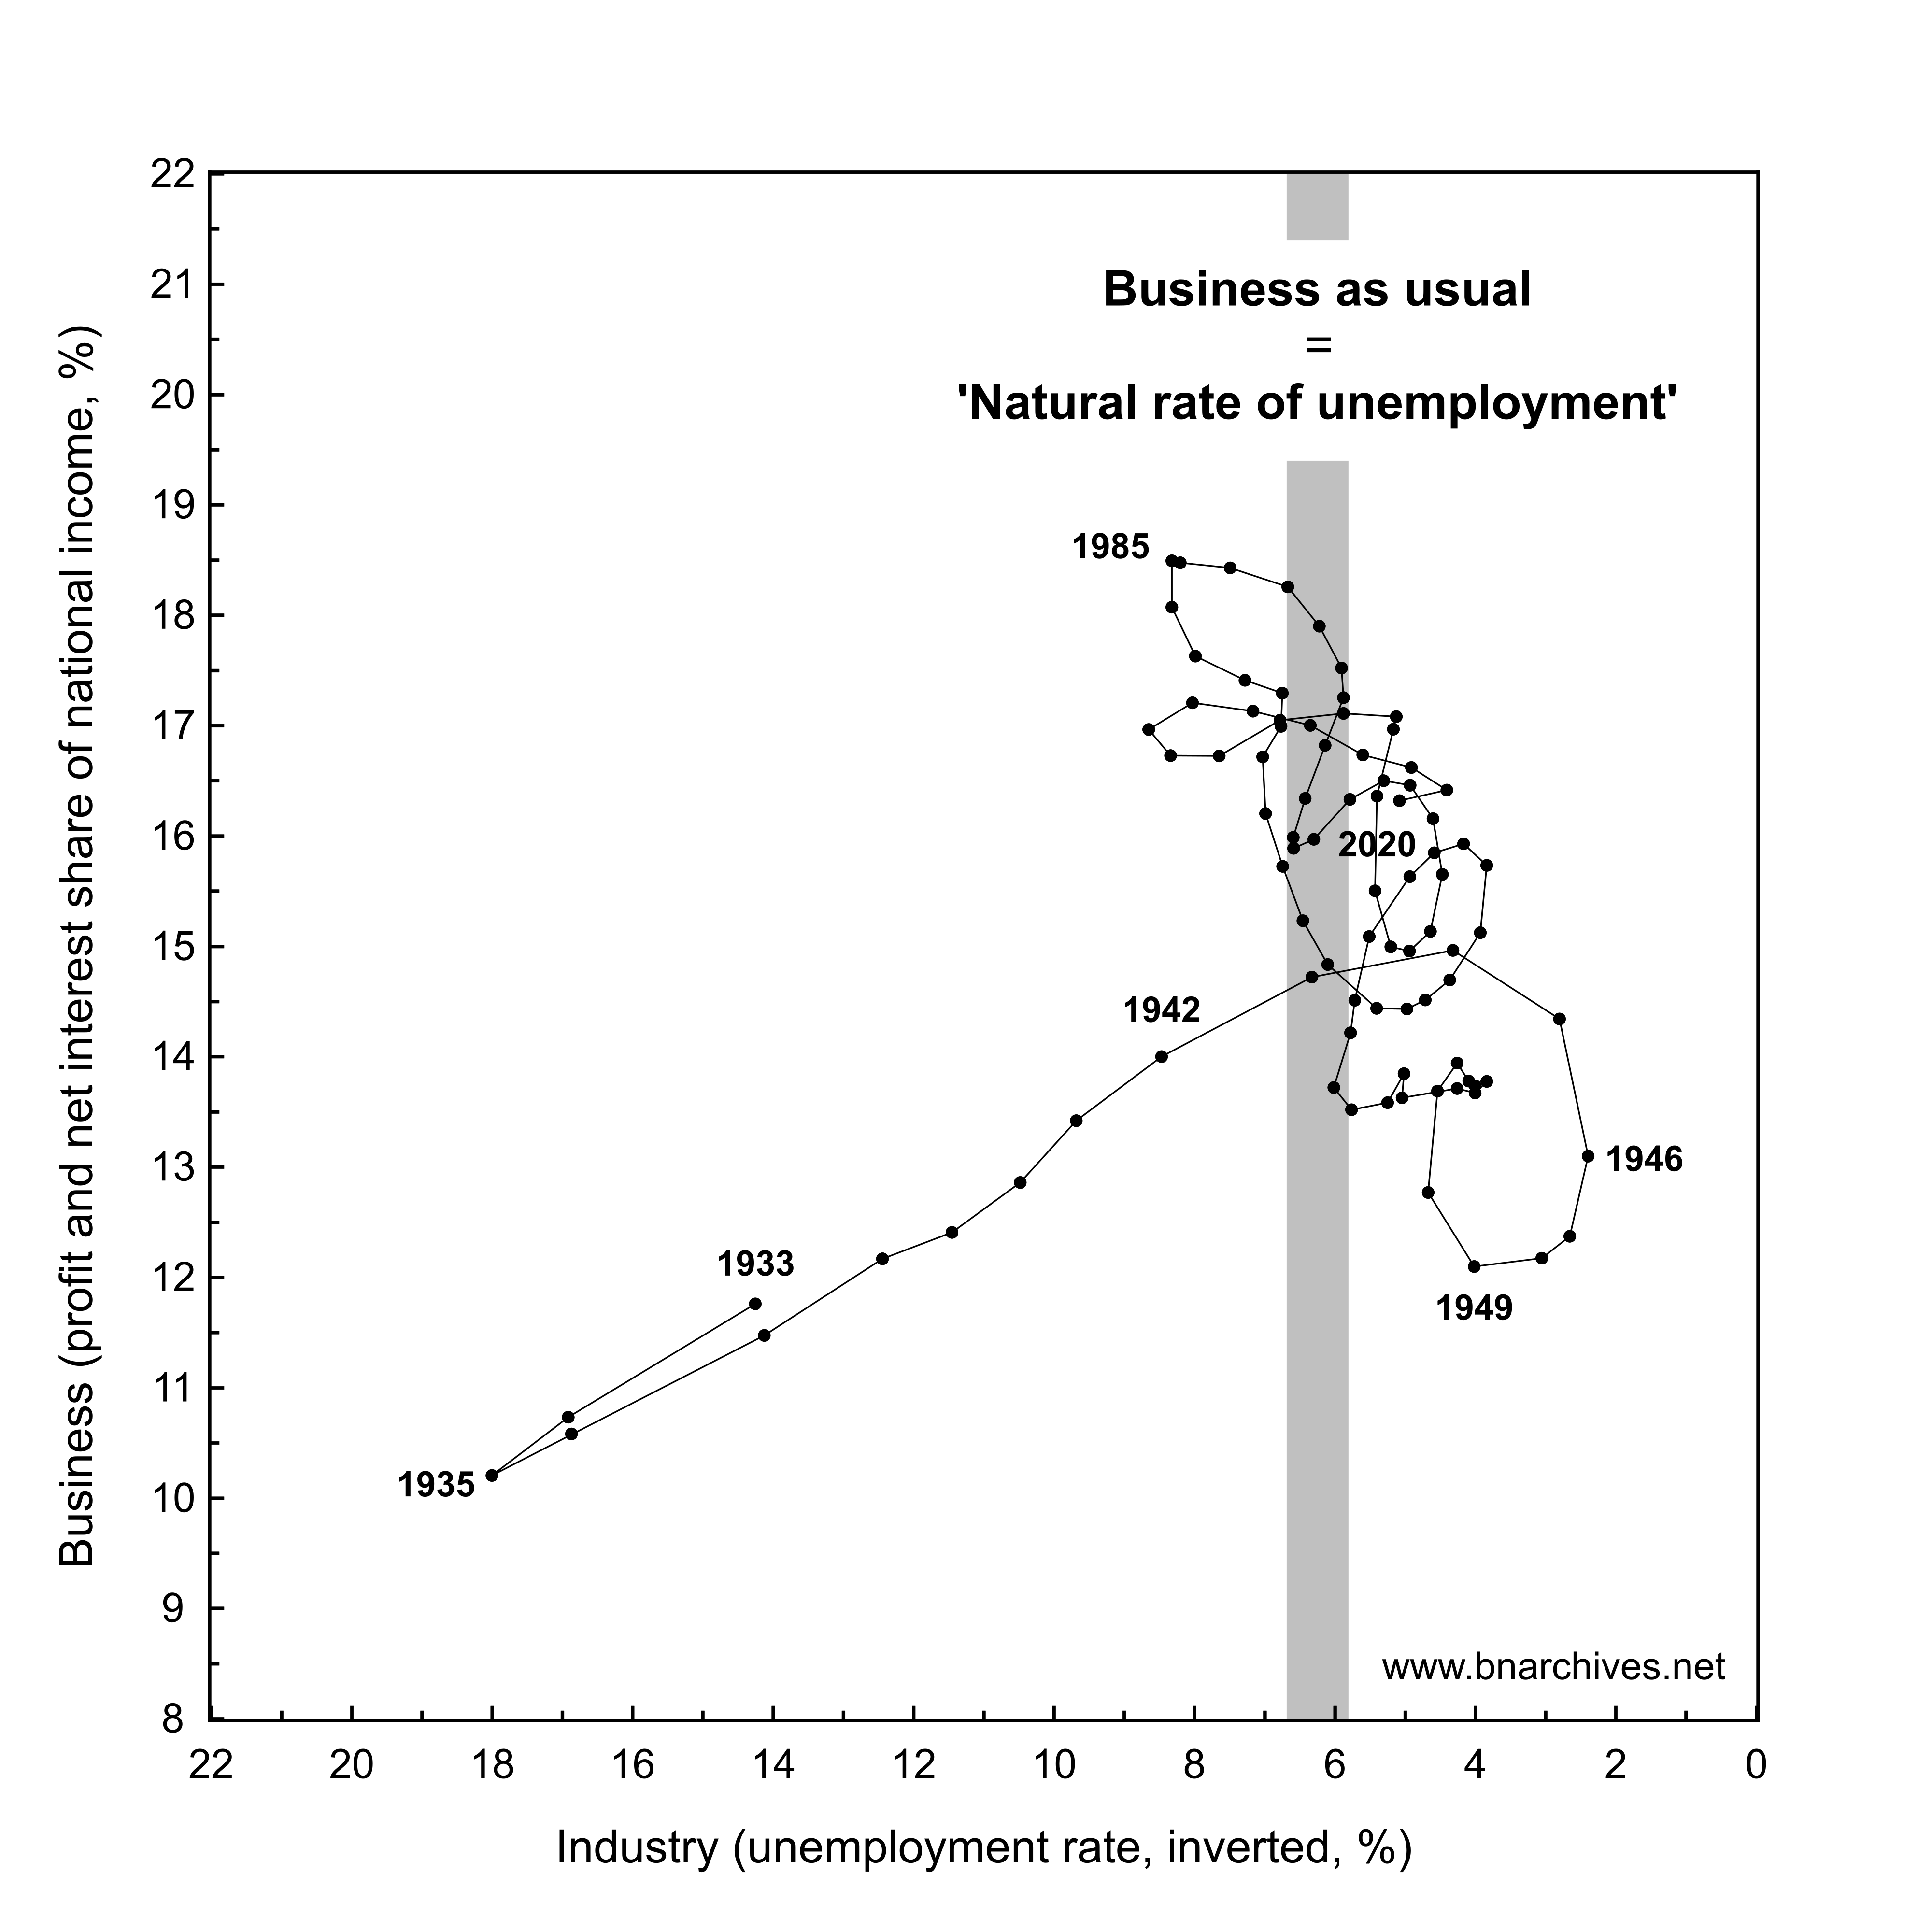 Figure 2: U.S. unemployment versus the profit and net interest share of national income, 1933-2020 (5-year trailing averages)
NOTE: profit is pretax with IVA/CCAdj. The vertical bar represents the mean unemployment rate over the 1929-2020 period (6.5%).
SOURCE: National income, profit and net interest data are from the Bureau of Economic Analysis via IHS Markit (series codes: YN for national income; ZBECON for pretax profit with IVA/CCAdj; and INTNAMISC for net interest). Unemployment data are from Historical Statistics of the United States till 1947 (series code: Unemployed_AsPercentageOf_CivilianLaborForce_Ba475_Percent) and from the U.S. Bureau of Labor Statistics via IHS Markit from 1948 onward (series code: RUC).
The Great Depression of the 1930s increased the business sabotage of industry, causing unemployment to rise (leftward movement) and the capital share of national income to drop (downward movement). This down-and-to-the-left slide was reversed when the depression began to ease, gained speed with the military build-up for the Second World War, and accelerated further as the U.S. joined the hostilities.
But as the war progressed and unemployment fell even further, the effect of sabotage on business power was inverted. From the mid-1940s onward, additional decreases in unemployment caused the capital share of national income not to rise, but to decline (down to 12% in the five years ending in 1949). And as we can see, from that point onward, the relationship between industry and business remained negative: the freer the industry (i.e., the weaker the sabotage and the lower the unemployment), the smaller the capital share of national income – and vice versa.
Figure 2 shows that, for nearly 75 years now, U.S. business has been groping for the Goldilocks point of ‘business as usual’ – the sweet spot where the rate of unemployment calibrates to generate the highest national income share for capital. At this point, Veblen’s notion of sabotage converges, if only superficially, with conventional economic theory: during the 1929‑2020 period, the ‘natural (read average) rate of unemployment’ was 6.5%, and it is this level of sabotage, give or take, that generated the highest capital share of national income.4
6 From National to Domestic
So far, we explained why the relationship between the sabotage of industry and business power should be nonlinear and demonstrated that, in the United States, this nonlinearity is corroborated by the data, with sabotage proxied by unemployment and business power by the national income share of profit and net interest. But how robust is this conclusion empirically?
In Figure 2, the capital share of income is computed on a national basis: we calculate the national income share of corporate profit and net interest gained by U.S.-based entities both domestically and abroad. But an argument can be made that unemployment affects only the domestic part of capital income; and if that is indeed the case, we should focus only on domestic capital income and compare it not to overall national income, but to net domestic income only.
Figure 3 examines this alternative relation. It contrasts the (inverted) rate of unemployment on the horizontal axis with the net domestic income share of pretax corporate profit with IVA and CCAdj and net interest on the vertical axis (as before, both series are smoothed as 5‑year trailing averages). And the overall pattern is again nonlinear and very similar to the one shown in Figure 2. In other words, the shift from national to domestic calculations leaves our conclusions intact.
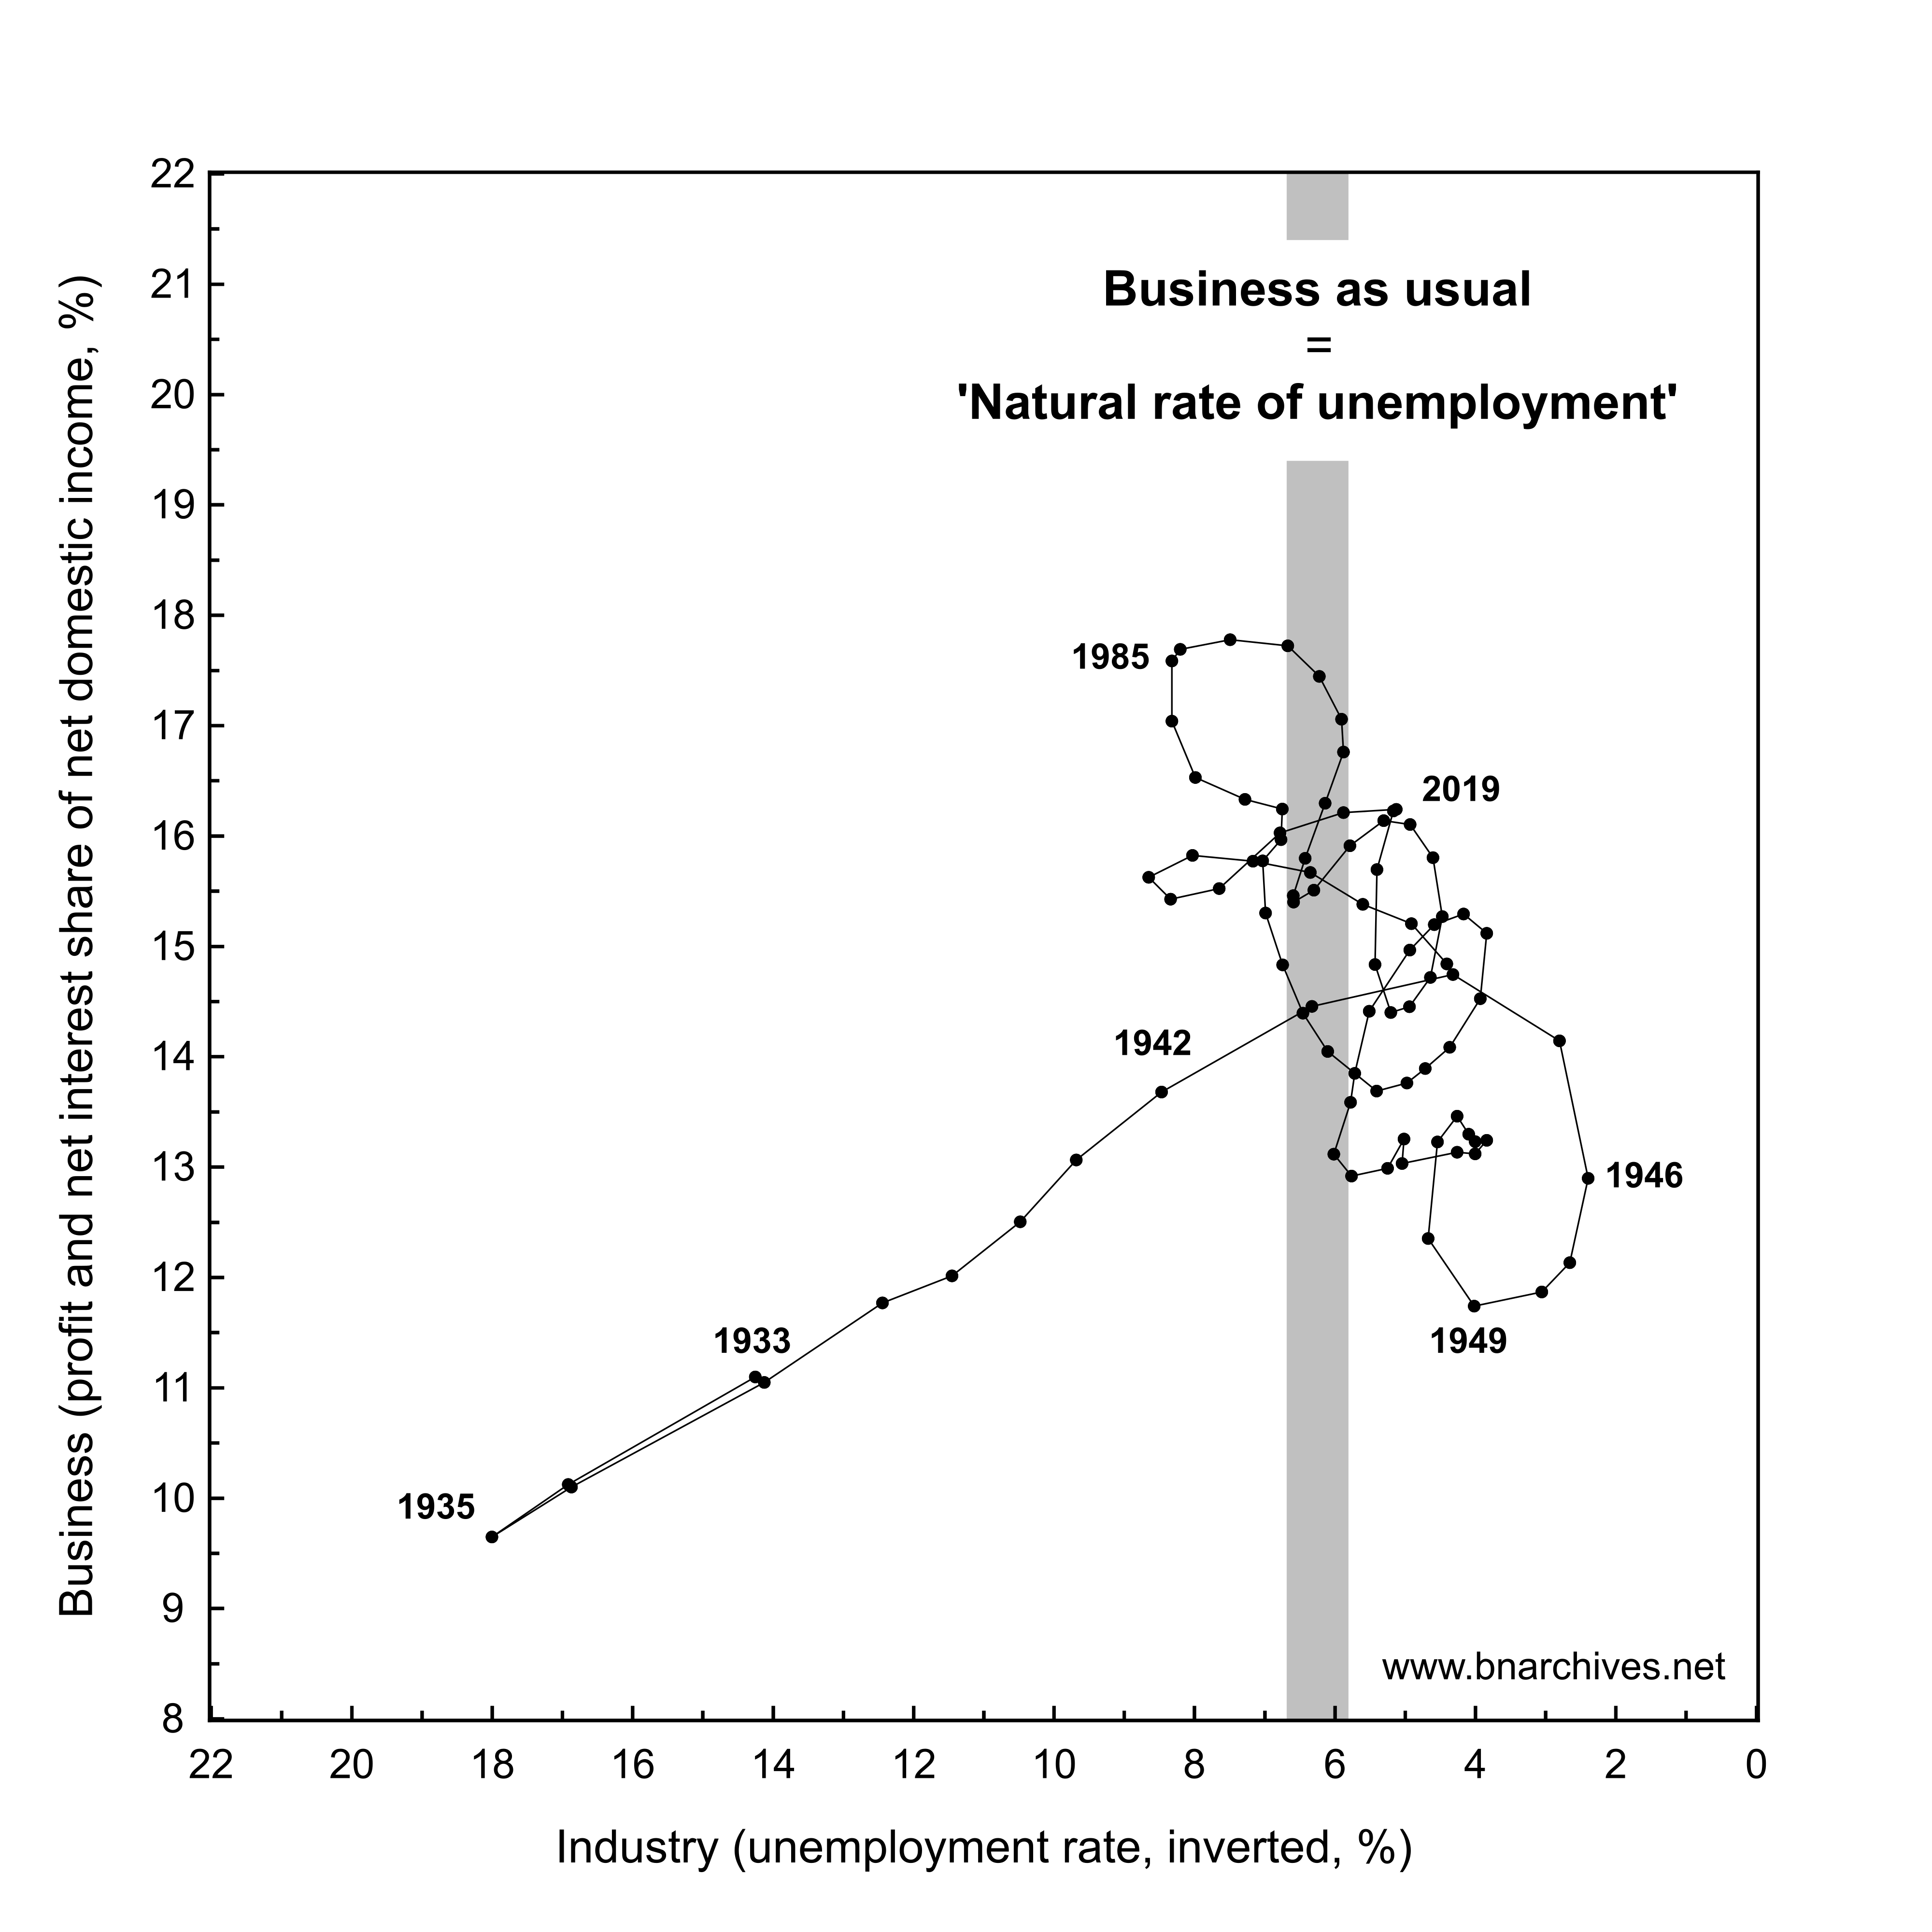 Figure 3: U.S. unemployment versus the profit and net interest share of net domestic income, 1933-2019 (5-year trailing averages)
NOTE: Profit is pretax with IVA/CCAdj. The vertical bar represents the mean unemployment rate over the 1929-2020 period (6.5%).
SOURCE: Net domestic income, profit and net interest data are from the Bureau of Economic Analysis via IHS Markit (series codes: NDY for net domestic income; ZBECOND for domestic pretax profit with IVA/CCAdj; and INTNETDBUS for domestic net interest. Unemployment data are from Historical Statistics of the United States till 1947 (series code: Unemployed_AsPercentageOf_CivilianLaborForce_Ba475_Percent) and from the U.S. Bureau of Labor Statistics via IHS Markit from 1948 onward (series code: RUC).
7 Smoothing
Another thing to check is the significance of data smoothing. In Figure 2, we smooth each series as a 5-year trailing average, so it is worth examining whether the nonlinear relationship holds when the smoothing window is shorter or longer. Figure 4 shows the results.
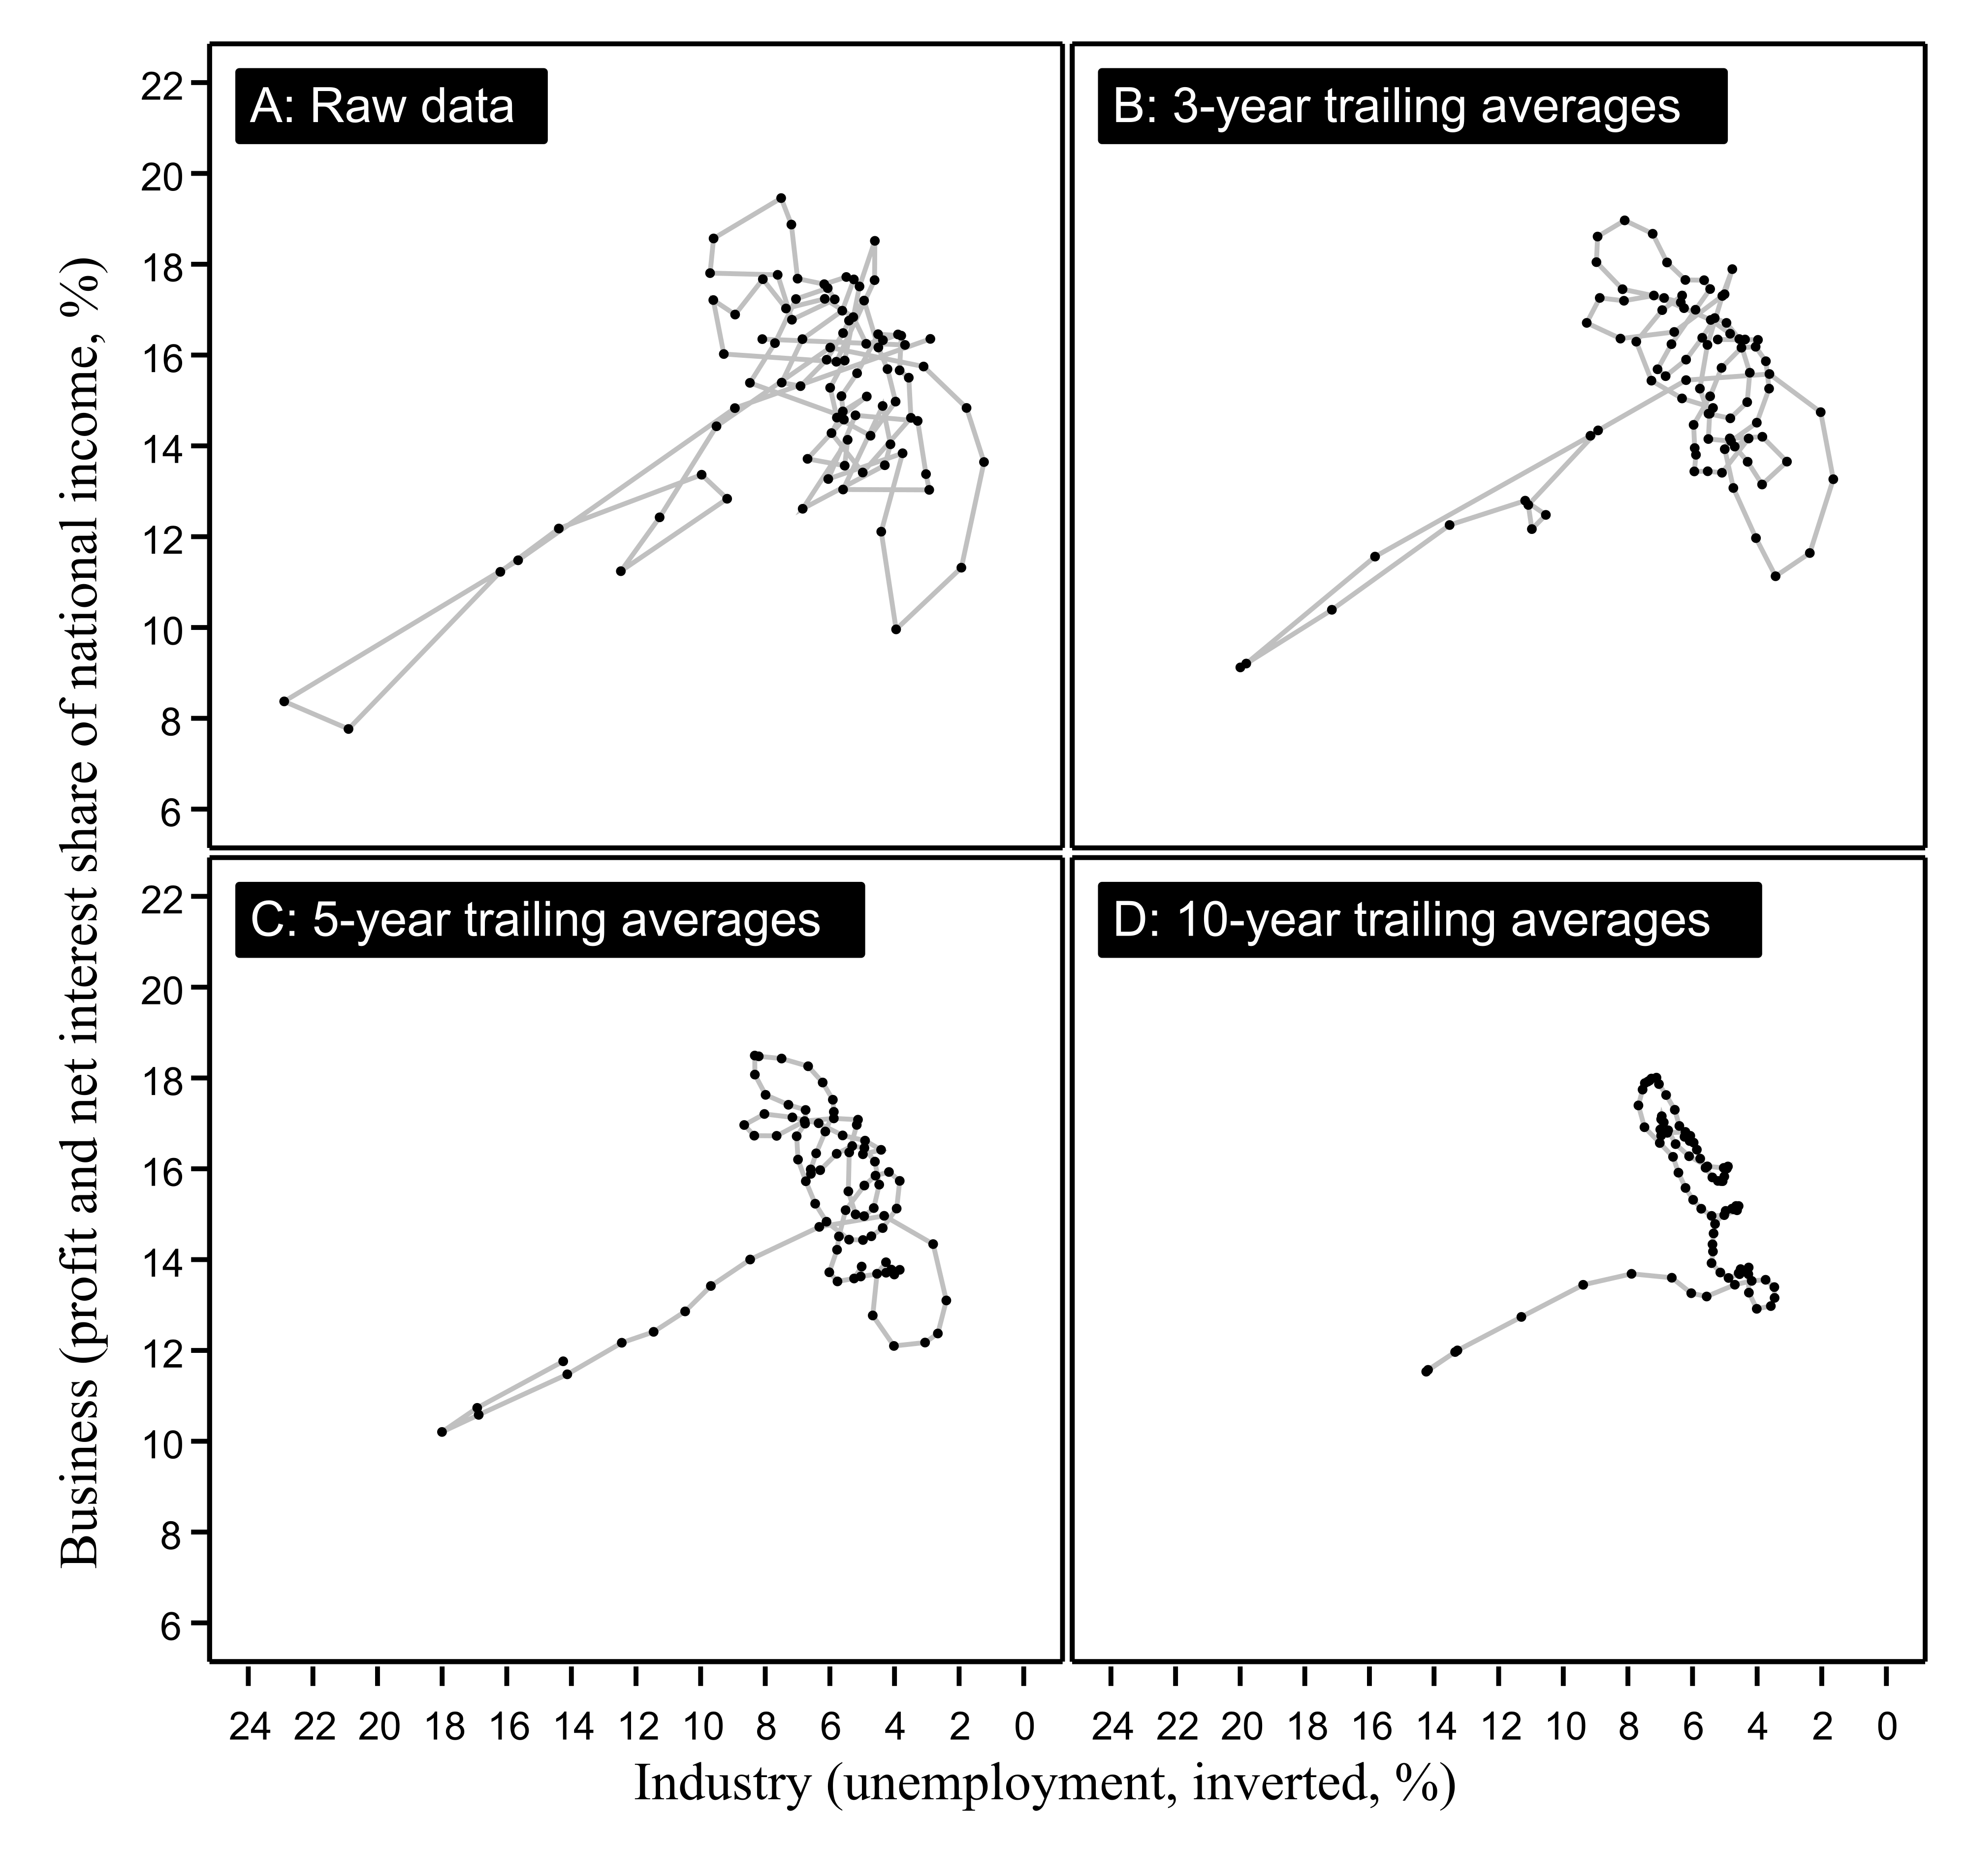 Figure 4: U.S. unemployment versus the profit and net interest share of national income, with various data-smoothing windows (different start years-2020)
NOTE: Profit is pretax with IVA/CCAdj.
SOURCE: National income, profit and net interest data are from the Bureau of Economic Analysis via IHS Markit (series codes: YN for national income; ZBECON for pretax profit with IVA/CCAdj; and INTNAMISC for net interest). Unemployment data are from Historical Statistics of the United States till 1947 (series code: Unemployed_AsPercentageOf_CivilianLaborForce_Ba475_Percent) and from the U.S. Bureau of Labor Statistics via IHS Markit for 1948 onward (series code: RUC).
Each of the four panels in the chart shows a different smoothing window: Panel A shows the raw annual data (without smoothing), Panel B shows the data smoothed as 3-year trailing averages, Panel C as 5-year trailing averages (the same as in Figure 2), and Panel D displays the data as 10‑year trailing averages.5
As expected, each smoothing window shows a different picture, yet they are all similarly nonlinear: in every panel the relationship is positive till the mid-1940s and negative thereafter.
8 Measuring Capital Income
A third feature worth examining is the category of ‘capital income’. In Figure 2, we measure this income as the sum of pretax profit with IVA and CCAdj and net interest. But do our conclusions hold also with other definitions?
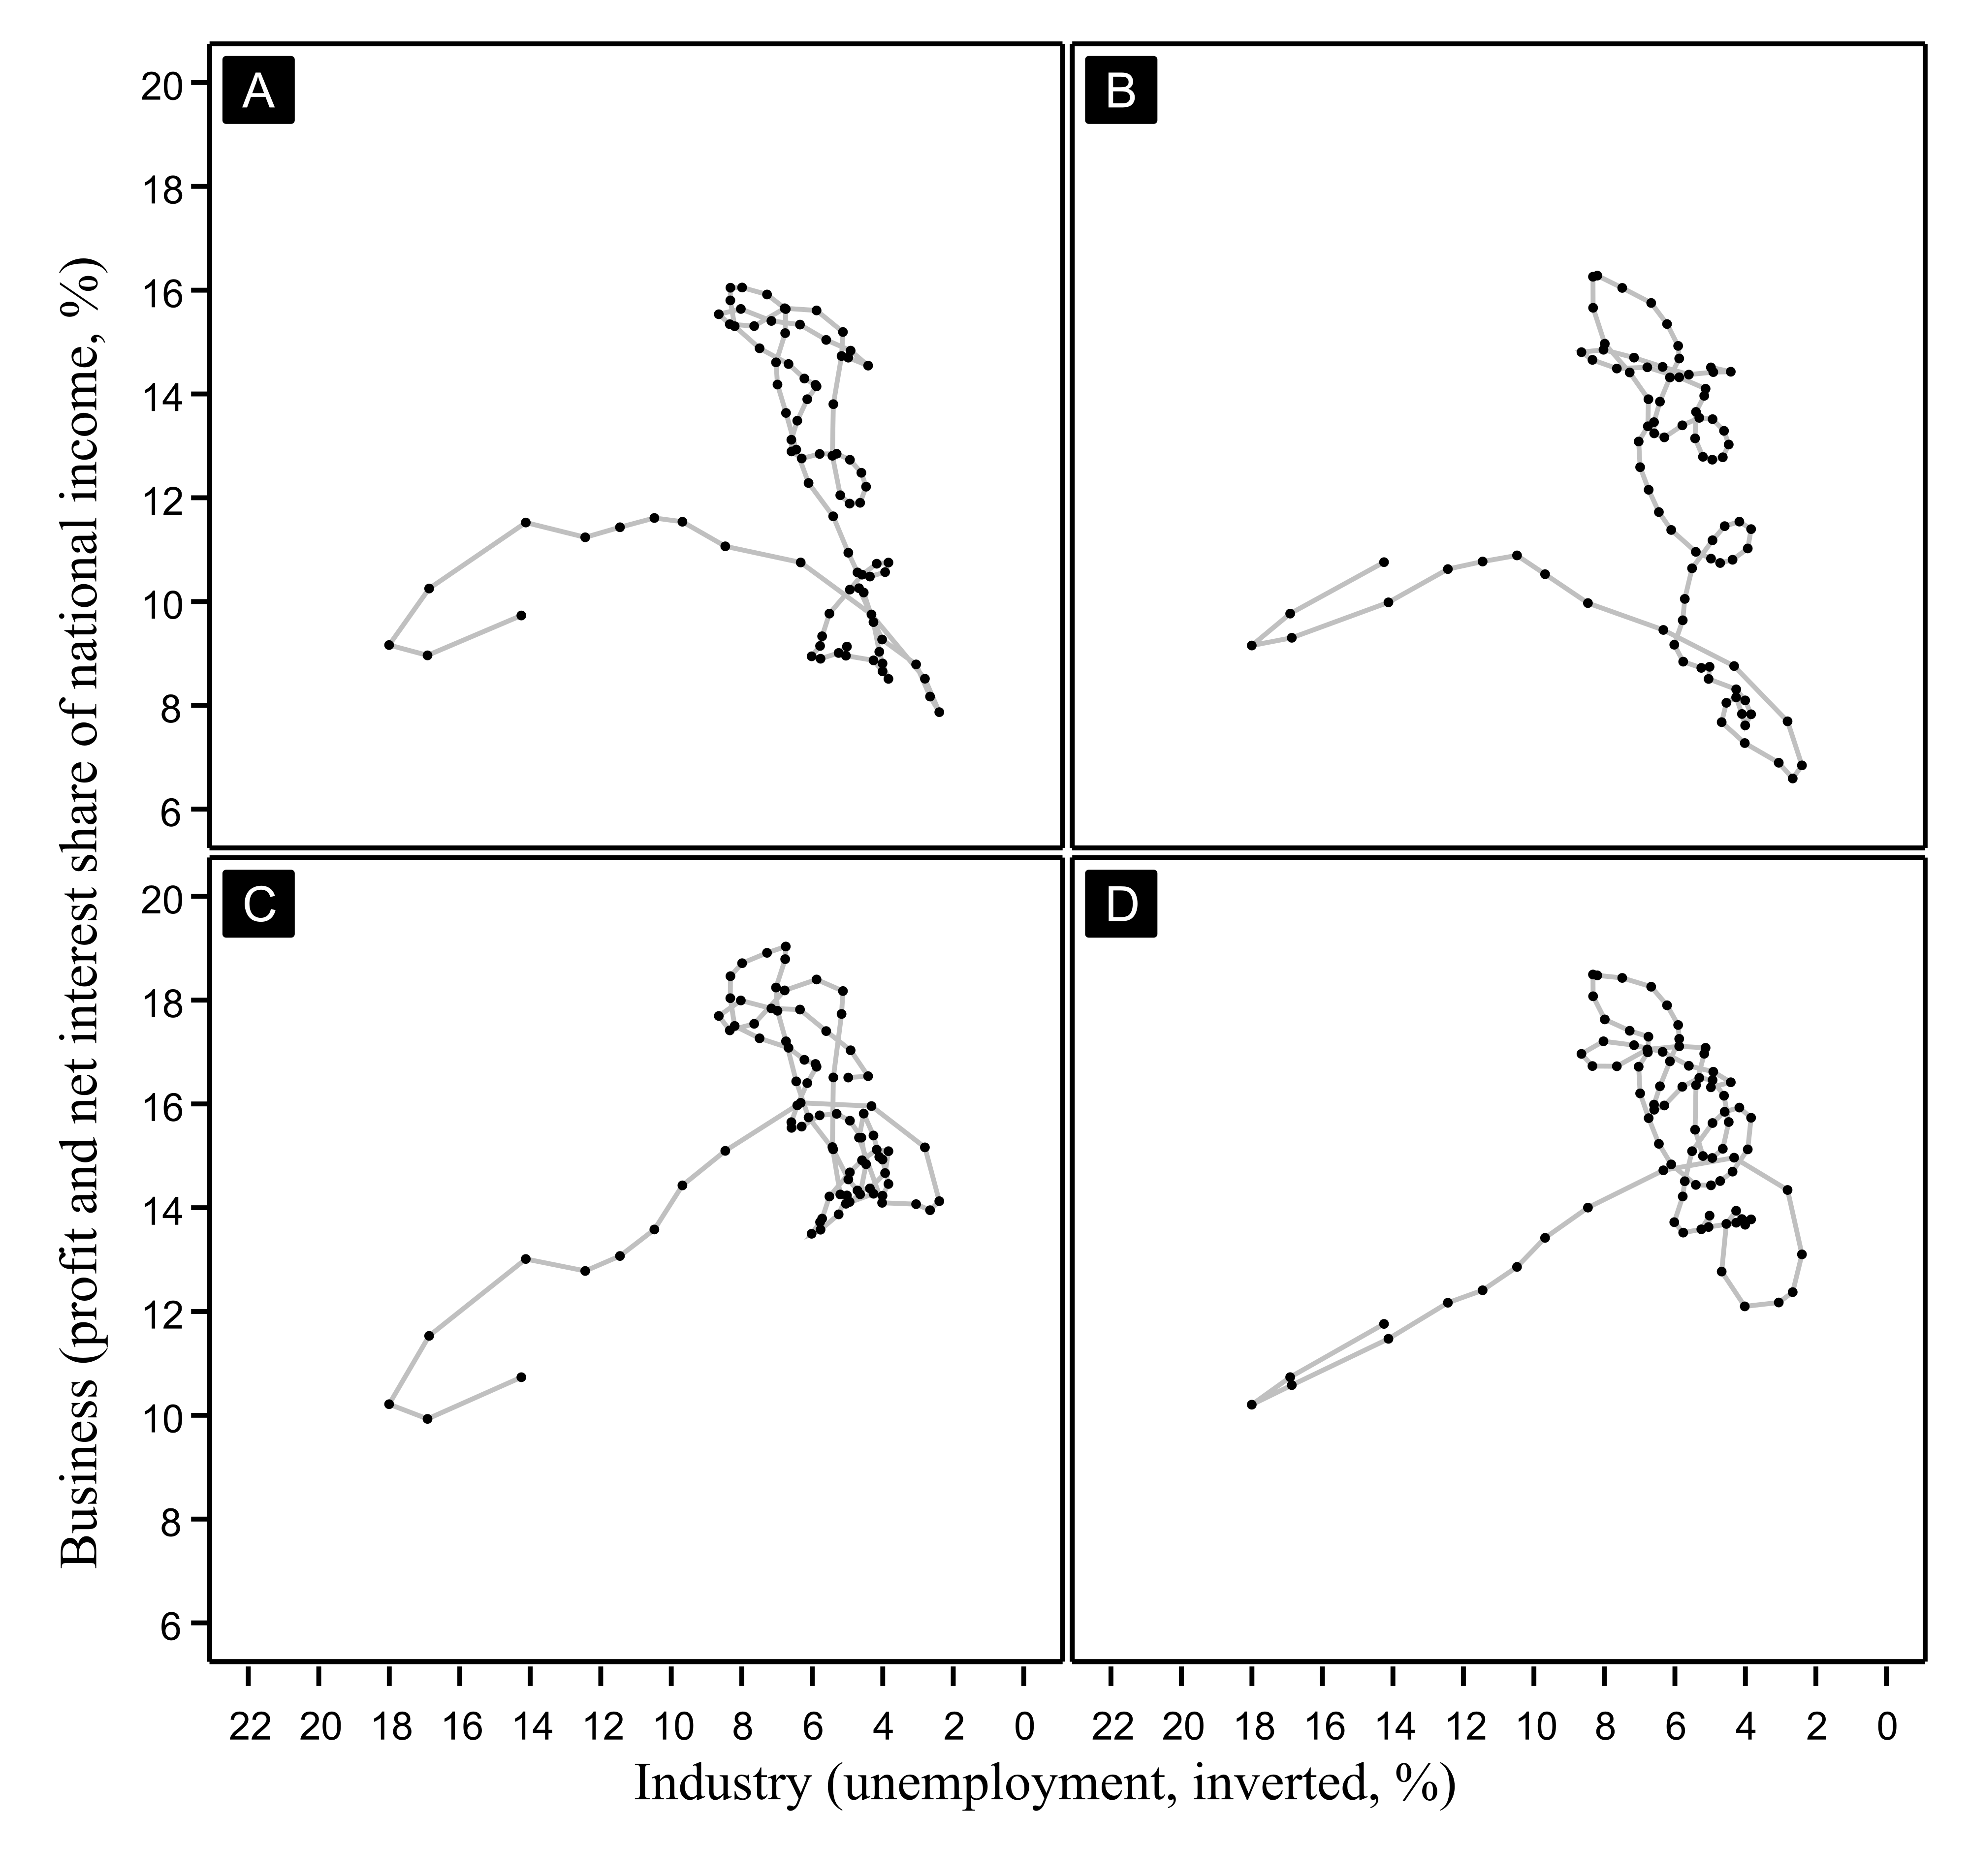 Figure 5: U.S. unemployment versus the profit and net interest share of national income, with various definitions of profit, 1933-2020 (5-year trailing averages)
Each panel shows a different measure of the capital share of national income.
A: After-tax profit without IVA/CCAdj and net interest;
B: After-tax profit with IVA/CCAdj and net interest;
C: Pretax profit without IVA/CCAdj and net interest;
D: Pretax profit with IVA/CCAdj and net interest.
SOURCE: National income, profit and net interest data are from the Bureau of Economic Analysis via IHS Markit (series codes: YN for national income; ZA for after-tax profit without IVA/CCAdj; ZAECON for after-tax profit with after tax profit without IVA/CCAdj; ZB for pretax profit without IVA/CCAdj; ZBECON for pretax profit with IVA/CCAdj; and INTNETAMISC for net interest). Unemployment data are from Historical Statistics of the United States till 1947 (series code: Unemployed_AsPercentageOf_CivilianLaborForce_Ba475_Percent) and from the U.S. Bureau of Labor Statistics via IHS Markit for 1948 onward (series code: RUC).
Perhaps the broadest measure of capitalist income is ‘net operating surplus’. In our view, though, this aggregate is far too encompassing. Like our original measure, this one too comprises pretax profit (with IVA and CCAdj) and net interest – but it also includes, among other items, proprietors’ income (a mixture of labour and ownership income earned by small, unincorporated businesses) and the rental income of persons (which is partly imputed to owners’ occupied dwellings). And the latter two categories do not represent capital income in our opinion.
We think that the concept of capitalist income should be limited to corporate profit and net interest, since these are the only flows representing the actual income claims associated with owning stocks, bonds and loans. The U.S. Bureau of Economic Analysis offers data on both pretax and after-tax profit, with or without IVA and CCAdj, and the combination of these four categories yields four distinct measures: (A) after-tax profit without IVA and CCAdj; (B) after-tax profit with IVA/CCAdj; (C) pretax profit without IVA/CCAdj; and (D) pretax profit with IVA/CCAdj (the measure used in Figures 2 and 3).
The panels of Figure 5 show the national income share of each of these four profit measures together with net interest on the vertical axis and contrast them with the (inverted) rate of unemployment on the horizontal axis.
And here, too, the results seem to confirm our general claim: the relation between industry and business is inherently nonlinear – positive when unemployment is high and negative when it is low.
9 A Brief Conclusion
We can go on and test additional permutations of the above features, and even add new ones, such as alternative measures of industrial sabotage. But to us, the more important takeaway is the broader implications of strategic sabotage and its nonlinear relation with business power.
Industry is not synonymous with business, the ‘nominal’ is not a mirror of the ‘real’, and economic growth need not go hand in hand with the capital share of income. Production is certainly crucial: without it, there can be no society, no capital and no capitalists. But what matters for the accumulation of capital and the capitalists who own it is not production as such, but the power capitalists exert over it, and this power requires strategic sabotage. Without the strategic sabotage of industry, business enterprise disappears, capital vanishes and capitalism disintegrates. And unless we decipher the complex patterns and consequences of this sabotage, we can understand neither the development and gyrations of capitalism, nor how to contest and change them.
Notes
Shimshon Bichler and Jonathan Nitzan teach political economy at colleges and universities in Israel and Canada, respectively. All their publications are available for free on The Bichler & Nitzan Archives (http://bnarchives.net).
-
Veblen considered power a means of business. The claim that power is also the goal of business is ours (Bichler and Nitzan 2019).↩︎
-
On the CasP rationale for using unemployment as a broad measure of sabotage and the relationship between unemployment and redistribution, see for example, Nitzan and Bichler (2009, particularly Ch. 12) and Bichler and Nitzan (2014).↩︎
-
The U.S. Bureau of Economic Analysis defines inventory valuation allowance (IVA) as ‘[a]n adjustment made in the national income and product accounts (NIPAs) to corporate profits and to proprietors’ income in order to remove inventory “profits,” which are more like a capital-gain than profits from current production’. Similarly, capital consumption adjustment (CCAdj) is ‘[t]he difference between private capital consumption allowances (CCA) and private consumption of fixed capital (CFC)’. Net interest also includes miscellaneous investment income, which, for brevity, we omit from our term here (though not from our measurement).↩︎
-
Note that although two thirds of economists believe that there exists a ‘natural rate of unemployment’ (Alston, Kearl, and Vaughan 1992; Fuller and Geide-Stevenson 2003), no one knows what this rate is or how to measure it. Using the long-term average as a substitute should offer a soothing alternative to the bewildered.↩︎
-
To be precise, we should note that the ‘raw’ data are also smoothed: each annual observation represents a 12-month trailing average, and the same can be said about monthly data smoothing weekly ones, weekly data smoothing daily ones, and so on.↩︎
References
Alston, Richard M., J.R. Kearl, and Michael B. Vaughan. 1992. Is There a Consensus Among Economists in the 1990’s? AEA Papers and Proceedings 82 (2, May): 203-209.
Bichler, Shimshon, and Jonathan Nitzan. 2014. Nonlinearities of the Sabotage-Redistribution Process. Research Note (May 19): 1-5.
Bichler, Shimshon, and Jonathan Nitzan. 2019. CasP’s ‘Differential Accumulation’ versus Veblen’s ‘Differential Advantage’ (Revised and Expanded). Working Papers on Capital as Power (2019/01, January): 1-12.
Fuller, Dan, and Doris Geide-Stevenson. 2003. Consensus Among Economists: Revisited. The Journal of Economic Education 34 (4, Fall): 369-387.
Nitzan, Jonathan, and Shimshon Bichler. 2009. Capital as Power. A Study of Order and Creorder. RIPE Series in Global Political Economy. New York and London: Routledge.
Nitzan, Jonathan, and Shimshon Bichler. 2014. Can Capitalists Afford Recovery? Three Views on Economic Policy in Times of Crisis. Review of Capital as Power 1 (1): 110-155.
Veblen, Thorstein. 1904. [1975]. The Theory of Business Enterprise. Clifton, New Jersey: Augustus M. Kelley, Reprints of Economics Classics.
Veblen, Thorstein. 1923. [1967]. Absentee Ownership and Business Enterprise in Recent Times. The Case of America. With an introduction by Robert Lekachman. Boston: Beacon Press.
Villarreal, Nicolas D. 2022. Capital, Capitalization, and Capitalists. A Critique of Capital as Power Theory. Pre-History of an Encounter, October 25.