Home › Forum › Research › My PhD and CasP › Reply To: My PhD and CasP
Hi Adam,
First, at points in this thread, empirical has been used as a synonym for quantitative, although JN has clarified that empirical includes qualitative. It is important to keep that front-and-centre.
Second, I somewhat disagree with BF on the possibility of including quantitative analysis in your work given the short time frame. The one caveat I will put on that is the intended objects of your quantitative analysis should be a publicly-traded corporation. They have the most readily available, comparable data available. Ideally, it would also be a U.S. corporation, or at least U.S.-listed corporation.
The basic tool of CasP is differential capitalization. The mechanics of it are remarkably simple. It’s just a ratio. The most common number for the denominator is the S&P 500 index, which serves as a proxy for dominant capital. Then, you can put the market capitalization in the numerator. Yahoo Finance provides publicly available comparable figures. JM is right to caution about just directly comparing share prices. However, Yahoo provides an “adjusted close” that factors in changes to the number of shares and dividend payments. It can serve as a suitable proxy for equity valuation.
A bare ratio between the S&P 500 index and the “adjusted close” of a random corporation does not say anything meaningful. But if you compare that ratio over time, it is a pretty good measure of the changing relative power of the corporation in the numerator.
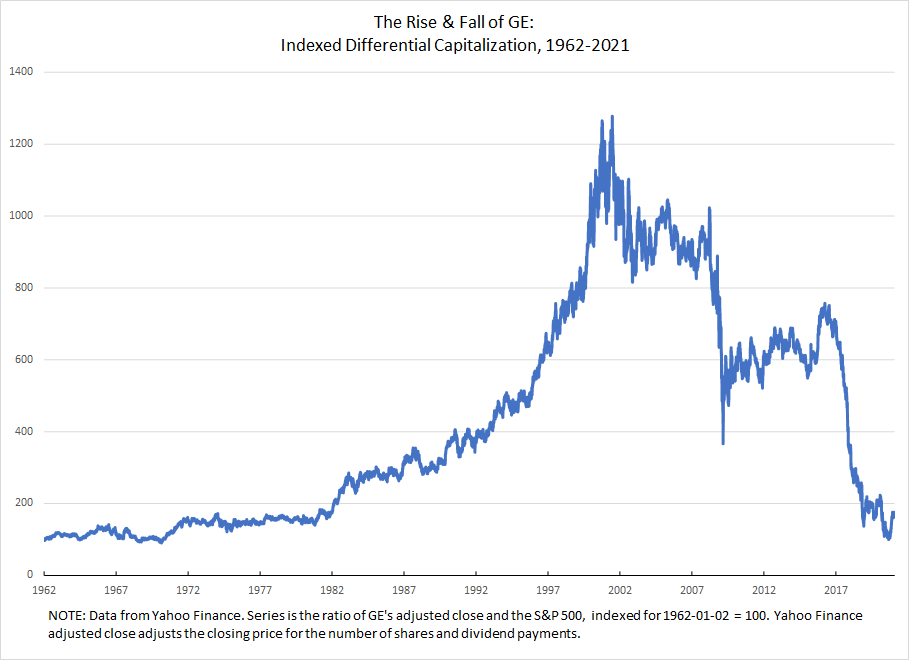
The above is the indexed ratio of GE’s adjusted closing price to the S&P 500. I downloaded both series from Yahoo Finance. You can select the date range to download as well as the frequency. Learning to do all that should take you less than an hour depending on your general web skills.
I opened both series in Excel. I had already downloaded the same date range, so I could directly compare the series as downloaded. But I first converted both to an index, using the first day of available data for GE as the base. This calculation just involves dividing each value by the base value. Common practice is to then multiple by 100.
Once you have both indexed series, you divide GE by the S&P 500. I again multiplied that by 100, so the value for the very first day is 100.
Performing all the steps in Excel could be very quick if you’re familiar with Excel or have good intuition with it. It could also be an exercise in extreme tedium. The indexing does not have to be performed day by day by day, thank the gods! The above has almost 15,000 data points. Calculating the indexed value point by point would have taken a very long time. Maybe worth it if my dissertation was on it, but thankfully I was able to perform the calculation is less than a second with Excel. If you are not familiar with Excel, you could do an on-line course and get the basics in a couple of weeks of less than an hour a day. If you have a friend that is very good with Excel, they could show you what you need in an hour.
The above graph is 90% the Excel default. Learning how to use Excel graphs can be equal parts hair-pulling frustration and fun. But you can probably get the basics in a few days.
Maybe this description of the process may have served to dissuade rather than persuade you. But if that is that case at least you know that the quantitative aspect of CasP is more than you can take on at the moment. I still think there is valuable qualitative work to be done using CasP, although it would be limited in terms of claims about changes in power as understood by the owners of capital.
The way I read a graph like the above is as a map to the changing relative power of GE as understood by “the market.” One thing that I think many critics of CasP misunderstand is that CasP is not claiming relative capitalization is an objective measure of objectively given power relations. Rather, capitalization is a measure of how the powerful understand and evaluate their own power. That means the above graph shows the rise and fall of GE’s power, relative to dominant capital, as interpreted by the powerful themselves. Through the 90s, they saw GE growing more powerful. Come the dot-com bust, GE slumps, but remains highly powerful. Then, with the GFC it plummets. It limps back upward for the next few years, but fails to achieve its previous heights. Then, beginning in 2016, it starts to tear itself apart. Now, it is a shadow of its former self.
Rarely can you one-to-one a given event and significant, sustained market movement, although I analyzed such an event in the case of the Deepwater Horizon with my paper in Valuation Studies. Instead, there are numerous events and processes occurring that are leading the vested interests to see GE’s relative power growing and falling. It might be a commanding CEO with lots of political connections getting favourable laws passed. It might be their luck at offering a particular product suited to a cultural moment and then properly exploiting that moment with sophisticated marketing. It might be a research breakthrough on a new drug for which they will have a multi-decade patent and there is little potential competition on the horizon.
Constructing convincing narratives about why power has waxed and waned for a given capitalized entity is extremely important and one reason why we need more people doing qualitative research into corporate power.
JN cautioned that quantitative research can be scary not just because of the techniques but because of the risk it poses to our expectations. You might have a narrative in your head about the power of the companies has shifted during the period of activism you’re analyzing. And you might have some sense of the causal relationship between the activism and the corporation’s power. However, if the movement is relatively small and the company is relatively large, then any effect will disappear into all the events that bear on a massive global corporation. That does not mean there is no power story to be told and no insights to be gleaned from CasP. But it does mean you might not get the image you’re imagining. That said, if the movement is large and/or relatively effective and the company is relatively small, you absolutely might see the effects of their activism. In a chapter I wrote with Jeffrey Monaghan, which has just be uploaded to the bnarchives, we looked at several activist campaigns, including SHAC: Stop Huntingdon Animal Cruelty, which was an anti-vivesection campaign. Our research showed how the criminalization of SHAC was absolutely read by the market as increasing the power of Huntingdon.
I strongly encourage you to dig around, see what you can find quantitatively. Maybe you won’t end up doing an analysis of differential capitalization. But you’ll definitely learn some things about the targets of the anti-fracking movements.