Home › Forum › Political Economy › Inflation is always and everywhere a redistributional phenomenon
- This topic has 25 replies, 5 voices, and was last updated April 11, 2026 at 6:44 pm by Jonathan Nitzan.
-
CreatorTopic
-
November 21, 2021 at 8:11 pm #247200
Inflation is the average rate of change of individual money prices. In this narrow sense, Milton Friedman’s claim that inflation is always and everywhere a monetary phenomenon is correct. But underlying the average rate of inflation, individual prices change at different rates. And in this broader sense, inflation is always and everywhere a re-distributional phenomenon.
The purpose of this thread is to invite evidence that puts this last proposition to the test.
To kick-start this process, we shown in this chart two series: (1) the U.S. wholesale price inflation (which measures the average rate of change of prices charges by firms); and (2) the differential markup of the 500 largest firms in the U.S. (we defined the markup as the ratio of net profit to sales and the differential markup as the ratio of the top-500 markup and the business-sector markup).
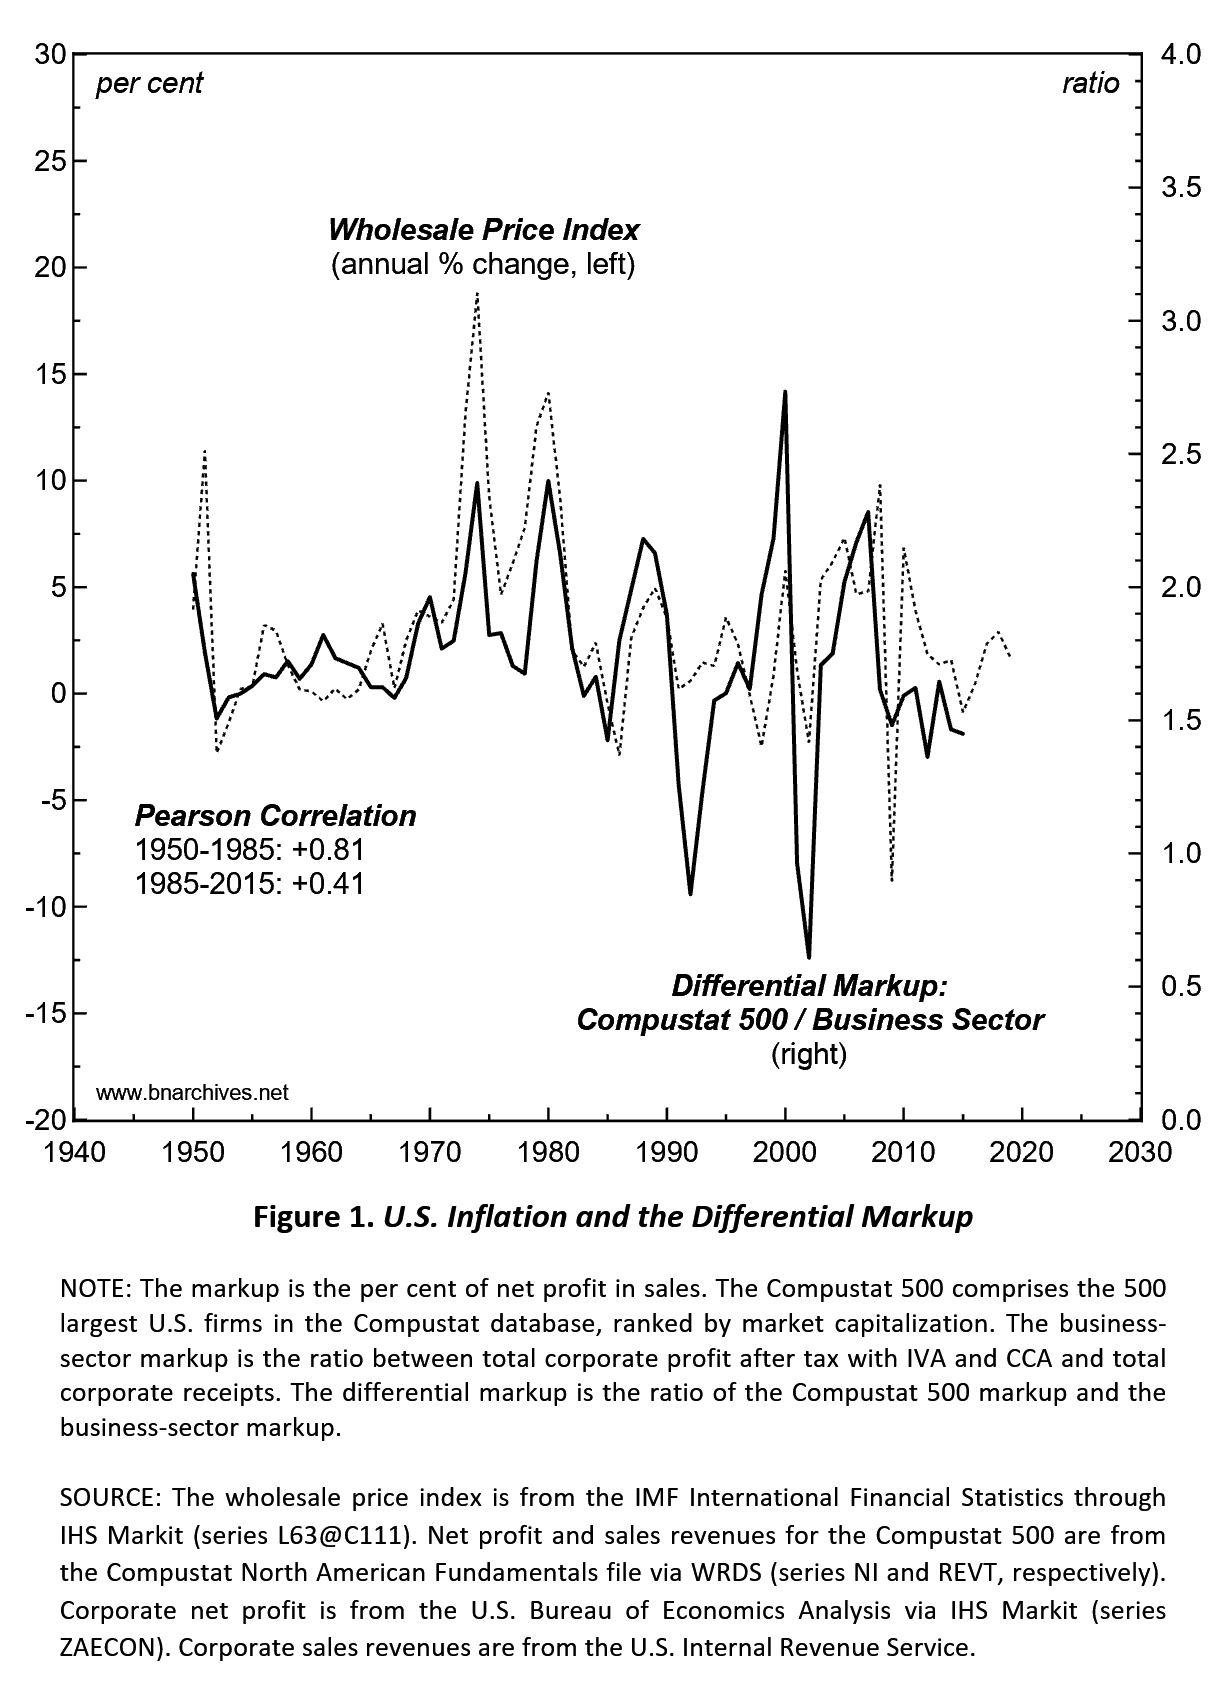
The correlation between the two series is positive throughout — meaning that wholesale price inflation has tended to redistribute profit, systematically, from smaller to larger firms.
However, note that there is a marked change in the mid-1980s, when the correlation coefficient drops from +0.81 in the first period to +0.41 in the second. This drop suggests that inflation, although still redistributional, is now augmented by other factors, such as changes in wages, material costs, taxation, etc.
- This topic was modified 4 years, 8 months ago by Jonathan Nitzan.
-
CreatorTopic
-
AuthorReplies
-
-
November 21, 2021 at 10:26 pm #247201
There are two ways to increase differential markup: (1) reduce your costs, including your cost of capital, and (2) increase your prices.
The mid-80s started a fundamental shift in Finance’s attitude towards the cost of captial/credit. We saw both the beginning of a reduction in the 10Y Treasury rate (which reduced the Fed Funds Rate and corporate costs of capital accordingly) and the rise of credit cards whose interest rates were not anchored by the Fed Funds Rate to expand the purchasing power of consumers without increasing their pay.
I think the Werner paper I linked to in a previous post is very important to understanding the broader outlines and consequences of reducing the cost of capital on GDP. What’s missing is research on consequences of easy credit for consumers at high interest rates unconnected to corporate cost of capital.
-
November 22, 2021 at 9:37 am #247202
Thanks for updating this research, Jonathan. I wonder if you would be able to share the underlying data. Particularly the IRS historical data seems to be difficult to get, and I vaguely recall that you and Shimshon compiled it manually from old documents. It would be nice for researchers to have that data available in one place.
-
November 22, 2021 at 10:05 am #247203
Also, a question about methods. Could you clarify how you calculate the markup of the Compustat 500? Do you sum all profits (across companies) and divide by the sum of all sales? Or do you calculate the markup for each company, and then calculate the mean across companies?
-
November 22, 2021 at 4:30 pm #247207
I wonder if you would be able to share the underlying data.
Enclosed is our Excel data file for active corporations reported by the U.S. IRS. The file includes the number of corporations and their business receipts.
Could you clarify how you calculate the markup of the Compustat 500?
Regarding the profit markup for the Compustat 500 and the U.S. business sector: both are computed by dividing aggregate net profit for all firms in the group by aggregate sales for all firms in the group.
- This reply was modified 4 years, 8 months ago by Jonathan Nitzan.
- This reply was modified 4 years, 8 months ago by Jonathan Nitzan.
Attachments:
You must be logged in to view attached files.
-
-
November 22, 2021 at 5:57 pm #247211
Much appreciated!
-
November 30, 2021 at 3:19 pm #247250
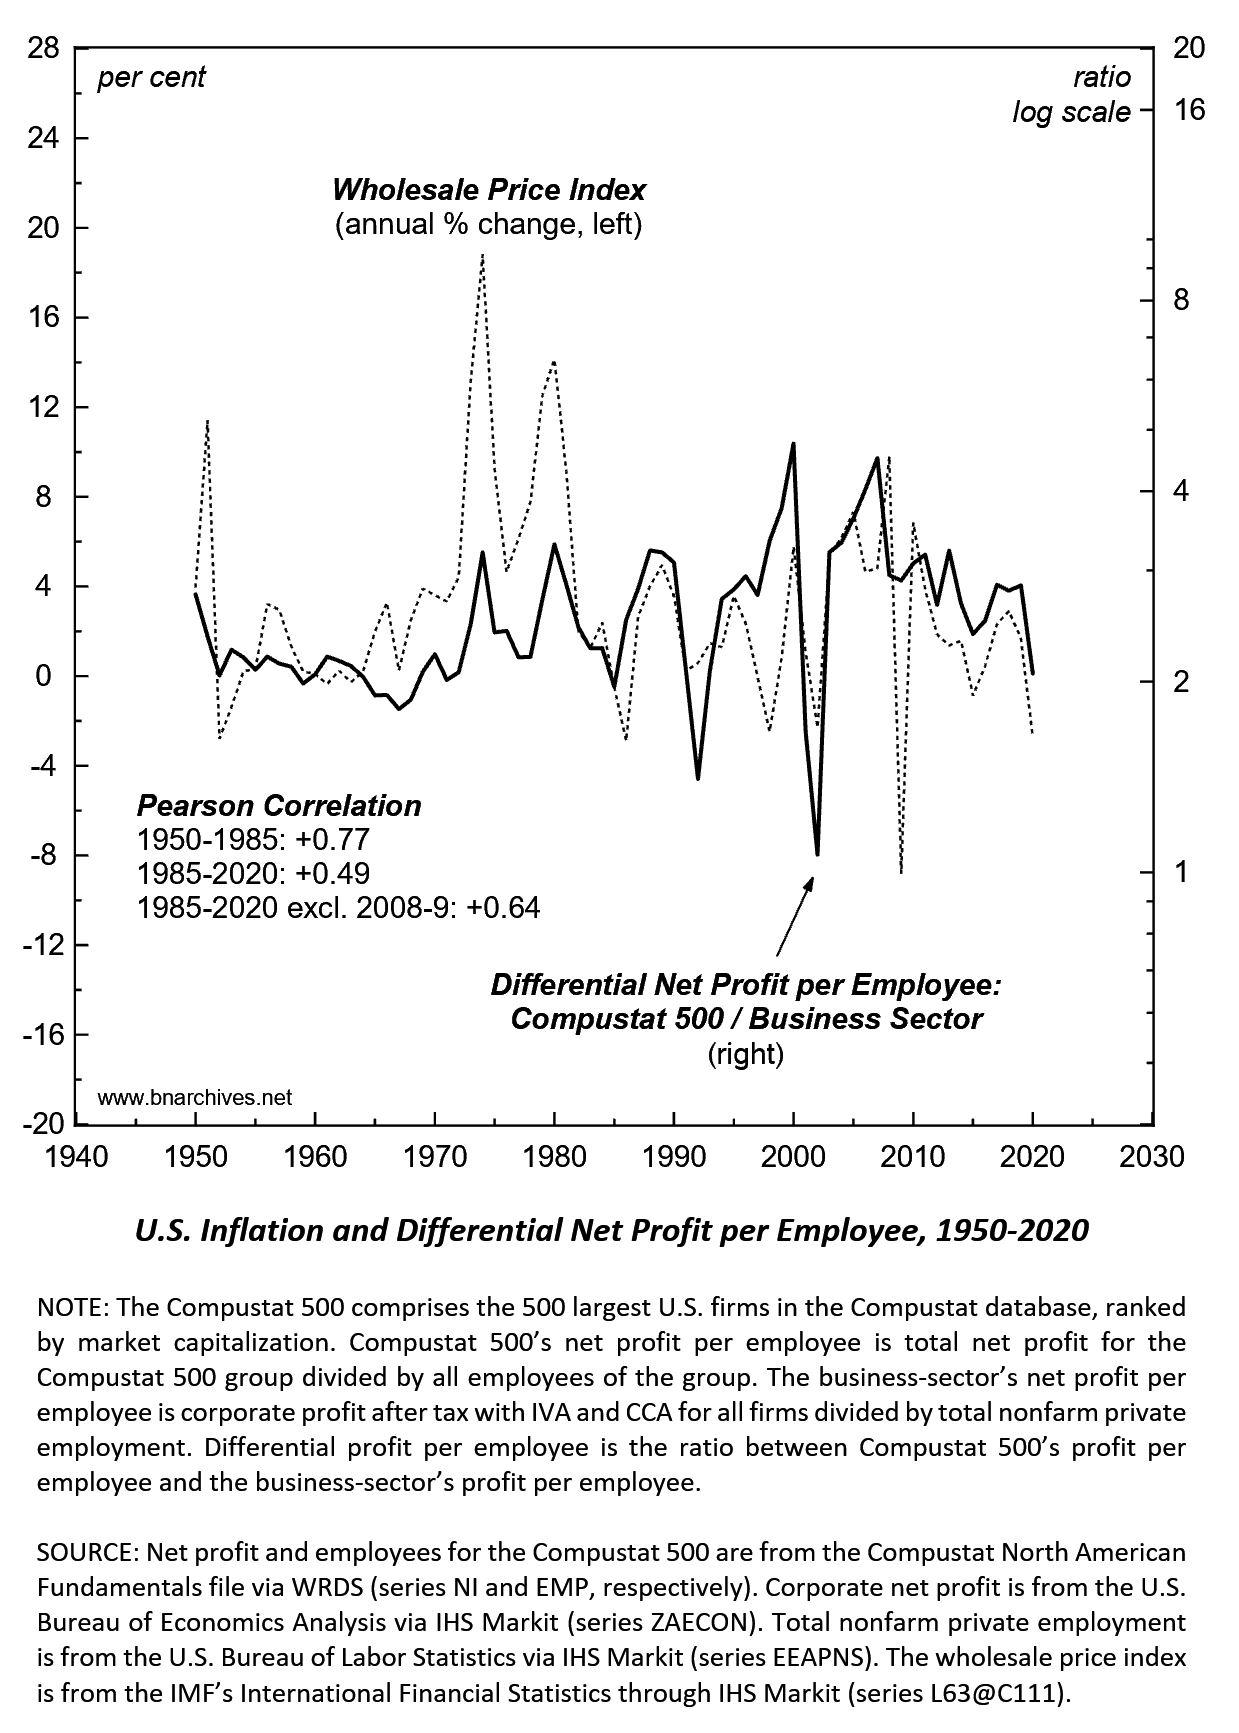
In Capital as Power we argued that dominant capital can profit differentially in two ways: by (1) raising the size of its organization, measured in employees, faster than others (differential breadth); and/or (2) by raising its profit per employee faster than others (differential depth).
1. This chart measures differential depth in the United States. It takes the ‘Compustat 500’ — the 500 largest firms listed in the U.S. ranked by market capitalization — as a proxy for dominant capital; it measures the overall net profit per employee in this group; and it calculates the ratio of this measure relative to the net profit per employee in the business sector as a whole.
2. The chart then shows that, in the United States, differential depth has been tightly correlated with the process of inflation, measured by the annual % change of the wholesale price index. The Pearson Correlation between the two series is +0.77 for 1950-1985 and 0.64 for 1985-2020 (excluding the two outlayers of 2008-9).
In other words, when it comes to the relationship between dominant capital and the rest of the business sector, inflation is highly redistributional: it raises the profits per employee of larger firms faster (or lowers them more slowly) than those of smaller firms, and it does so systematically.
(For a similar relationship between inflation and the differential markup of dominant capital, see here.)
- This reply was modified 4 years, 7 months ago by Jonathan Nitzan.
- This reply was modified 4 years, 7 months ago by Jonathan Nitzan.
-
November 30, 2021 at 4:49 pm #247253
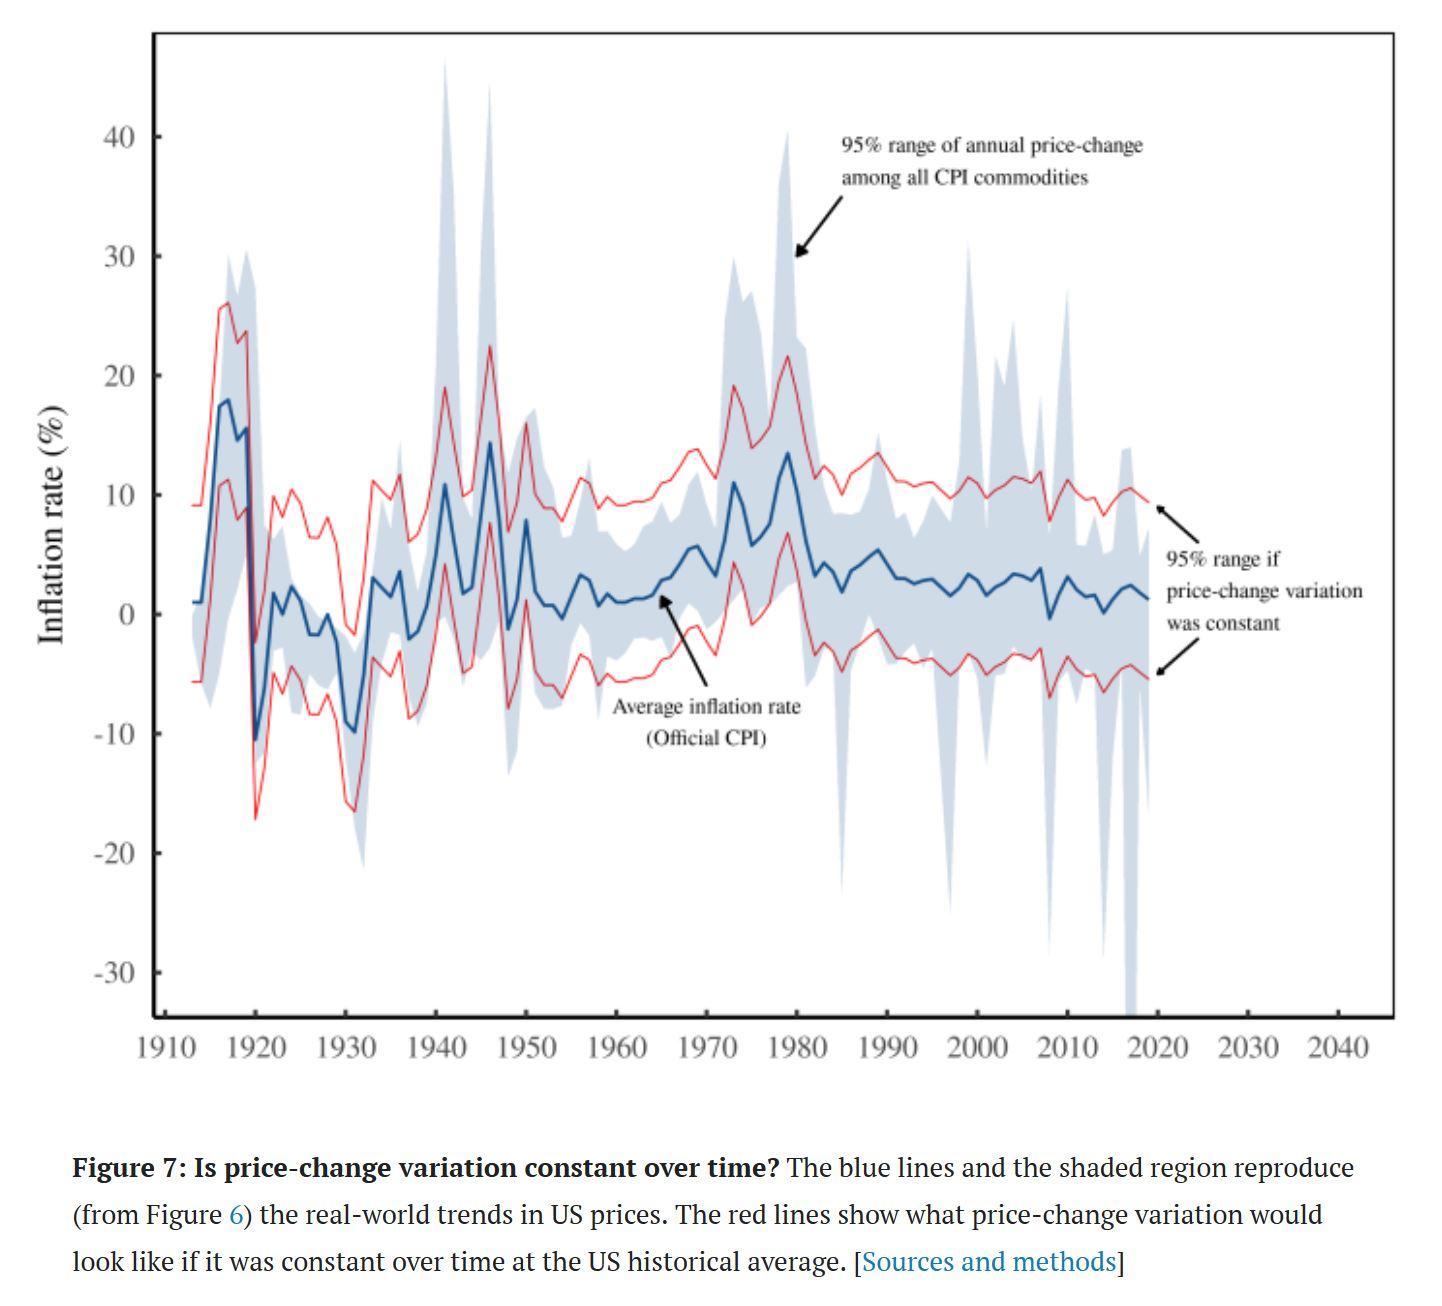
This chart, taken from Blair Fix’s post ‘The Truth About Inflation’ (November 24, 2021), is remarkable for three reasons.
1. It shows the actual variability of U.S. consumer price changes over time — something that I haven’t seen done before.
2. It demonstrates that this variability tends to be far larger than the measured rate of inflation from which it deviates.
3. It confirms that the variability isn’t constant — it changes over time and in ways that are seemingly unrelated to the level/direction of inflation.
On a superficial level, these findings suggest that reported inflation is ‘inaccurate’ — but then, to say that inflation is inaccurate is to totally miss the point. An inaccurate measure is one that deviates from some true magnitude — yet, inflation has no true magnitude to start with.
Commodity prices are set by those who own, sell and buy them; as such, prices reflect relations of power; and power is inherently differential, and therefore impossible to aggregate.
And yet, this is exactly what the measured rate of inflation tries to do — to aggregate relations of power. No wonder this aggregation borders on the meaningless.
- This reply was modified 4 years, 7 months ago by Jonathan Nitzan.
- This reply was modified 4 years, 7 months ago by Jonathan Nitzan.
-
November 30, 2021 at 8:14 pm #247256
By Shimshon Bichler & Jonathan Nitzan
If you thought stagflation (stagnation + inflation) is an anomaly, think again.
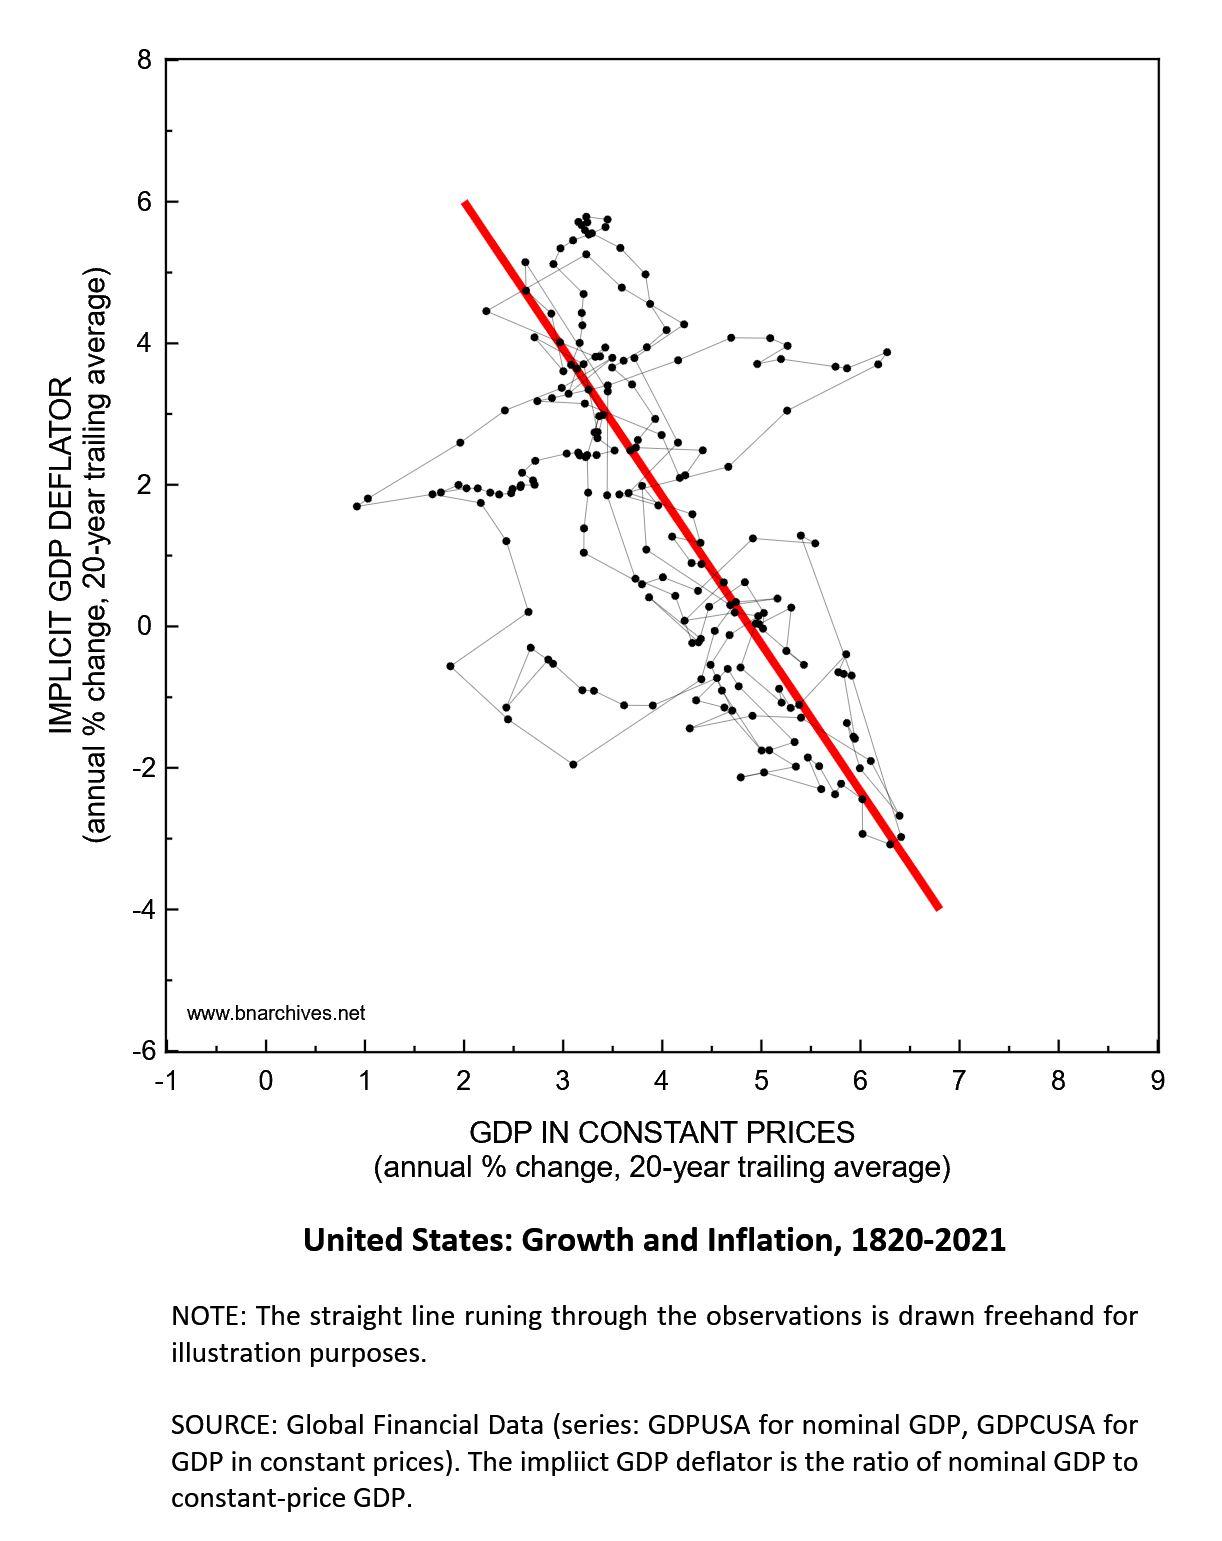
This chart plots the U.S. annual rate of inflation, measured by the rate of change of the implicit GDP deflator, on the vertical axis, and the growth rate of ‘real’ GDP (in constant prices) on the horizontal axis. To eliminate the ‘noise’ associated with both measures, each is smoothed as a 20-year trailing average (that is, each observation on the chart shows the average rates of inflation and growth over the previous 20 years).
The conventional creed
Now, the usual story you’d hear from economists is that inflation and growth tend to go hand in hand: when growth is rapid, the buildup of ‘bottle necks’ causes prices to rise faster; and conversely — when growth is sluggish or when there is a recession, inflation decelerates or even turns into deflation.
With this logic, you’d expect the red line drawn through the observation to be positively sloped. In other words, you’d expect it to start from the lower left side of the figure and rise toward to the upper right.
The actual world
But that’s not what you see in the chart. In fact, you see the exact opposite. For two centuries now, the relationship between U.S. growth and inflation hasn’t been positive, but negative!
On the lower right part of the chart we get ‘growthflation’: a booming economy with low inflation (or even deflation). On the upper left part, we get ‘stagflation’: a stagnating economy with rapid inflation. In other words, we get what economists say is possible only by fluke or due to exogenous shocks.
Yes, that’s right. From the economist viewpoint, the last 200 years U.S. inflation and growth were one big exogenous fluke.
The other possibility is that economists simply have no idea what they’re talking about.
Inflation is always and everywhere a re-distributional phenomenon
In our own CasP research, we’ve argued that this ‘anomalous’ U.S. reality is no anomaly at all.
Capital is power; power means being able to raise prices faster than others; raising prices faster than others requires the threat and exercise of strategic sabotage; and one of the most important forms of strategic sabotage is unemployment and stagnation.
In the capitalist mode of power, stagflation isn’t the exception, it’s the norm.
Further readings
Inflation as Restructuring (1992)
The Global Political Economy of Israel (2002: Ch. 4)
Capital as Power (2009, Ch. 16)
- This reply was modified 4 years, 7 months ago by Jonathan Nitzan.
- This reply was modified 4 years, 7 months ago by Jonathan Nitzan.
-
November 30, 2021 at 11:07 pm #247260
The other possibility is that economists simply have no idea what they’re talking about.
The answer correct is: mainstream economists are lying liars who lie.
The direction of their “errors” is too consistently in favor of capital to be anything other than purposeful on someone’s part.
-
December 1, 2021 at 1:43 am #247263
I’m not a data scientist, so have little to contribute to this thread. But i do find it fascinating. So i went looking to see who else has looked at similar lines of thought.
Honestly the closest I could find is what I think might be a White Paper by Brian Lowell of McKinsey insights
and as White Papers go, it is very sparse on Sources, but here’s the related McKinsey article
Not sure if this is of any help to anyone
-
December 1, 2021 at 1:36 pm #247265
More on the re-distributional effect of inflation by firm size
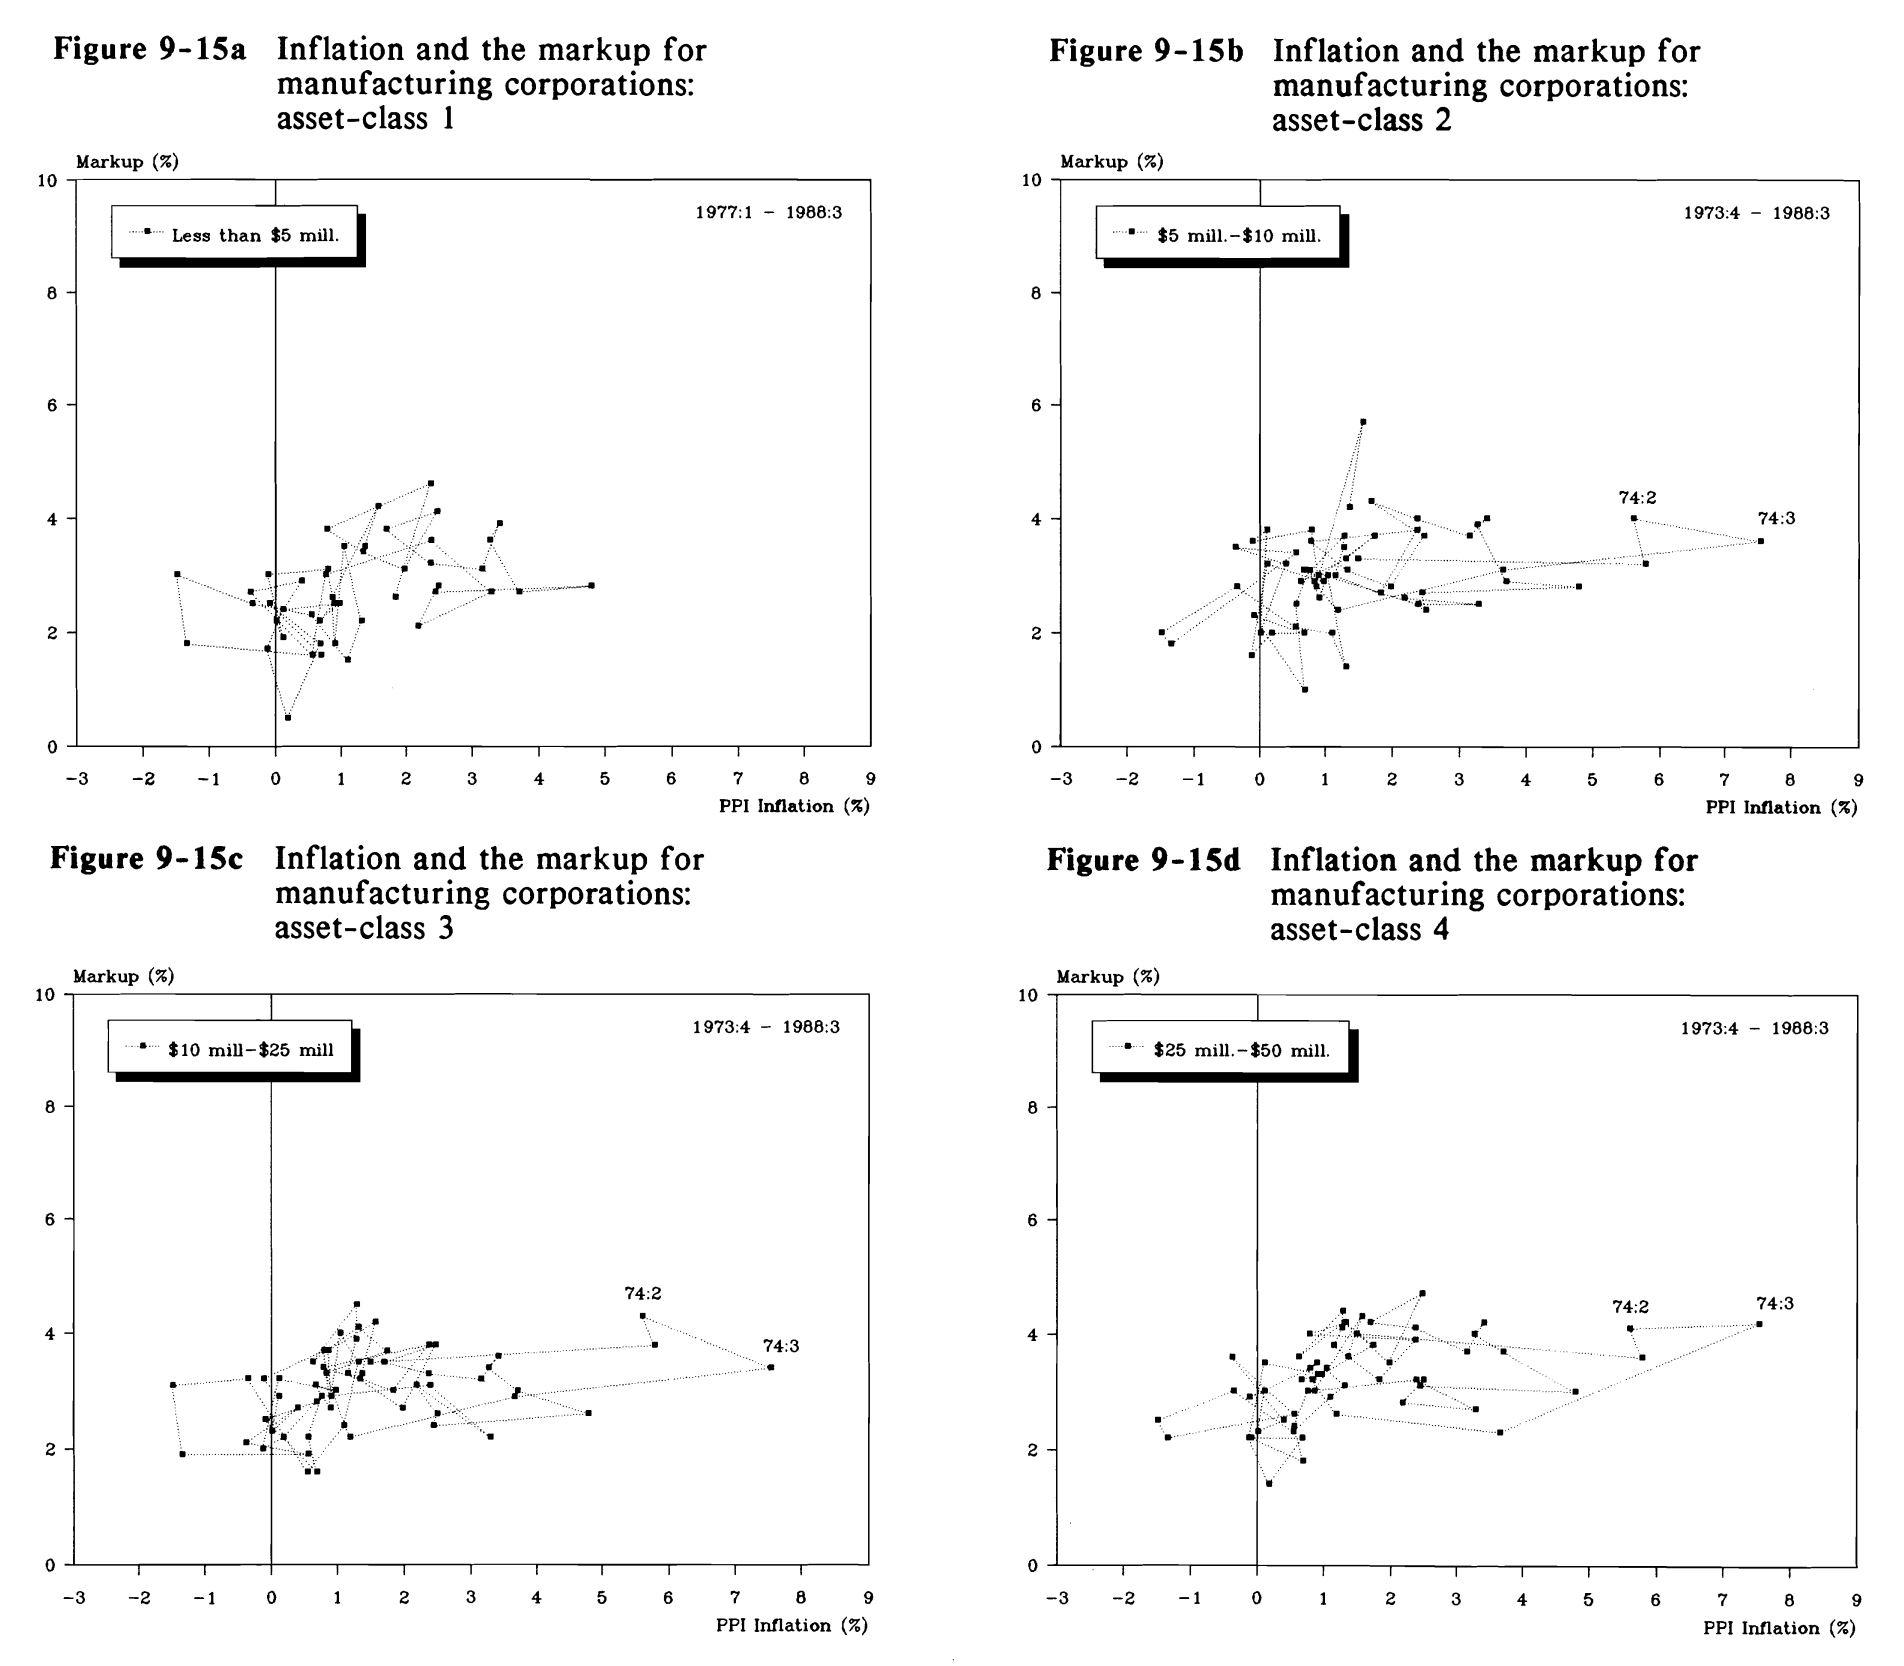
These figures are taken from my 1992 PhD dissertation, Inflation as Restructuring (pp. 419-20). The data pertain to the U.S. manufacturing sector. Each panel shows the experience of a different size-group of corporations: (1) firms with less than $5 million in assets, (2) $5 to $10 million, (3) $10 to $25 million, (4) $25 to $50 million, (5) $50 to $100 million, (6) $100 to $250 million, (7) $250 to $1 billion, and (8) over $1 billion.
All panels show the same relationship: the quarterly net profit markup (net profit/sales) on the vertical axis, and the quarterly rate of producer price inflation on the horizontal axis.
Overall, the panels demonstrate two things:
(1) In manufacturing, the net profit markup is positively correlated with inflation: inflation redistributes income from workers/lenders/suppliers/tax authorities to firms.
(2) This inflationary redistribution tends to become both steeper and tighter with firm size: the larger the firm, the greater and more pronounced the effect of inflation on its net profit margins.
-
December 14, 2021 at 8:07 pm #247361
I like CasP theory not for its technical detail (sorry, some of its mechanics are as dry as dust to me) [1] but for its larger insights as applied to real political economy. I have written the text below to counter bowdlerized MMT – Modern Monetary Theory (as presented by some lay acolytes of MMT) on other sites. Am I on track or off track with respect to CasP?
I don’t agree with the people who say asset inflation doesn’t matter. It does matter, as does almost all inflation. However, before people misconstrue me, there are many things which can matter and inflation is just one of them. In all cases, what matters is relativities – sizes of differences and changes in sizes of differences.
Inflation is not an absolute phenomenon, it is a relative phenomenon. Another way of saying this is that inflation differentials matter. If the things that I spend my wage or pension on inflate at 5% per annum and my wage or pension inflates at 5% per annum, then I am fine now if I was fine before. Real inflation of my typical basket of goods measured against my income is zero in this case.
The co-developer of Capital as Power theory writes:
“Inflation is the average rate of change of individual money prices. In this narrow sense, Milton Friedman’s claim that inflation is always and everywhere a monetary phenomenon is correct. But underlying the average rate of inflation, individual prices change at different rates. And in this broader sense, inflation is always and everywhere a re-distributional phenomenon.” – Jonathan Nitzan.
The key concept here is “Inflation is always and everywhere a re-distributional phenomenon”. If my typical basket of purchases of good and services inflates at 5% per annum but my wage is limited to 2% per annum wage rises (this sort of thing has been typical in the neoliberal era) then I am poorer every year in the real resources, real good and services that I can purchase.
If the typical house in Australia cost 3.5 times the median annual gross wage in 1980 and now costs 7 times the median annual gross wage in 2021, then all else being equal, it is much harder for the average or median worker to buy a house these days. Now, it is true that all else is not necessarily equal. The interest rates are certainly much lower currently. Even so, the current situation presents young people with new problems and risks for domicile acquisition and household formation. Saving the minimum deposit for the house becomes much harder, delaying house acquisition. A loan becomes a higher risk proposition in some senses, in that the ability to repay the loan depends heavily on the very low interest regime being maintained. Empirically, the acquisition of dwellings by young people has dropped and household formation rates have also dropped. These are real negative economic and social outcomes.
To return to the point about differential inflation, Jonathan Nitzan states “Inflation has no true magnitude to start with.” What he means is that there is no objective, true or absolute measure of overall or aggregated inflation. To believe so is to believe in a constructed fallacy of classical economics (my words there). The problem is that inflation is measured in the numeraire (the dollar in our case) which itself has a sliding (expanding and contracting) value both against other currencies and against all goods and services priced in it. The measurement instrument is itself not a constant standard. An aggregated inflation rate involves an aggregation of unlike goods and services AND the aggregating of them in a common (and fictitious) dimension.
When science proceeds, it aggregates items in a common real dimension. It may aggregate them by mass, for example, or by one of the other real dimensions given in the SI table (International System of Units). (See Blair Fix, another CasP practitioner for details on this.) Economics and economic activities do not have this kind of “luxury of objectivity” (except perhaps at the level of quantity surveying). Economics is “condemned” (in part) to operate at the level of “aggregated subjective evaluation and valuation”. That is what prices are. We could also call “aggregated subjective evaluation and valuation” rank dependent expected utility (RDEU). That is what modern micro-economists call it. Certain macro economists do not place much or any store in microeconomics. Steve Keen is one. I suspect Bill Mitchell (MMT) may be another but I am not sure.
I think such macro-economic and Keynesian thinkers (but not post- or neo- Keynesian) are correct in placing little to no store in RDEU (or in Utils or SNALTs) as theories of supposedly objective or quasi-objective value. A “theorem” or at least heuristic derivable from that position of scepticism about such value theories is that the idea of aggregated inflation and its use in macroeconomics is one which should be applied with great care.
Aggregated or averaged inflation values tell us little to nothing about relative or differential inflations in detail in the system and this is a situation where the devil very much is in the detail. Asset inflation (as inflation of asset values relative to average or median income) can be a very dangerous phenomenon leading to the impoverishment, indigence and even homelessness of not only the unemployed but also of lower waged workers plus also leading to the shrinking of the middle class.
High asset inflation, relative to unemployed and worker incomes, also permits the holders of assets to become differentially richer and, if the process continues long enough and to its logical conclusion, to become the holders of almost ALL assets in the economy with workers reduced to being perennial renters feeding the incomes and wealth of the slumlords and rentiers.
Thus, in summary, I do not agree at all that asset inflation (relative to median incomes) does not count. It is an extremely dangerous process by which the middle class and working class are impoverished and dispossessed and it will lead to, is leading to, extreme inequality, extreme economic inefficiency and probably the necessity for revolution if social democracy is not permitted or able to set matters right.
Note 1 – I probably don’t have the intellectual discipline to knuckle down to that level of technical detail but I appreciate the technical part of the theory is very important. Empirical proofs rest on it.
-
December 14, 2021 at 10:40 pm #247362
Rowan,
For whatever it’s worth, I think you are “on track with respect to CasP.” By blending a little Steve Keen with Richard Warner, CasP heterdoxy, and my heresy, I can explain a big reason why even asset inflation is redistributional according to CasP theory.
MMT, while correct as far as it goes, is a counterfactual hypothesis and will remain so as long as private actors are able to create money through the extension of interest-bearing credit.
The key here is credit, as it is credit (aka “leverage”) that drives asset inflation.
Steve Keen has previously noted that credit also drives GDP growth, and he has shown, in very coarse terms, that credit contraction leads to increasing unemployment, while credit expansion leads to increasing employment.
But this is only true of credit that gives rise to money spent on goods and services. Credit that gives rise to capital that is spent on financial assets (which includes M&A) does not add to GDP (except indirectly as payment for services; GDP does not count the value of financial assets exchanged in the financial markets).
Because of this economic segregation (or disaggregation) of goods and services, on the one hand, and financial assets, on the other, I’ve come to think of capitalist societies as containing two distinct poleis, each with a distinct economy, both “real” and operating according to their own rules, that are bound together by one thing more than any other: a finite amount of available credit.
According to “orthodox” CasP theory, capitalists are bound just as much by certain laws of the system they rule, and the cardinal law is that debts that cannot be repaid, won’t be repaid (a Michael Hudson reference). Financial crises, which fundamentally always begin in the capital economy, most often come about due to the overextension of credit (in either or both economies) and the resultant inability to cover called debts, which leads to the fire sale of financial assets, as it did with Lehman.
Richard Warner, a German economist, observed that low interest rates, contrary to mainstream dogma, correlate to low GDP growth not high GDP growth, and he theorizes this is because the interest rates, when low enough, encourage the purchase of financial assets of the capital economy over productive investments in the political economy. That is credit extended to the capital economy results in that same amount of credit being denied the political economy, resulting in low or slow GDP growth.
So, this redistribution of available credit to fuel asset inflation over productive investments in the political economy harms the political economy significantly, not just by inflating the cost of buying a home, but by failing to produce good paying jobs for everyone willing to work.
-
-
December 15, 2021 at 4:57 am #247363
Scot Griffin,
I agree. I have written, on other blogs if not here, of “my” thesis that modern capitalism has dual circuits of capital, to some considerable extent. There is the worker-consumer circuit and that part of productive business which uses productive workers and supplies consumers (while in a sense parasitising on the whole process by exploiting workers and consumers both). There is also the debt-asset circuit which functions mainly to create debt money for the purchase of assets and the concomitant process of generating asset inflation (relative to wages and the consumer items workers buy on a weekly to annual basis). The cross-over is perhaps fairly limited (though I have no data on this). The circuits are kept mainly separate and the two different sets of inflation are able to be kept apart and “differentialed”, as a verb. Q.E. (Quantitative Easing) is perfect to run this set up. It’s a brilliant scheme. The innovators of it have stolen a march, and many billions, on everyone else.
One could, I am guessing, construct a hydraulic model of this. The hydraulic model would use the analogy of thermohaline currents and boundaries (since we are talking of stocks and flows of a quantity). Every water molecule is created equal (apart from rare exceptions like heavy water). However, bodies and flows of water can involve internal currents and layers which remain somewhat discrete and maintain somewhat discrete boundaries because (in water’s case) of thermal, saline and other gradients.
Note: Cheesy video removed. The popularised “science” of the “two oceans” may be junk science. Best to avoid that analogy. But the thermohaline currents analogy seems fine, if speculative, to me.
The thing is this. How can bodies and/or flows of dollars be different for purposes of flow and mixing? The thermohaline analogy is not transferrable simplistically. Dollars are notional, not real and they don’t in theory have real gradients of any substance or quantity/quality “inhered” or dissolved in them (what one might call a field of values and/or vectors and/or tensors). I can’t do any of that kind of maths by the way. But if we look at money we can see it is constructed differently depending on amounts (the quanta sizes). There is often a minimum quantity of money (and/or of purchased item) which is permitted in trades and staking and thus conditions the “play” of the “game”. There can be “permissible quantity” gradients across the economy. Wholesale and retail show this on the commodity and goods side. In gambling and in investment there are often minimum money stakes or even minimum wealth conditions to permit you to enter the “game”. If one does not have a liquid million dollars for example or an equally acceptable asset to stake one cannot enter a “game” where the minimum stake or investment is one million dollars. Flows and circuits may be kept discrete, albeit with small leaks and osmoses, by “stake” size.
Though ordinary consumers dispose of billions and even trillions of dollars collectively, they do not typically make individual purchases over a “mere” million dollars except perhaps rarely in buying a house. Some of their monies are aggregated in funds like retirement funds but this aggregation already changes the game, as it were. The funds no longer make consumer purchases, at least in the short to mid term, but make aggregated asset purchases managed by the funds’ managers. The funds are out of the consumer circuit for a long time, typically a generation, like 20 0r 30 years minimum. A lot can happen in a generation. Assets can be inflated, funds embezzled, governments rise and fall, some nations default, others be destroyed and global pandemics begin. The conditions where the funds are released (if they are still existent and are released) are very different and time removed from the earlier times of consumer activity at investment time. This time gradient matters I believe but how it might matter is beyond me, I admit, except in this kind of undisciplined mental speculation.
But I think overall, we can see perhaps how the circuits or flows can be kept separate and asset inflation proceed apace while not causing consumer inflation, except perhaps of luxury goods. Billionaires don’t give a damn about the price of champagne or anything except perhaps a super yacht which will cause a mere single-billion billionaire to wince but a deca- or centi-billionaire to snap it up for the conspicuous consumption value.
- This reply was modified 4 years, 7 months ago by Rowan Pryor.
- This reply was modified 4 years, 7 months ago by Rowan Pryor.
- This reply was modified 4 years, 7 months ago by Rowan Pryor.
-
December 15, 2021 at 1:19 pm #247370
Scot Griffin, I agree. I have written, on other blogs if not here, of “my” thesis that modern capitalism has dual circuits of capital, to some considerable extent. There is the worker-consumer circuit and that part of productive business which uses productive workers and supplies consumers (while in a sense parasitising on the whole process by exploiting workers and consumers both). There is also the debt-asset circuit which functions mainly to create debt money for the purchase of assets and the concomitant process of generating asset inflation (relative to wages and the consumer items workers buy on a weekly to annual basis). The cross-over is perhaps fairly limited (though I have no data on this). The circuits are kept mainly separate and the two different sets of inflation are able to be kept apart and “differentialed”, as a verb. Q.E. (Quantitative Easing) is perfect to run this set up. It’s a brilliant scheme. The innovators of it have stolen a march, and many billions, on everyone else.
Rowan, In broad terms, your thesis is very similar to mine. Perhaps the biggest difference is I am viewing the two “circuits” as related in the sense that one (the capital economy) controls the other (the political economy) as a type of space state control system. Such control systems have an internal representation of the physical world that they use to control physical systems. Robot arms in automotive factories are a good example of manufacturing equipment that uses space state control systems.
My thesis also has a conscious political overlay that recognizes that only capitalists are “citizens” of the State of Capital and everyone else in the political economy exists to be consumed by the State of Capital, which reminds of an experience I had almost a decade ago.
Back in 2012, I met wit the CEO of the Semiconductor Industry Association (SIA). The SIA was originally formed in the 1970s by companies like Intel and AMD as an industry consortium to develop general industry guidance in terms of technology roadmaps, etc. By 2012, SIA had gone from being a primarily inward facing industry consortium to being a primarily outward facing lobbying organization for the semiconductor industry, a way for even small companies to have their voices heard in Washington. The CEO was fairly new to the job. His prior gig was working for PhRMA, the industry consortium/lobbying arm of the pharmaceutical industry, where he was among the lobbyists who wrote what became known as Obamacare. He had many war stories about that time, but there is one thing he said that has always stood out to me:
“In Washington D.C., if you are not at the table, you are on the menu.”
And then he chuckled, as if he believed he had just said something funny.
-
December 15, 2021 at 4:41 pm #247372
Scot Griffin,
You say “only capitalists are “citizens” of the State of Capital and everyone else in the political economy exists to be consumed by the State of Capital.” Precisely. That is what we are trending towards. Indeed, we are just about there. I only wish I had formulated it so well myself. I think you also previously wrote that the entire (Western neoliberal capitalist) political economy is now a “company town”. Our society is now their company town. Again, an extremely apt analogy. Of course, Mumford’s “megamachine” is also an apt analogy. It draws everything into itself in a totalising and hierarchical control system fashion. Nietzsche criticised (the old?) philosophy (including I guess social philosophy) as follows;
“What therefore is truth? A mobile army of metaphors, metonymies, anthropomorphisms: in short a sum of human relations which became poetically and rhetorically intensified, metamorphosed, adorned, and after long usage seem to (become) a notion fixed, canonic, and binding; truths are illusions of which one has forgotten that they are illusions; worn-out metaphors which have become powerless to affect the senses; coins which have their obverse effaced and now are no longer of account as coins but merely as metal.”
We might appear to be falling afoul of Nietzsche’s criticism, employing “megamachines” and “company towns” as metaphors, analogies, metonyms. I think the difference is in whether the analogy is apt, radical and critical and points to the deeper truth as opposed to the received canonic “truths” or rather the illusions that the system promotes about itself. Company towns historically were and are today where they still exist are a sub-unit of the modern, capitalist mega-machine, thus partaking of the general “autocatalytical sprawl” nature of the entire megamachine where every module bears a “mandelbrot” or fractal relation to the whole: repeating the whole in minutiae and adding to the extension of the whole maintining the same structural manner of extension by sprawl of modules. Ulf Martin and Jonathan Nitzan can express these autocatalytical sprawl concepts better than I.
Capitalism has “sacrifice zones” and “sacrifice populations”. This is not to say it is the first empire to do this but it is doing in a more totalising fashion, engulfing the entire globe, including its domestic populations (who now are also colonised in a sense) and in a manner in which the pseudo-rational and the virtual parasitise on the real and in the process destroy it.
“A sacrifice zone or sacrifice area (often termed a national sacrifice zone or national sacrifice area) is a geographic area that has been permanently impaired by heavy environmental alterations or economic disinvestment, often through locally unwanted land use (LULU). These zones most commonly exist in low-income and minority communities.[1] Commentators including Chris Hedges, Joe Sacco, and Stephen Lerner have argued that corporate business practices contribute to producing sacrifice zones.” – Wikipedia.
Late stage capitalism is now re-introducing the consumption of sacrifice populations into its domestic population. Workers were consumed in early industrial capitalism (at home and abroad) but the bourgeoise, petty bourgeoise and even the “aristocracy of labor” (skilled labor which could be accommodated with good wages because of colonial exploitation) had been exempt. That exemption has now been effectively rescinded except for the very rich. The rest of the population (or the weaker segments thereof) are to be consumed by unleashing (accidently or sort of accidently on purpose) a consuming, continually mutating pandemic. The wedge used is the hagiographical depiction of the petty bourgeoise. People who own such “essential” businesses as coffee shops, pubs, clubs, restaurants and bars must be permitted to trade no matter what and spread dangerous new variants of the pandemic into the population. The baby boomer generation set up this system or voted continually for those who did. Now that ageing generation is to be consumed by the system they enabled. It is very ironic. Of course, things are worse in the third world.
The refusal to eradicate the virus and to promote what has turned into leaky vaccine endless pandemic indicated and indicates the refusal to;
(a) Suspend the circuits of capital which suit the plutocrats no matter what else is happening;
(b) consider anything but immediate profits;
(c) consider the human, social and medical concerns of the vulnerable population (which is very large).
The neoliberal system is sacrificing everything now, climate, environment, other earth systems and the entire non-rich and the not perfectly immune-able population of the globe. To those who felt society was about community and cooperation the spectacle is bizarre.
-
December 16, 2021 at 8:31 pm #247384
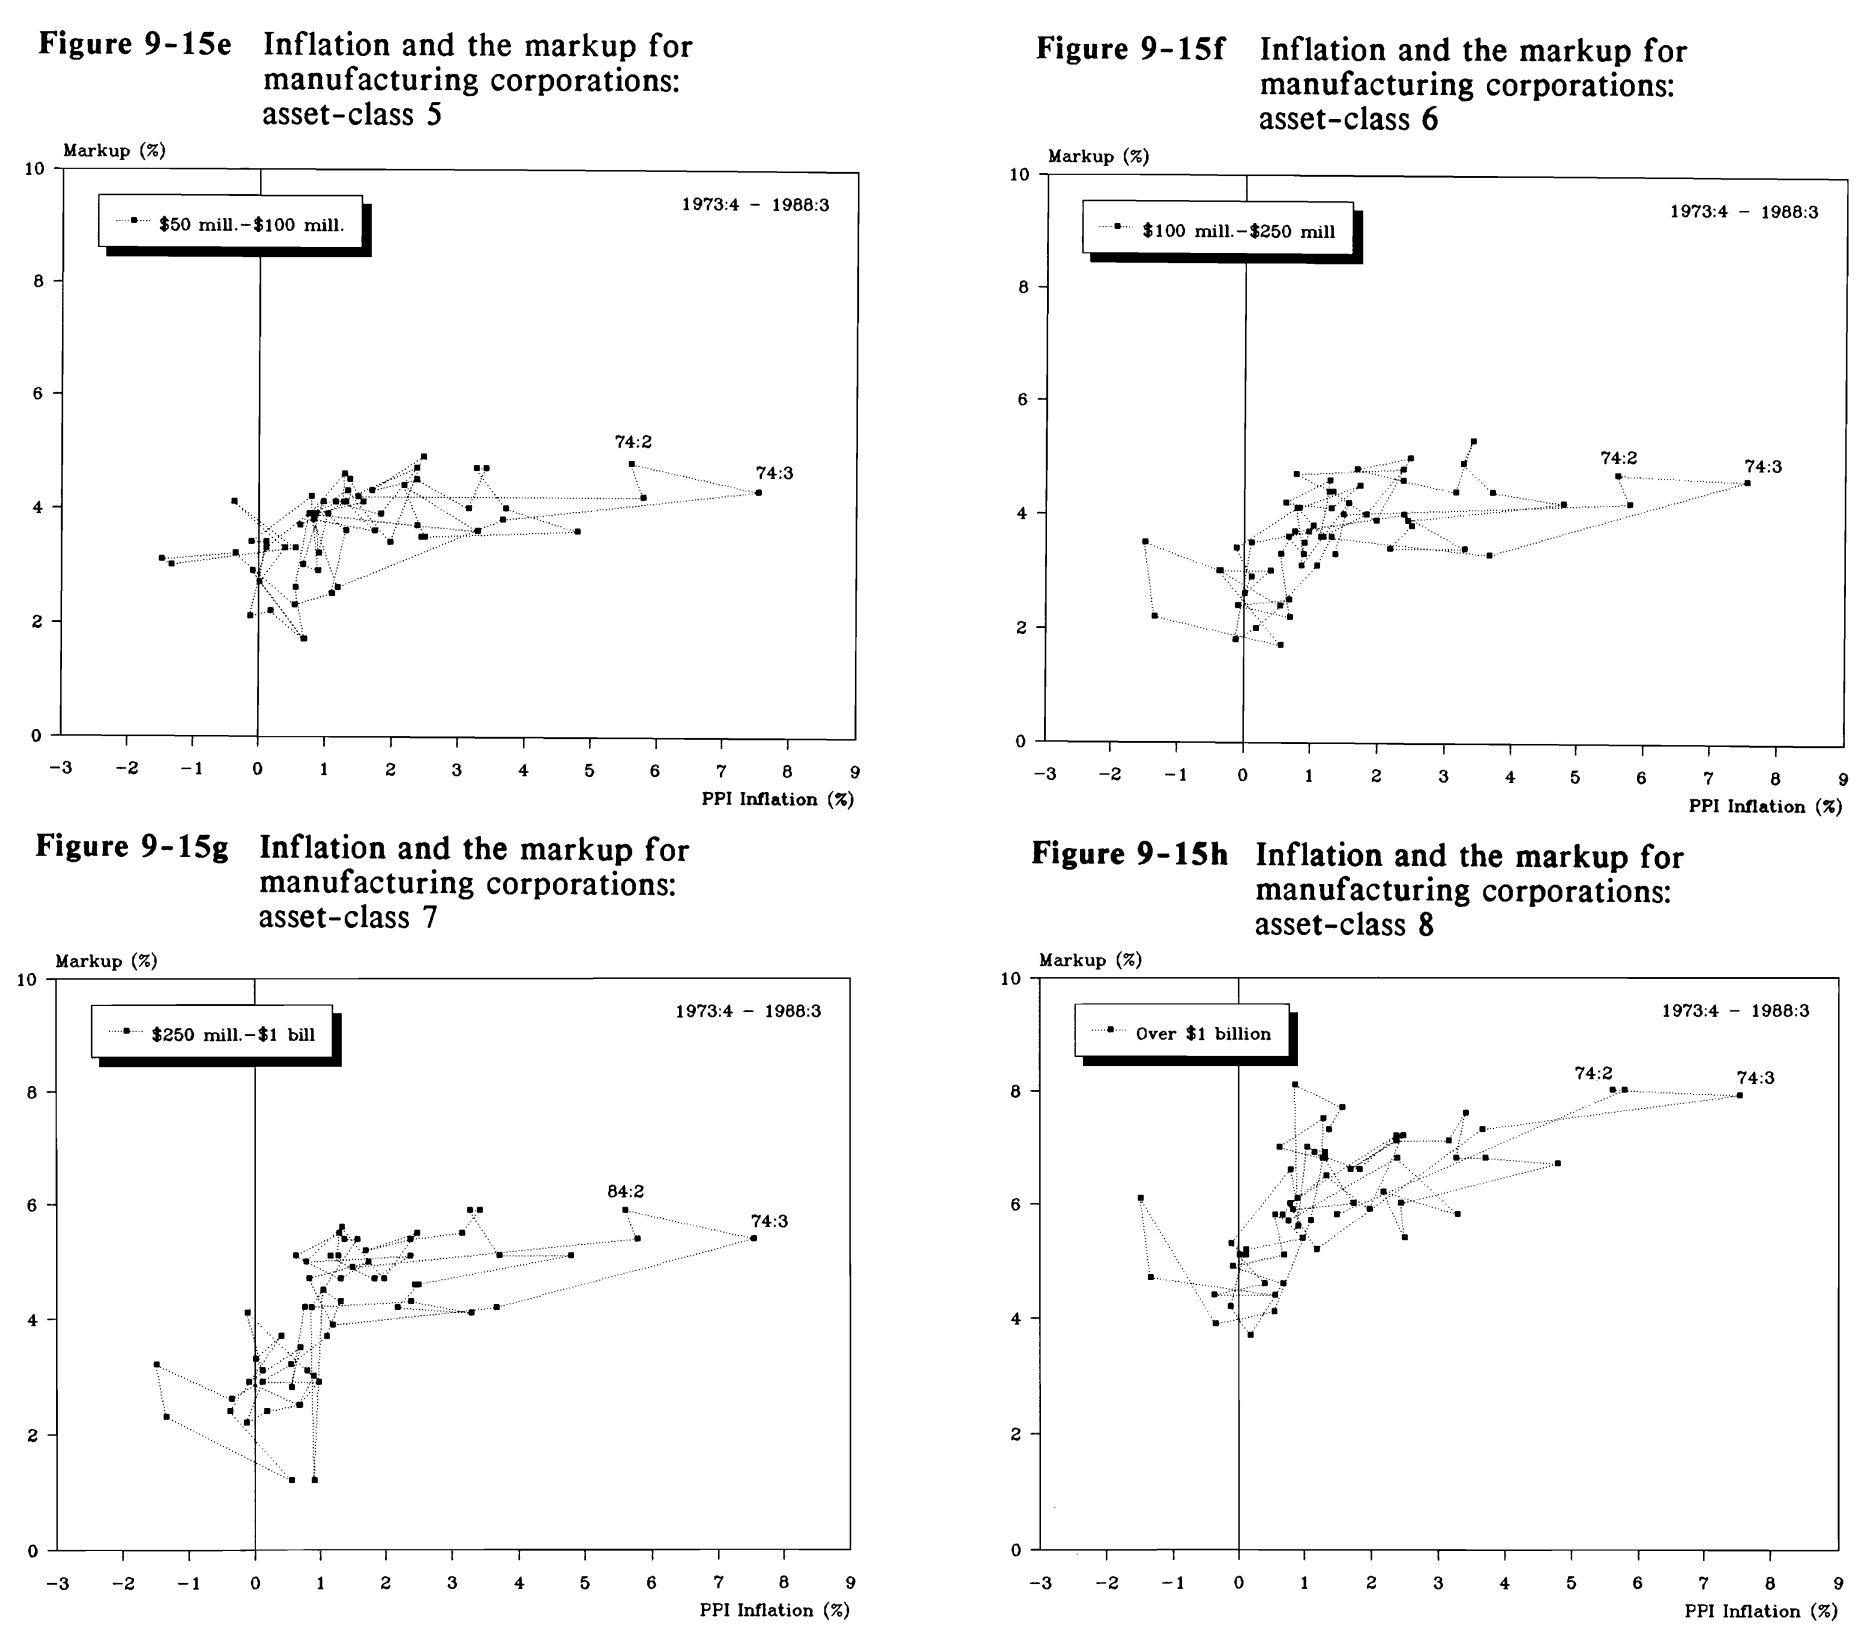
Here is another update in the ‘inflation-is-always-a-redistributional-phenomenon’ series.
The chart below shows two series. The dotted series is the wholesale price inflation. The solid series is the ratio between earnings per share of the S&P500 companies and the average hourly earnings in the U.S. private sector, measured as a % deviation from its past five years (meaning that, if in a particular year the value of this indicator is +40%, it means that the ratio between earnings per share and the wage rate is now 40% higher than its average over the past five years) .
The figure shows that, since the 1950s, inflation redistributed income from workers to capitalists. When inflation increased, capitalists gained relative to workers, and when it decreased, they lost relative to workers.
The chart also indicates that this positive correlation grew stronger in the second half of the period: until 1985, the correlation was +0.35, whereas from 1985 onward, with the exception of the financial crisis years of 2008-9, it almost doubled to +0.64.
Inflation isn’t neutral.
-
December 27, 2021 at 8:12 pm #247441
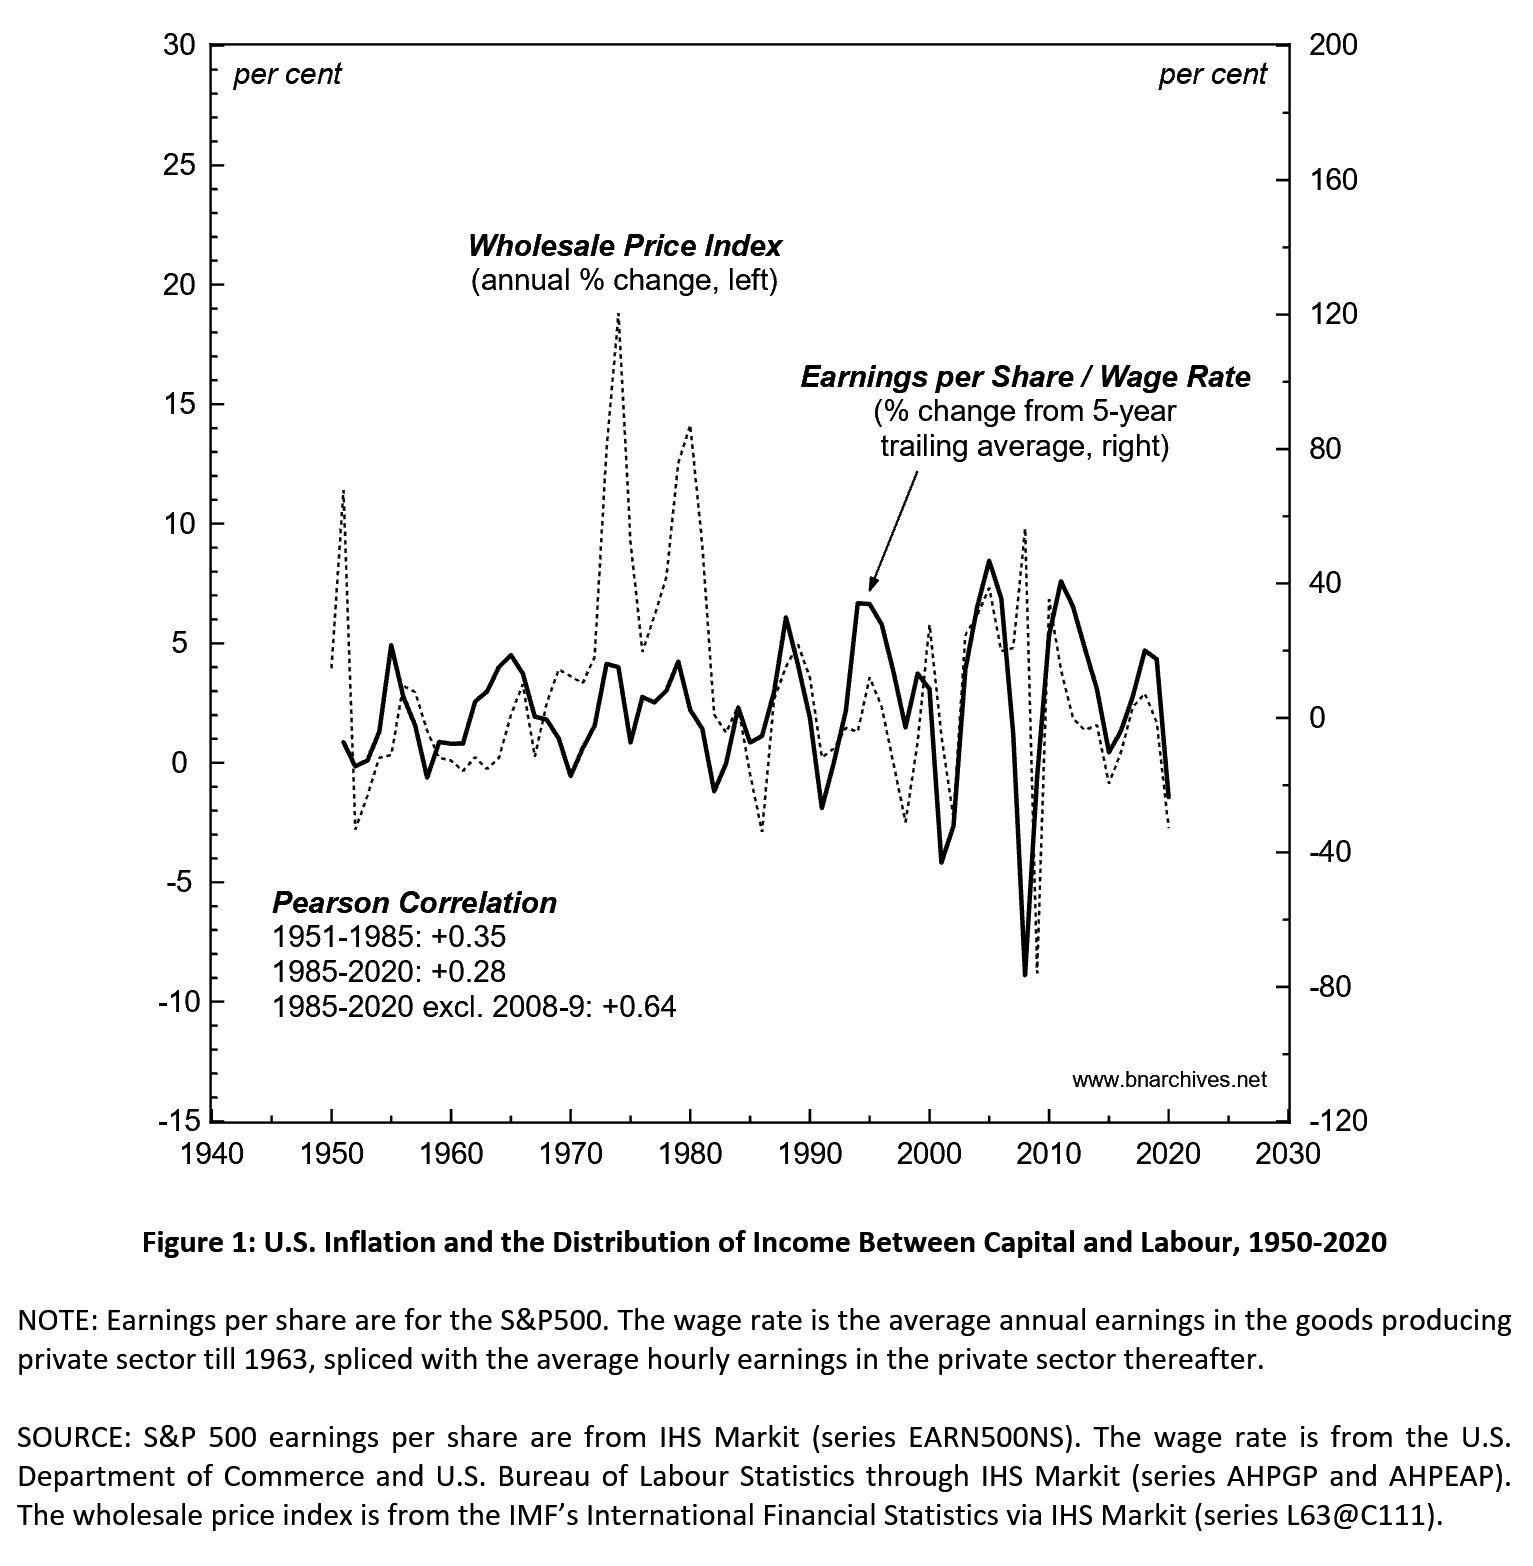
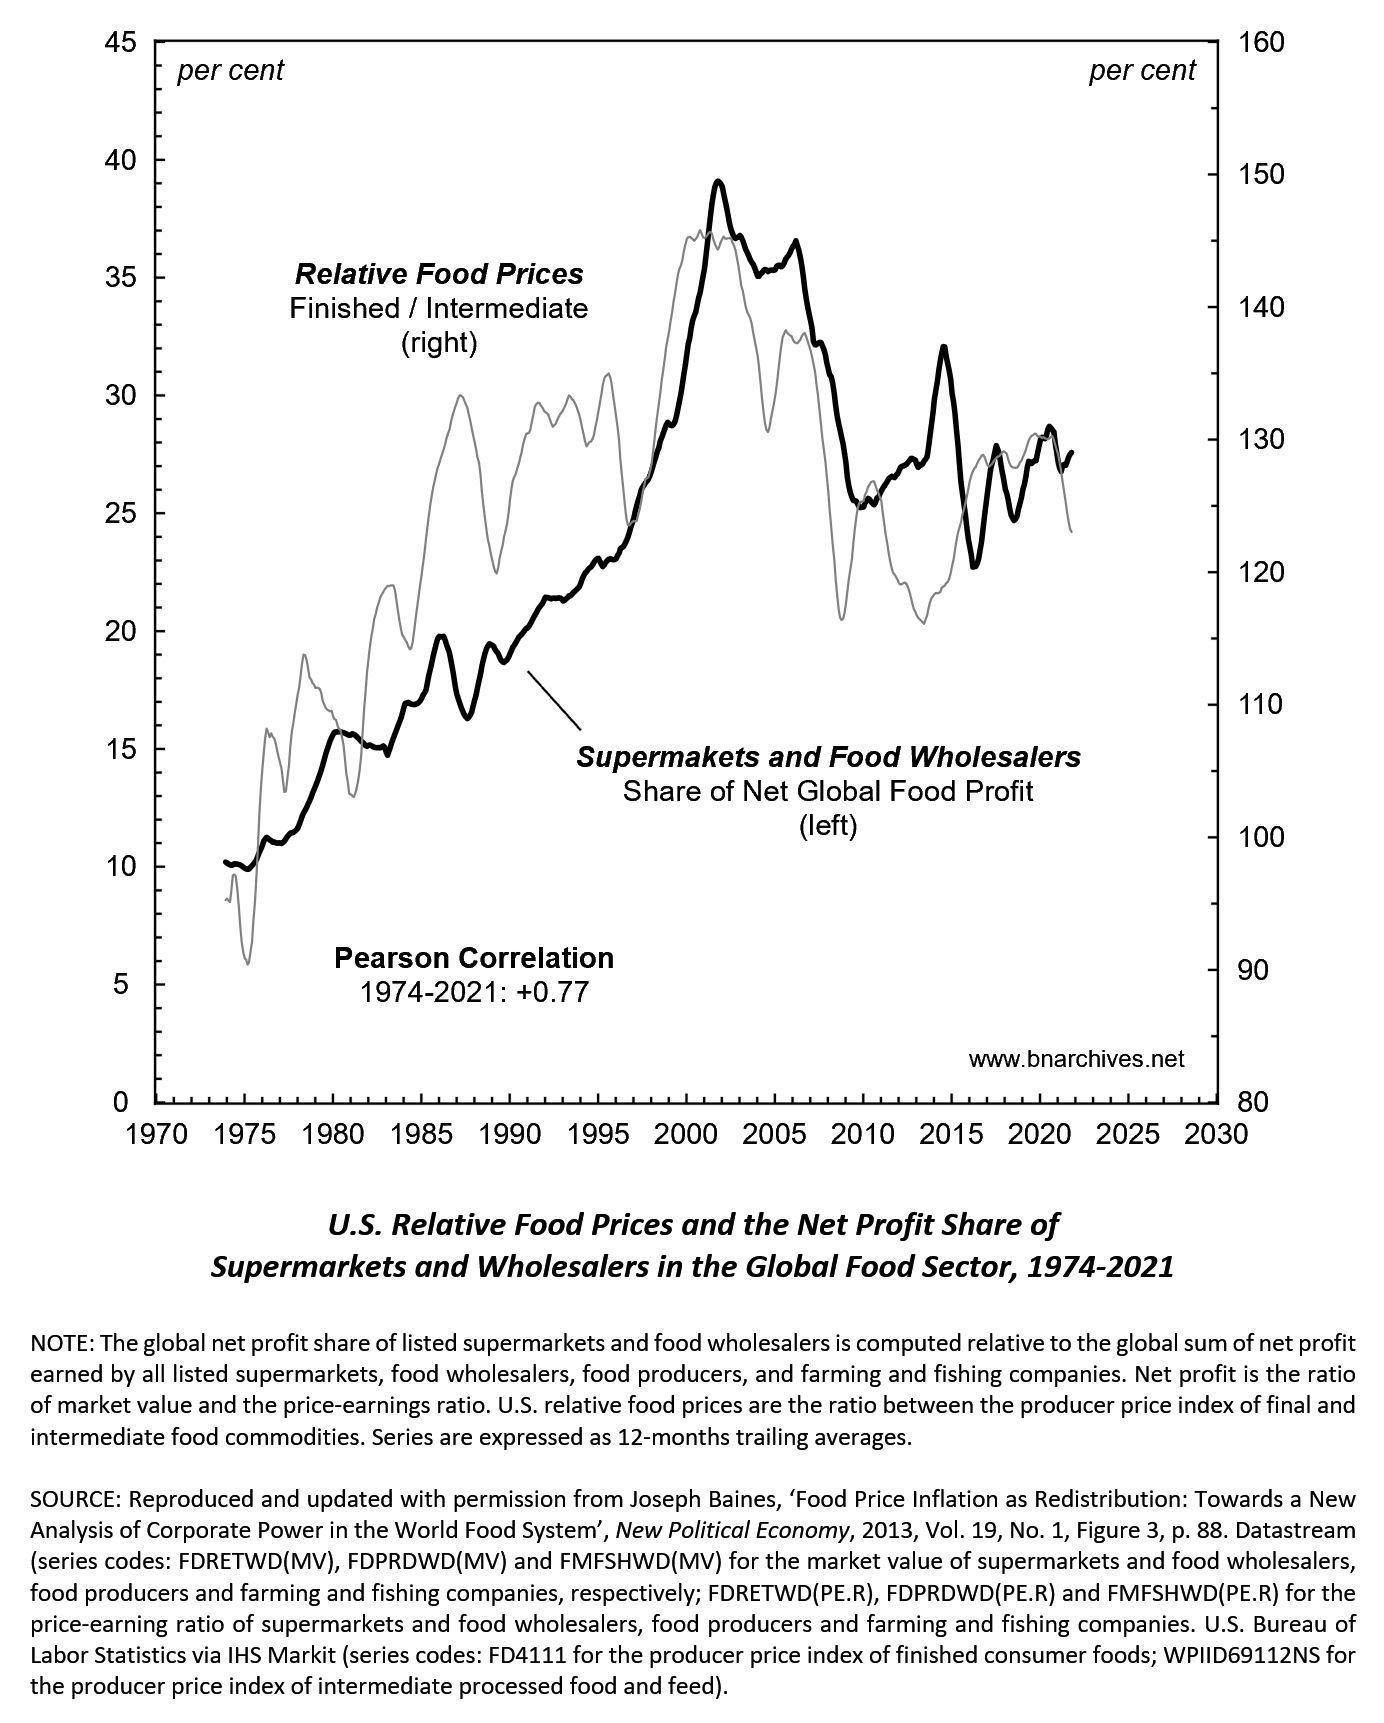
This figure is from Joseph Baines’ 2013 New Political Economy paper ‘Food Price Inflation as Redistribution: Towards a New Analysis of Corporate Power in the World Food System’, p. 88.
The chart shows how differential inflation, shown here by changes in the price ratio between finished consumer foods and intermediate goods, altered the profit share of supermarkets and wholesalers in the global food sector.
Inflation redistributes income, practically always, and often systematically.
-
January 6, 2022 at 5:17 pm #247475
Here is Joseph Baines’ 2013 figure updated till 2021, showing how differential inflation continues to redistribute profit well into the present.
Inflation is always and everywhere a process of redistribution.
- This reply was modified 4 years, 6 months ago by Jonathan Nitzan.
-
-
December 29, 2021 at 4:34 pm #247445
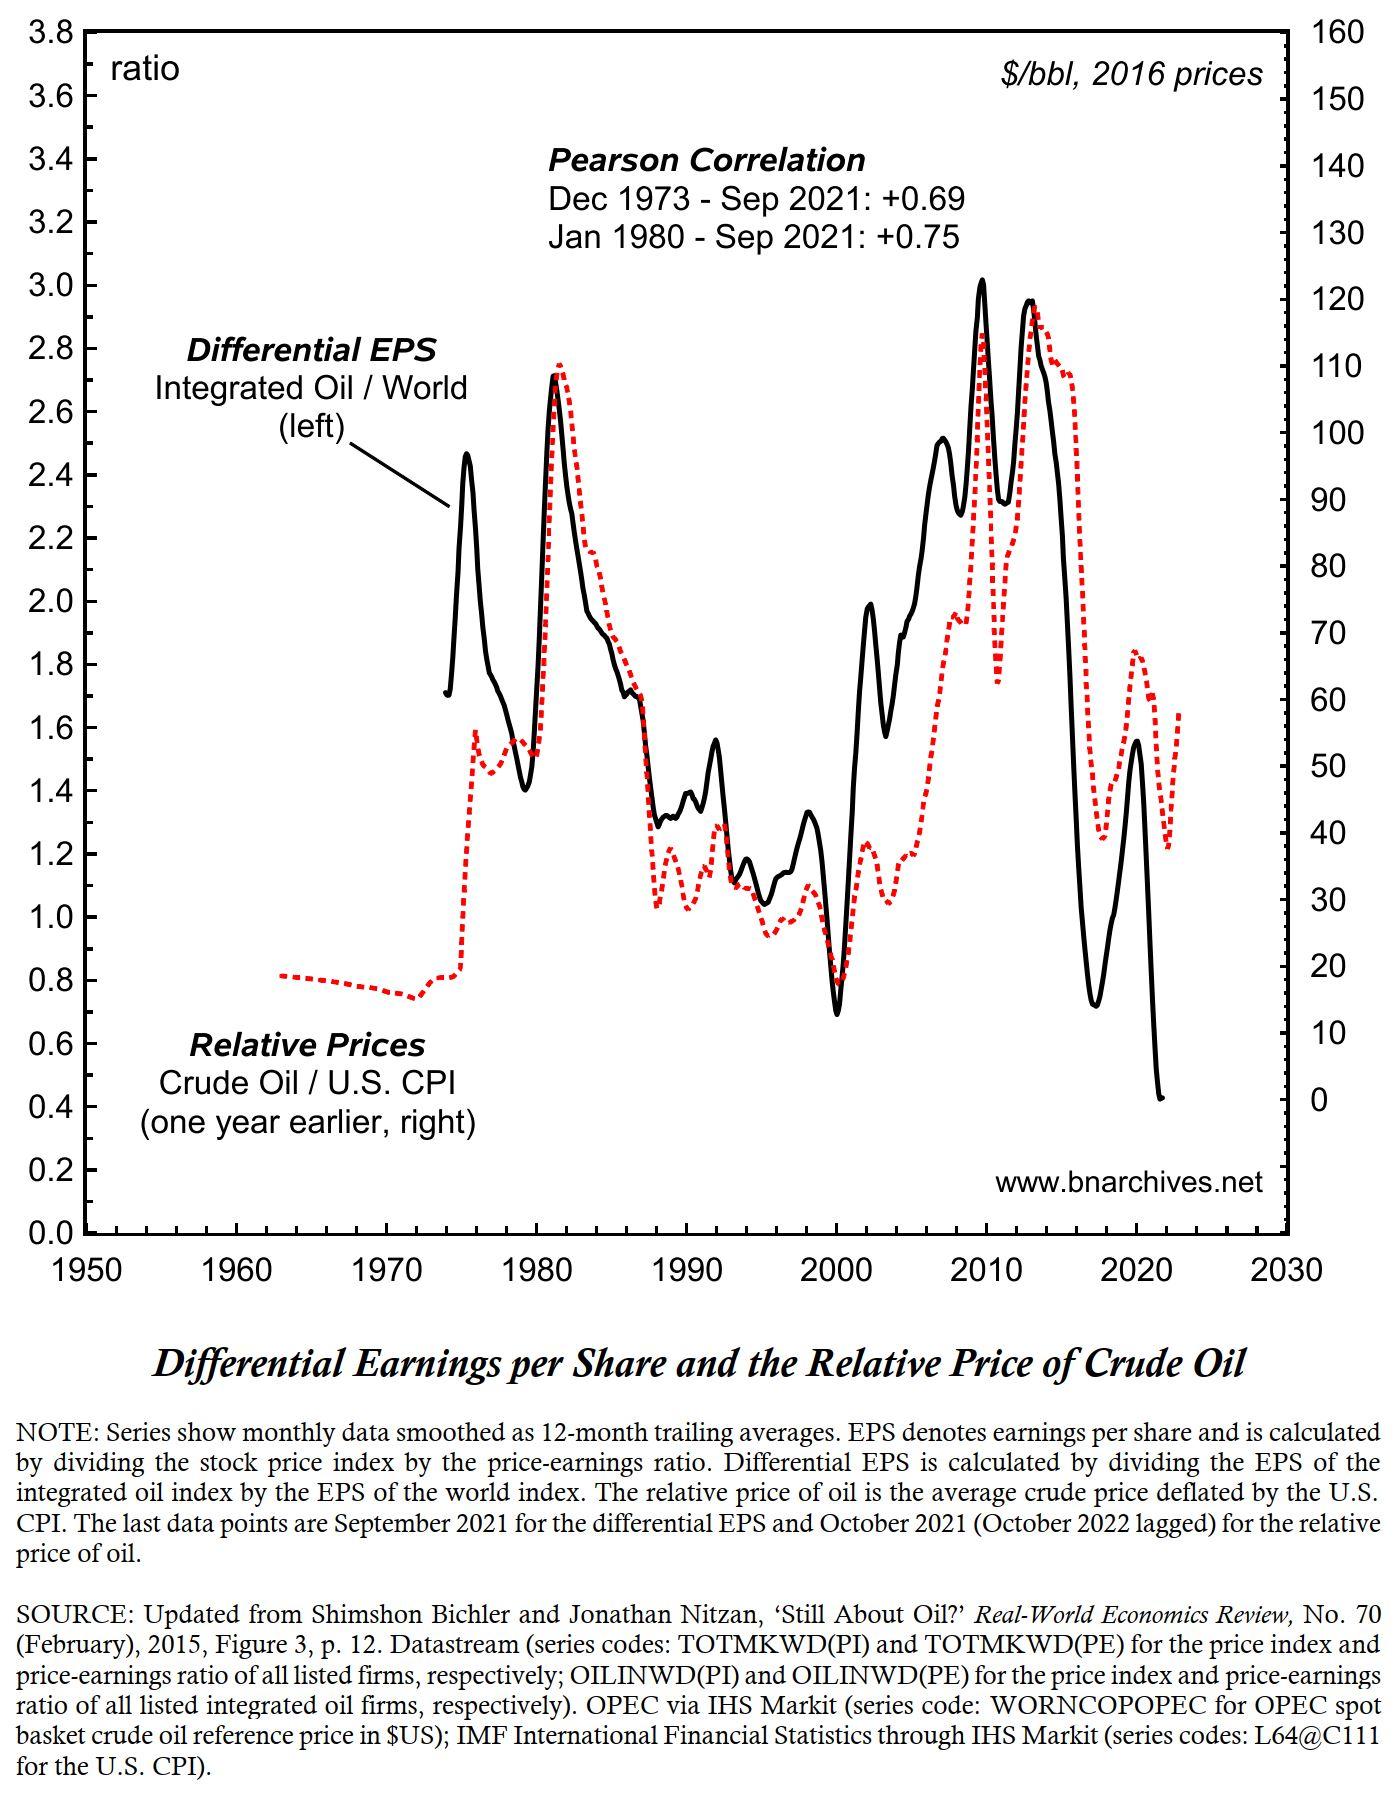
Relative oil prices and differential oil profits
By Shimshon Bichler & Jonathan Nitzan
***
If you thought that oil profits are about producing oil, think again.
The enclosed chart, updated from our 2015 Real-World Economics Review paper, ‘Still About Oil?’, shows that the main determinant of oil profit — and specifically of differential oil profit — is not output, but prices.
The figure shows the correlation between two series: (1) the differential oil profits of the world’s integrated oil companies, computed as the ratio between their earnings per share and the earnings per share of all listed firms; and (2) the relative price of oil one year earlier, measured by the $ price of crude oil relative to the U.S. consumer price index. (The reason for the annual lag is that ‘current’ profits represent a trailing average of earnings recorded over the past 12 months.)
When we wrote the article in 2015, differential oil profits and the relative price of oil were both at record highs; nowadays, they brush against record lows. And that pattern is to be expected. As the chart shows, the correlation between these two measures remains positive and tight, with a Pearson coefficient of +0.69 for the entire period since Dec 1973, and +0.75 since January 1980.
Inflation is always and everywhere a re-distributional phenomenon.
(And expect differential oil profits to rise next year.)
- This reply was modified 4 years, 6 months ago by Jonathan Nitzan.
- This reply was modified 4 years, 6 months ago by Jonathan Nitzan.
-
January 4, 2022 at 11:34 am #247474
For those interested in reading more on the subject, here is a list of some of our CasP analyses of oil:
- The Political Economy of Armament and Oil – A Series of Four Articles (1989) https://bnarchives.yorku.ca/136/
- Bringing Capital Accumulation Back In: The Weapondollar-Petrodollar Coalition – Military Contractors, Oil Companies and Middle-East “Energy Conflicts” (1995) https://bnarchives.yorku.ca/13/
- Putting the State In Its Place: US Foreign Policy and Differential Accumulation in Middle-East “Energy Conflicts” (1996) https://bnarchives.yorku.ca/11/
- The Global Political Economy of Israel (2002) https://bnarchives.yorku.ca/8/
- It’s All About Oil (2003) https://bnarchives.yorku.ca/38/
- Dominant Capital and the New Wars (2004) https://bnarchives.yorku.ca/1/
- New Imperialism or New Capitalism? (2006) https://bnarchives.yorku.ca/203/
- Still About Oil? (2015) https://bnarchives.yorku.ca/432/
- Profit Warning: There Will Be Blood (2017) https://bnarchives.yorku.ca/432/
- Still in the Danger Zone (2020) https://bnarchives.yorku.ca/634
-
June 25, 2022 at 7:34 am #248114
The May 2022 data for the United States, shown in the figure below, suggest that the current bout of inflation may be peaking. The chart contrasts the annual rate of change for consumer prices (left) with that of producer prices (right), and both series indicate that the process may be approaching its upper limits.
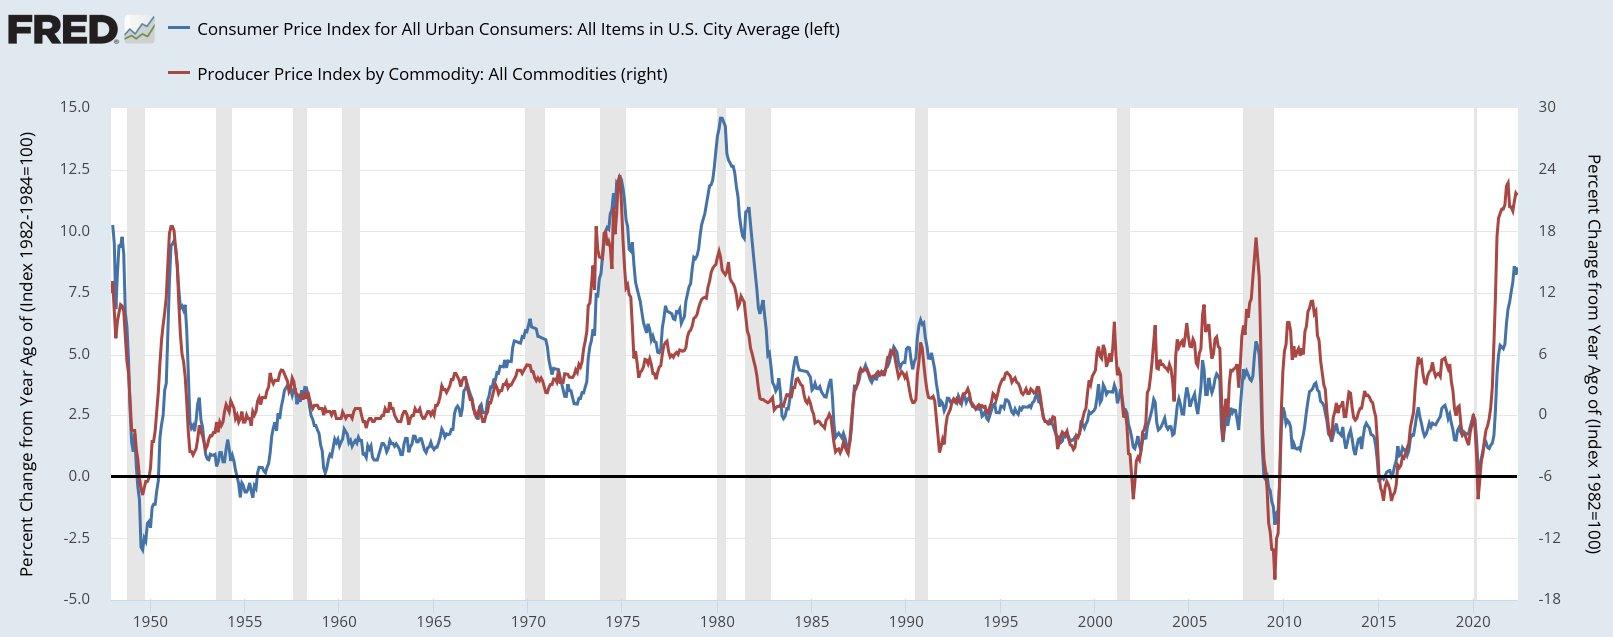
The reason for these limits has to do with the re-distributional essence of inflation.
Inflation is an average of individual price changes, and this average hides the most important driver of inflation: the fact that individual prices change and different rates, and that these differences redistribute income and assets.
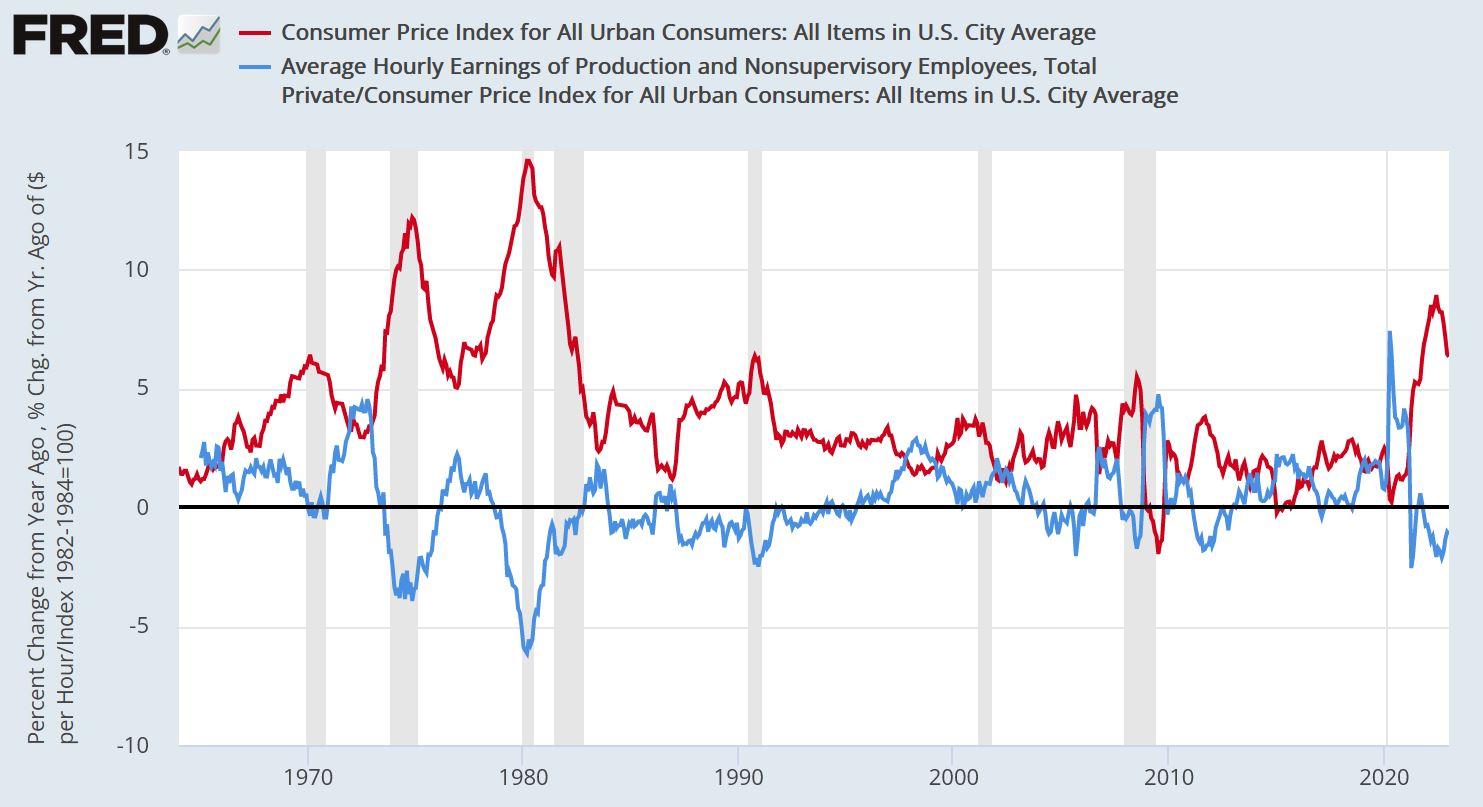
The next chart contrasts the annual CPI inflation in the United States (red) with the annual rate of change of the purchasing power of wages (blue) — or what economists call the “real wage.” Note how the two series are inversely correlated: when CPI inflation accelerates, the rate of change of “real wages” decelerates, and vice versa.

This negative correlation suggests three things.
1. U.S. wage earners tend to lose from inflation — when inflation rises, U.S. wage increases tend to lag (and, inversely, rise faster when inflation slows). And since, on the upswing, wages rise more slowly than prices, the purchasing power of wage earners suffers.
2. Wage increases do not cause inflation — unless you insist on blaming workers for using wage increases to give capitalists the excuse to raise prices even faster.
3. Redistribution tends to limit the inflationary process — as inflation redistributes income from workers to capitalists, it undermines workers’ income-read-consumption, causing the the profitability of price-setters to gradually wane. Eventually, capitalists lose their price-hike resolve, their tacit coordination fractures, and inflation decelerates.
-
March 4, 2023 at 5:14 am #248922
3. Redistribution tends to limit the inflationary process — as inflation redistributes income from workers to capitalists, it undermines workers’ income-read-consumption, causing the the profitability of price-setters to gradually wane. Eventually, capitalists lose their price-hike resolve, their tacit coordination fractures, and inflation decelerates.
Here is an update, with data extended till January 2023: as the purchasing power of workers declined, inflation eventually inverted.
-
April 11, 2026 at 6:44 pm #250581
Back in June 2022 we suggested — and in retrospect, correctly — that because inflation redistributes earnings away from workers, the post-Covid bout of inflation would be self limiting.
Now it seems that the same thing is likely to happen if the ongoing Middle East energy conflict (U.S. & Israel contra Iran) were to rekindle another overall surge in prices.
U.S. workers are in no position to retort meaningfully to such a price surge, which means that there will be little or no price-wage spiral and therefore no protracted rise in inflation. Instead, the short general bout of price increases will redistribute income from workers to capitalists, and then the rate of inflation will subside.
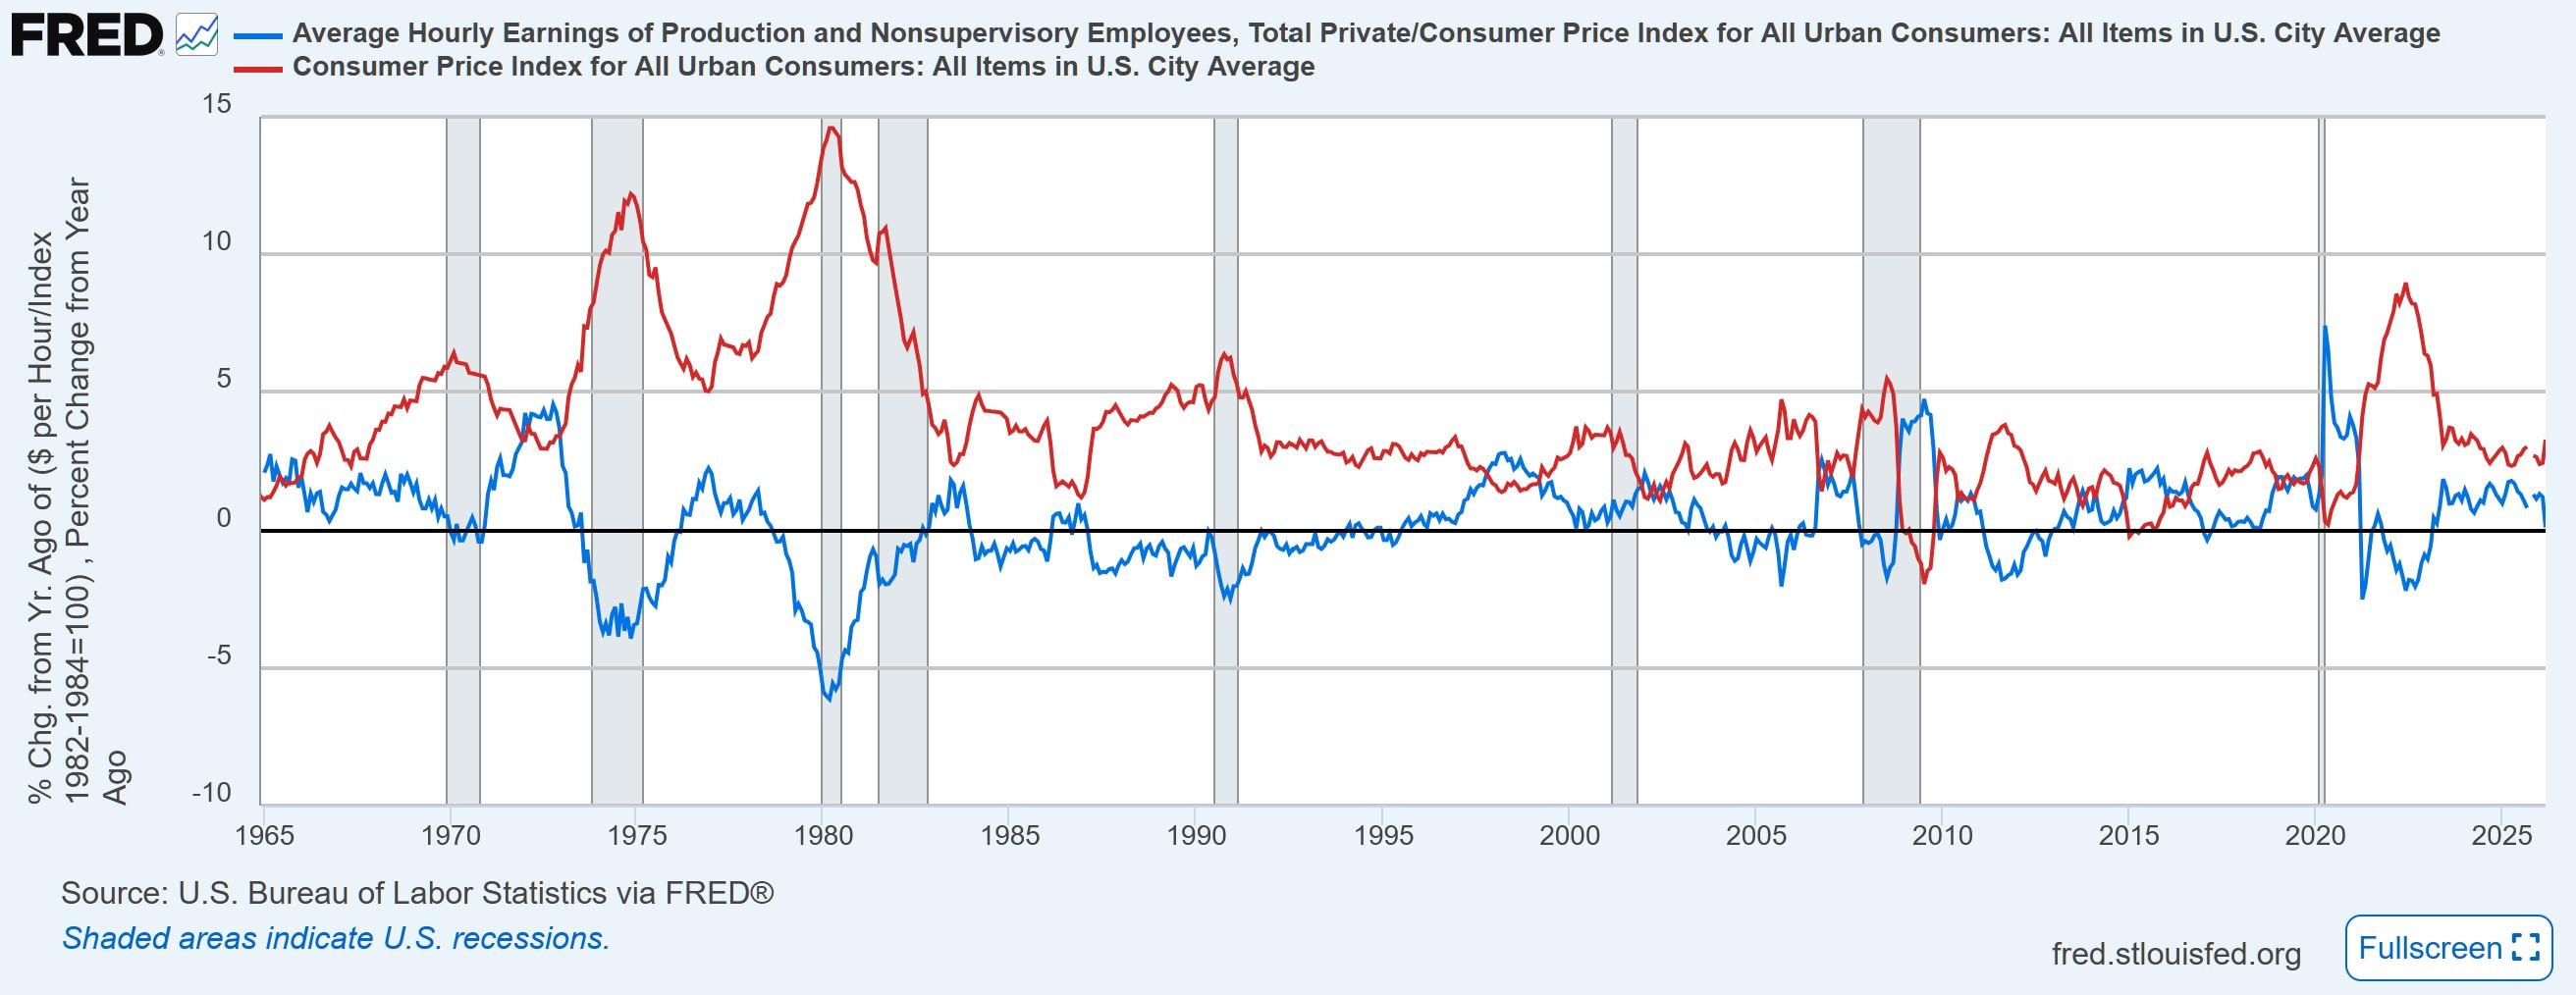
Custom graph link: https://fred.stlouisfed.org/graph/?g=1UEp0
- This reply was modified 3 months, 1 week ago by Jonathan Nitzan.
-
-
-
September 30, 2022 at 6:06 pm #248364

After decelerating for forty years, inflation is finally back, along with horror stories about capitalists who “use it” in order jack up their prices.
A recent paper in the Intercept bedevils a talkative executive who Has Been “Praying for Inflation” Because It’s an Excuse to Jack Up Prices. (Hat: https://twitter.com/HeavenlyPossum.)
Iron Mountain’s CEO, William Meaney, tells participants in an earnings call that “it’s kind of like a rain dance, I pray for inflation every day I come to work because … our top line is really driven by inflation. … Every point of inflation expands our margins.” And his CFO, one Barry A. Hytinen, can’t agree more: “we do have very strong pricing power” and for the company, inflation is “actually a net positive.”
And its not merely about raising prices. It is about raising them faster than others.
As Meaney explains, “where we’ve had inflation running at fairly rapid rates … we’re able to price ahead of inflation” — that is, increase its prices at a greater rate than the high recent rates of inflation. Raising prices, he says, “obviously covers our increased costs, but … a lot of that flows down to the bottom line.”
Everyone tries to beat the average: “People are seeing what FedEx, UPS, and others are having to do to actually manage their business and pass on that inflation.”
There is also a downside worth mentioning — namely, the differential loses of all those doomed subjects who forever trail the average. But this is just an unfortunate externality: “I wish I didn’t do such a good dance,” boasts Meaney, “but that’s more on a personal basis than on a business model.” According to Hytinen, “we feel for folks [but] we have a high gross margin business, so it naturally expands the margins of the business.”
***
Naturally, neither the executives nor the reporters consider the possibility that differential price increases and the differential profits that come with them are not the consequences of inflation, but its prime causes.
- This reply was modified 3 years, 9 months ago by Jonathan Nitzan.
- This reply was modified 3 years, 9 months ago by Jonathan Nitzan.
- This reply was modified 3 years, 9 months ago by Jonathan Nitzan.
-
-
AuthorReplies
- You must be logged in to reply to this topic.