Originally published at Economics from the Top Down Blair Fix Last week I ran a Twitter survey to see what software my fellow researchers use. It turns out they like R: As an avid R user myself, this result didn’t surprise me. But it did make me think about my own approach to coding. In […]
Continue Reading10 Tips for Making Beautiful Charts
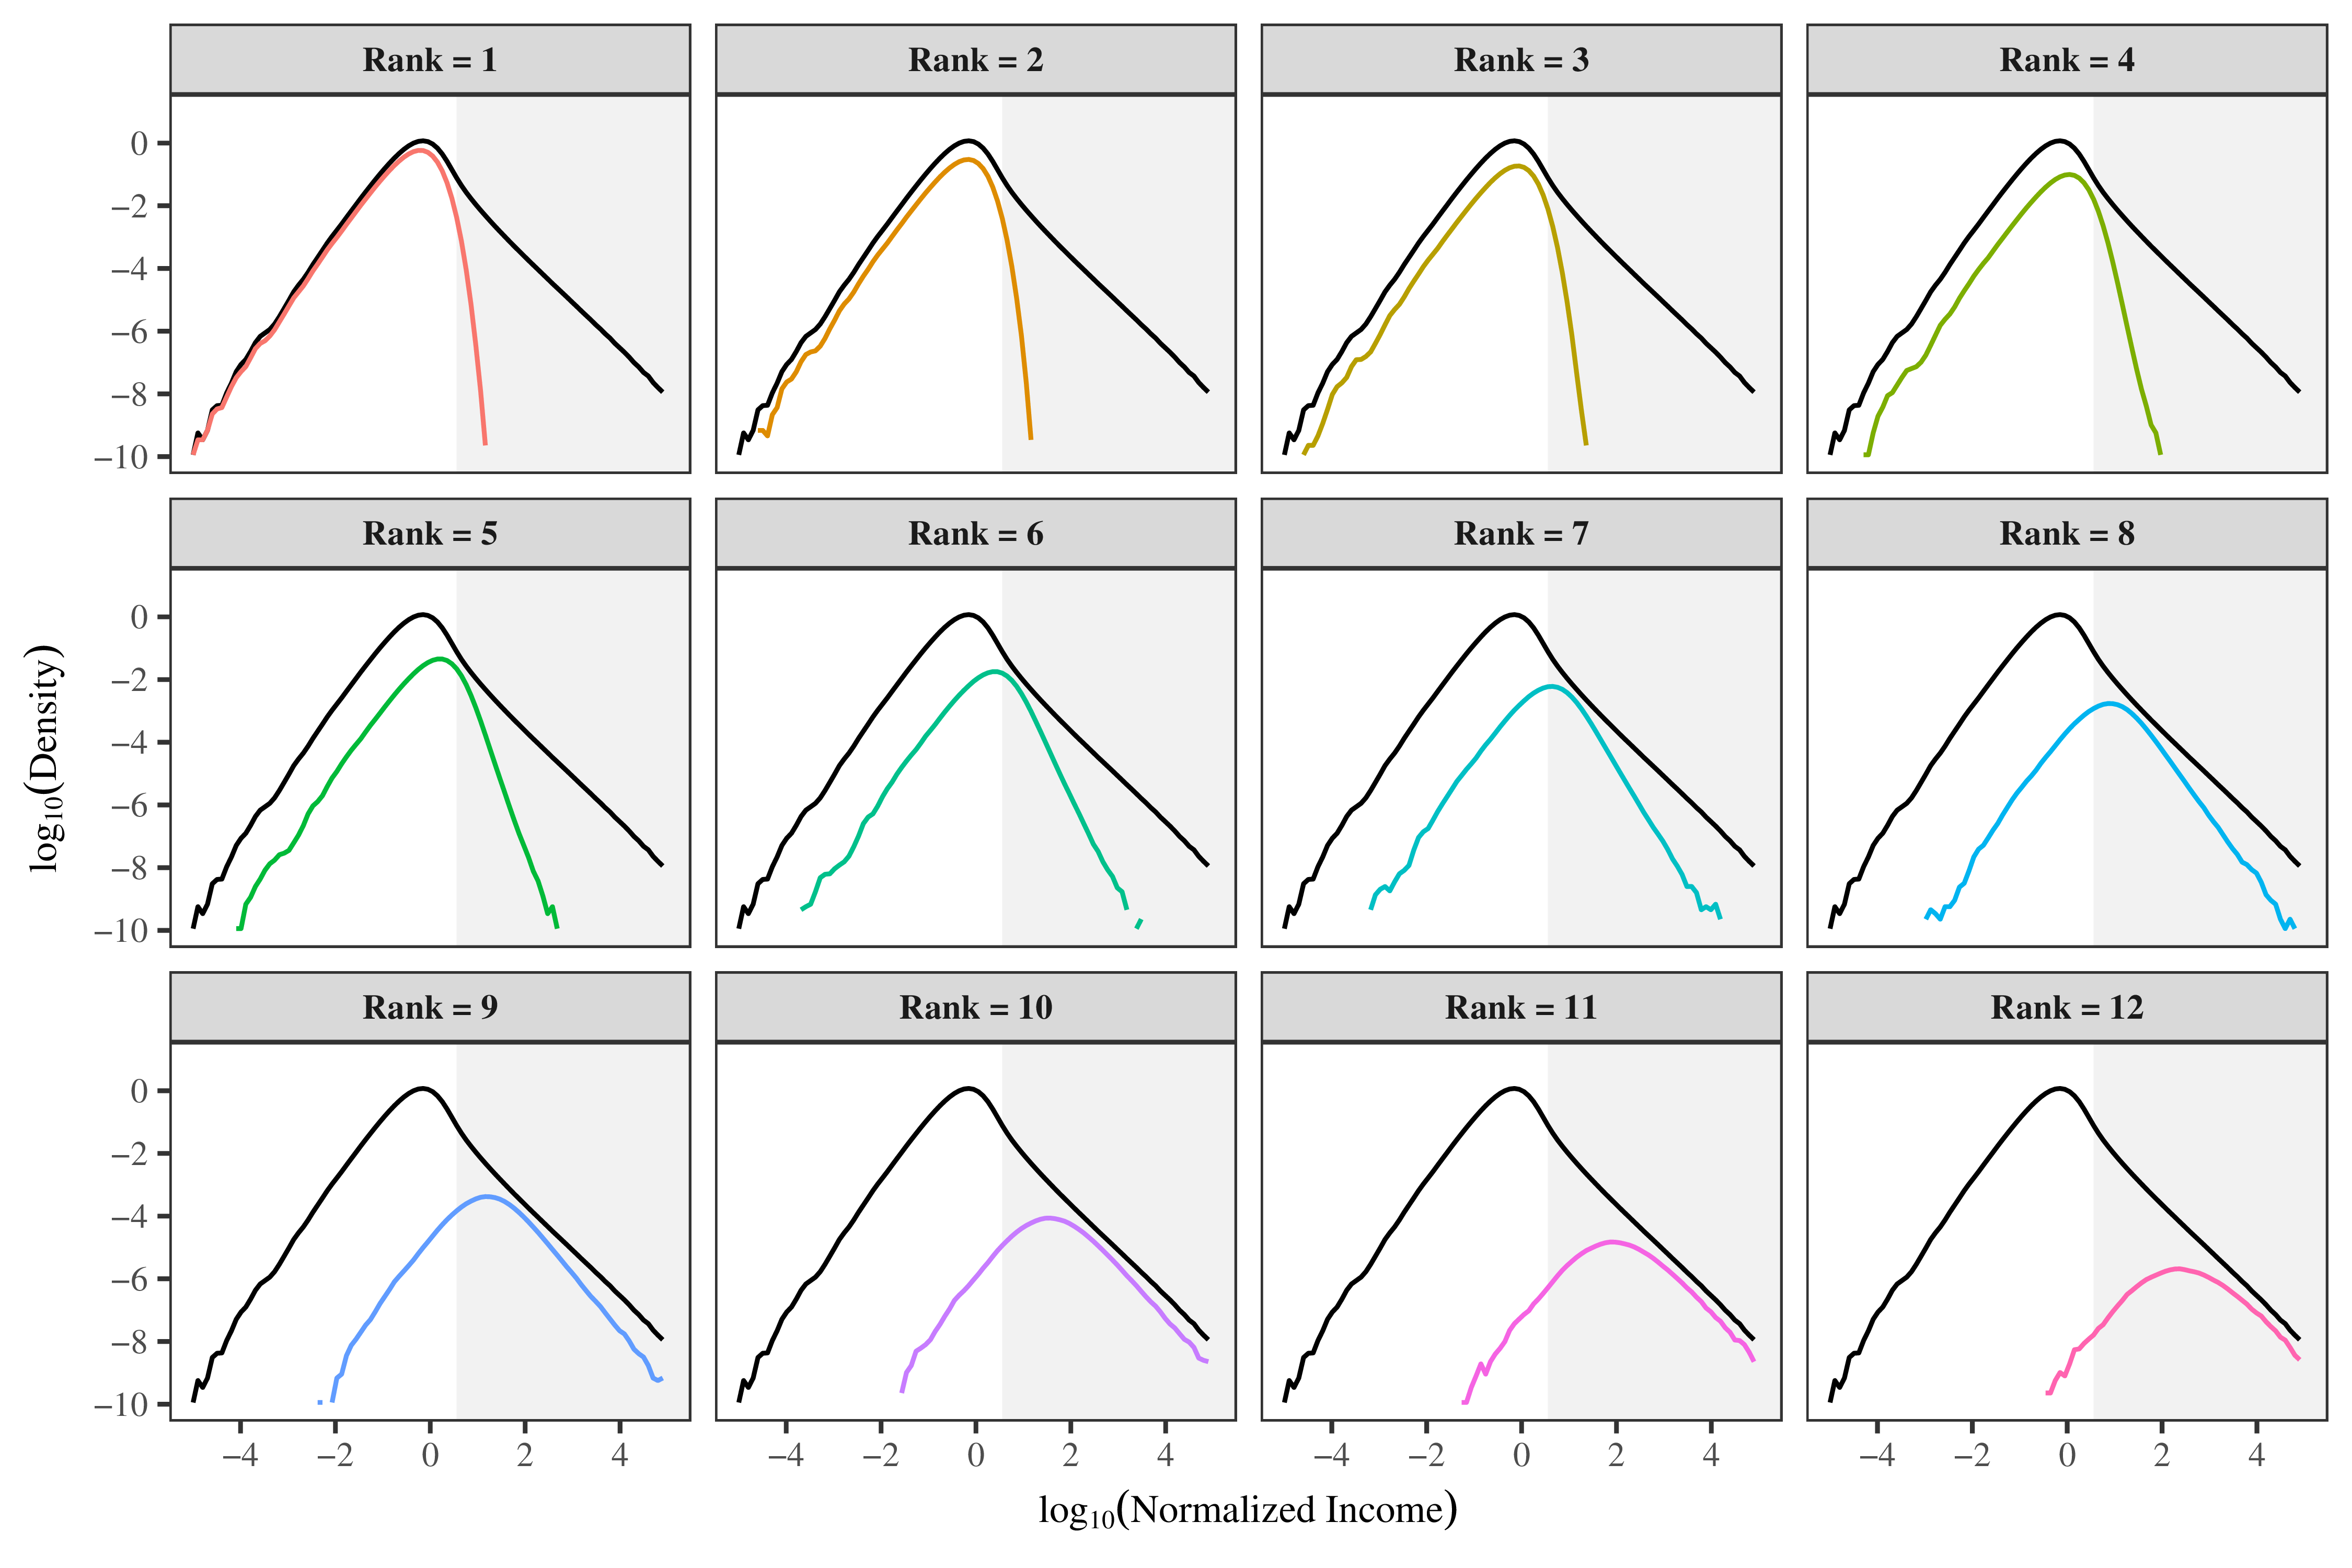
Originally published on Economics from the Top Down Blair Fix They say that a picture is worth a thousand words. In science, the corollary is that a good chart is worth a whole article. Okay, that’s probably an exaggeration … but only slightly. Millions of words are spilled each day communicating science. Yet people have […]
Continue Reading

