Remaking Our Economies with Wartime Analogies, Part 2
July 23, 2021
Originally published at dtcochrane.com
DT Cochrane
In Part 1, I explained the motivation for this series.
I want to use the analogy of WWII, as invoked by economists JW Mason and Mike Konczal in an NYT op-ed, to consider how we ought to manage a potential post-pandemic economic boom. In this post, I will look at the qualitative transformations that took place in U.S. household consumption during WWII. These transformations occurred, in part, because of government control of material resources.
While the aggregate level of household consumption only fell for a single year—1942—the mix of goods and services shifted dramatically, and some categories of consumption dropped for several years. The best known example are private automobiles. The productive capacity, and material inputs, of the automaking industry were turned over to wartime production and the sale of new automobiles dropped to just over one percent its 1941 high-water mark.
At this point, it is worth noting that when WWII began, U.S. consumption had not yet recovered from the Great Depression. Nominal sales of new automobiles in 1941 were barely half a percent higher than they had been in 1929. In 1940, nominal consumption was still almost 10 percent lower than 1929, while the population was almost nine percent higher.
It is widely recognized that although the New Deal helped to support people suffering through the Great Depression, it was insufficient for kickstarting the U.S. economy. It took WWII to get production back on track. That is an important lesson for those of us that advocate a Green New Deal.
What we actually need is a Green WWII, although perhaps a wartime metaphor is not ideal for the collective, cooperative global effort required. For more on the WWII analogy for achieving a just transition, see Seth Klein’s book A Good War, which describes how Canada’s economy was reshaped for the war effort. Klein argues that a just transition requires a similar scope and scale of transformation.
The chart below shows the change in U.S. household consumption of goods and services from 1941 to 1944.

Goods and services are the two broadest categories of consumption in the U.S. national accounts. While the purchase of services increased by 20 percent, goods purchased fell by 8 percent.
Goods are further disaggregated into 1) durable, and 2) non-durable. Services are disaggregated into 1) household expenditures on services, and 2) expenditures on services of non-profits serving households. Each of the categories, except the last, have at least two more levels of disaggregation.
The fall in goods consumption was entirely a fall in the purchase of durable goods, as seen in the next figure.

In aggregate, the purchase of non-durable goods increased modestly, while certain sub-categories fell. The purchase of durable goods fell every single year from 1941 to 1944. It had fully recovered by 1946.
Durable Goods
As already noted, a large portion of the decline in durable goods was automobiles, which were about one-quarter of all durable goods purchased in 1941. Household appliance purchases fell by 89 percent. Two other categories that saw declines of more than 50 percent were audio and photographic equipment, and musical equipment. Notably, the purchase of books increased by almost 60 percent!
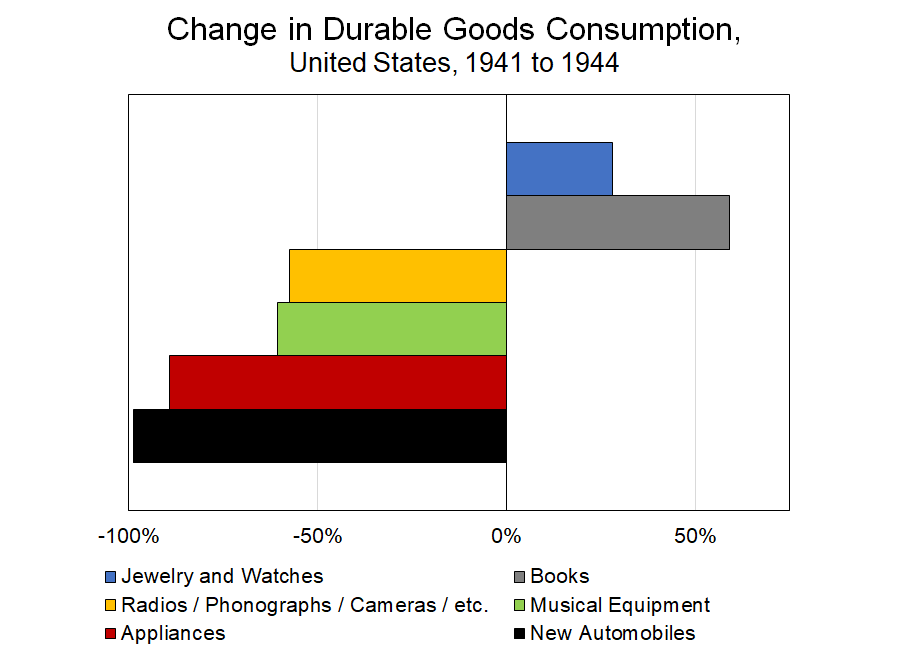
The chart above also shows that in 1944 the purchase of ‘Jewelry and Watches’ was 28 percent higher than in 1941. This understates just how much these purchases increased during the war, since they fell slightly in 1944.
I used data on the purchase of ‘Jewelry and Watches’ as part of the research and analysis for my dissertation, which was about the De Beers diamond cartel during WWII. I argued that the increase in purchases was evidence of the company’s success in conjoining diamonds with engagement. However, the war was a vital context.
At a time when Americans were foregoing luxuries, such as automobiles, appliances, cameras, and radios, they dramatically increased their purchase of jewelry, perhaps the most luxurious of luxuries. Why? During WWII the number of U.S. marriages increased dramatically. Men and women were getting engaged and married before the men went overseas. This led to a dramatic increase in the sale of diamonds rings. For more on this, you can read the dissertation, or read the presentation I gave at my doctoral defence, or watch this video of a presentation from early in my research and analysis.
The reasons for consumption changes are always many. I suspect that multiple dissertations could be written about every category of household consumption expenditure.
The fall in durable goods was not because the population could not afford them. It was because the materials needed to produce many of them were diverted to the war effort. Obviously the steel needed for private automobiles was required for military transportation and weaponry. It also required large amounts of optical materials, rubber, fine copper wire, and much more. This left much less of these essential inputs available to provide durable goods to households.
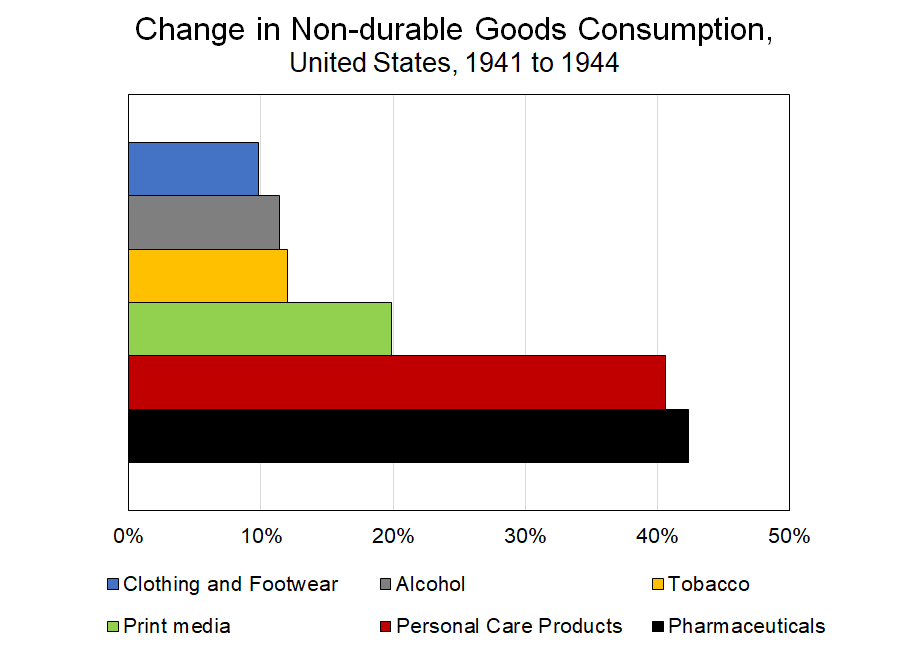
Non-durable Goods
For non-durable goods, almost every sub-category saw an increase, except those associated with automobiles and those associated with recreational activities.
However, an examination of the categories raises an important question about the meaning of consumption.
Economists and policy-makers take for granted that greater consumption means greater well-being. Of course, they will acknowledge that the reality is messier than this. But that acknowledgement does little to alter the reflexive use of national accounting measures as measures of well-being. Indeed, many of the goods and services we consume are a response to a harm.
Three of the categories of goods—alcohol, tobacco, pharmaceuticals—are at least partially coping mechanisms. The war was a stressful time. Almost everyone would have known someone serving overseas; most would have known someone who was killed. In the early years, when Germany, Italy, and Japan were swiftly claiming territories, there was incredible uncertainty about the war’s outcome. Understandably, people would have medicated that stress.
Examination of the make-up of household consumption in post-war years hammers home that increased expenditure need not mean greater well-being.
In nominal terms, total personal consumption expenditure has grown at an annualized rate of 6.5 percent per year. Certain categories have grown much more and now comprise a much larger share of people’s spending. The relationship between greater spending on these items and well-being is ambiguous, to say the least.

The above shows five categories of spending that have variable relationships with well-being. For example, greater spending on doctors is partially about greater access to more and better kinds of treatment. However, it is also about more maladies. The same is true of ambulances and hospital fees. A greater share being spent on nursing homes is partially about longer life spans. But it is also about less intra-family care for our elders, which has mixed consequences. Greater shares spent on financial services is partially about more people having wealth that needs to be managed, but also about the wealthy spending more to manage wealth in ways that avoid taxes.
Beyond the above contradictions, the majority of medical services should not be paid for by individuals. They should be free at the point-of-service, and funded by the government as a public good. The fact that hospitals now comprise eight percent of American consumer spending is outrageous when combined with the scale of medical debt. Medical care should be a right, not a growing expense. And increased household consumption that includes increased spending on medical care cannot unambiguously be claimed to express greater well-being.
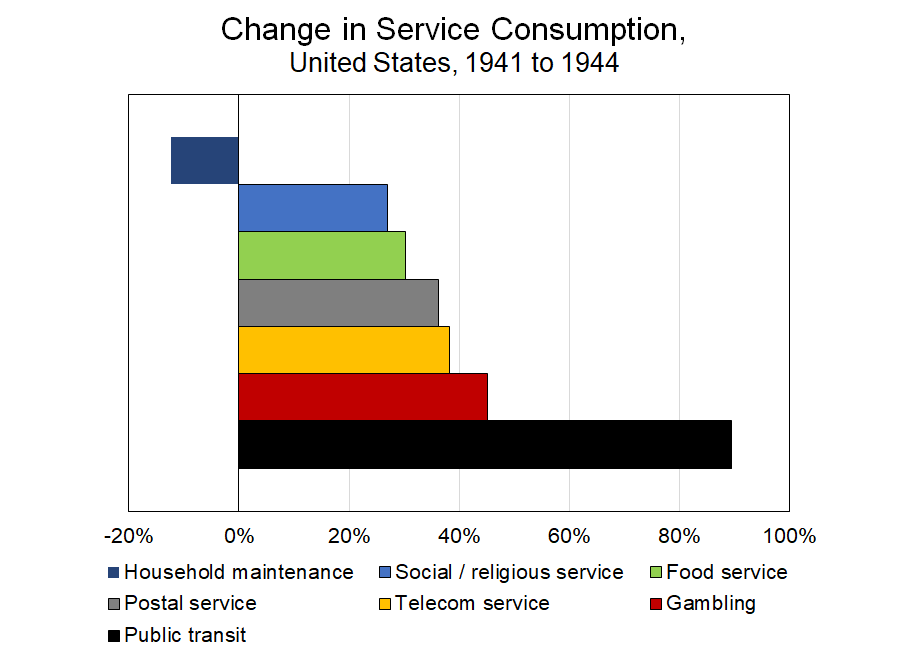
Services
As with non-durable goods, almost every sub-category, other than those associated with automobiles and recreational activities, saw an increase in consumption.
The largest increase was in the category of “food furnished to employees (including military)”. This is the only category where the military build up had obviously bled over into the data for household consumption. In 1939, it was less than one percent of all service spending. By 1945, it was 5.3 percent. However, that misleading boost to personal consumption expenditure is not sufficient to change the overall image that Mason and Konczal deploy.

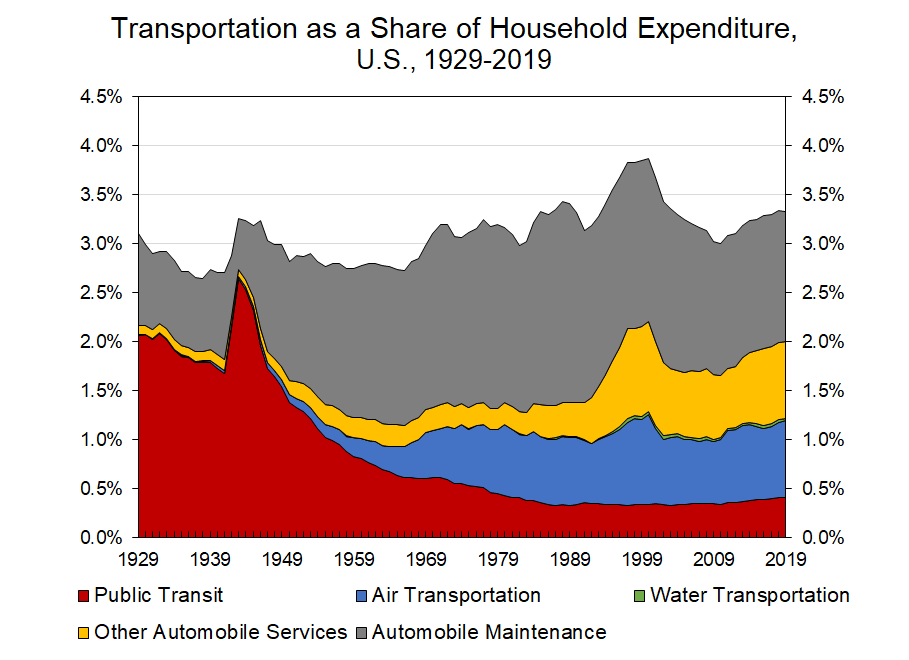
Because fuel costs had risen, and fewer cars were being purchased, there was much more use of public transit. In fact, this would be a high for public ground transportation (as a share of total consumption) for as long as the U.S. has kept national accounts. In 1943, public ground transportation was over 80 percent of all transportation services, which includes automobile service and repair. By 2019, it was barely 12 percent, having been displaced by automobile service and air travel.
When we look at the increases in the purchase of services, we see that people were eating out more and they were communicating more. Both largely express positives for people’s well-being. However, the large increase in gambling is less ambiguously good. While gambling is benign entertainment for many, it is also a problematic, even destructive, habit for others.
Perhaps the most interesting increase is in the purchase of social and/or religious services. On the one hand, this could be another expression of the undercurrent of anxiety that comes with living in wartime. On the other hand, much of the spending on these kinds of services is not for oneself; it is charitable spending.
In my research on De Beers, one of the things that jumped out from first person descriptions of life in the United States during WWII was the feeling of unity. The government very deliberately sought to create this sentiment. It wanted the entire population to feel like they were part of the war effort, even if they were not on the frontline.
In The Good War, Seth Klein writes about the Canadian government’s effort at creating public unity. It reflected on the experience of the First World War and a perceived lack of unity that hampered the war effort. Part of the failure came from a widespread sense that the burden of the war was disproportionately falling on the working class. That was part of the motive for extremely high top marginal income tax rates, and excess profits taxes.
We can debate how fairly the costs of the war were actually distributed. We debate how inclusive U.S. and Canadian societies actually became. Racial and ethnic divisions certainly did not disappear. However, many reported feeling a greater sense of solidarity. In such a setting, people likely felt feel giving.
One of the few services that did decline during the war was household maintenance, which fell by 13 percent. Conversely, purchases of tools were among the few durable goods with a stable level of expenditure. This suggests that people substituted their own labour for the the purchase of repair services. All other things being equal, this would have reduced GDP, since expenditure of our own labour is not included in national accounts, while spending for third-party labour is.
Take-aways
In Mason and Konczal’s op-ed, they mobilized the fact that price-adusted personal consumption expenditures in the U.S. continued to rise, except for 1942, even though the government massively intervened in the economy. They used the fact to argue that government can and should spend to support a post-pandemic boom. I concur with this assessment. However, I want to call attention to the qualitative shifts that occurred in consumption patterns. Aggregate consumption—a very problematic measure when adjusted for price-changes—might have continued to increase, but there were substantial differences across the categories of household consumption.
The end of the pandemic is likely to reinvigorate household consumption. Since the climate crisis continues, we must acknowledge both the necessity and the possibility of qualitative transformation. During WWII, public transportation, as a share of personal consumption expenditure, jumped by more than one percentage point. At the same time, purchases of private automobiles collapsed. The purchase of goods to service private automobiles also dropped significantly.
While there were undoubtedly certain hardships associated with this collapse, it was necessary for the war effort. For similar—and additional—reasons we need to confront the likelihood that current private automobile ownership must be drastically reduced. However, this does not have to mean that we are necessarily worse off. This will be discussed more in the conclusion to Part 3.