Home › Forum › Political Economy › Beating the hell ouf of the average
- This topic has 14 replies, 6 voices, and was last updated November 6, 2021 at 6:38 am by Rowan Pryor.
-
CreatorTopic
-
June 4, 2021 at 5:37 pm #245759
Judging by profit margins, the most powerful firms in the S&P500 are pharmaceuticals.
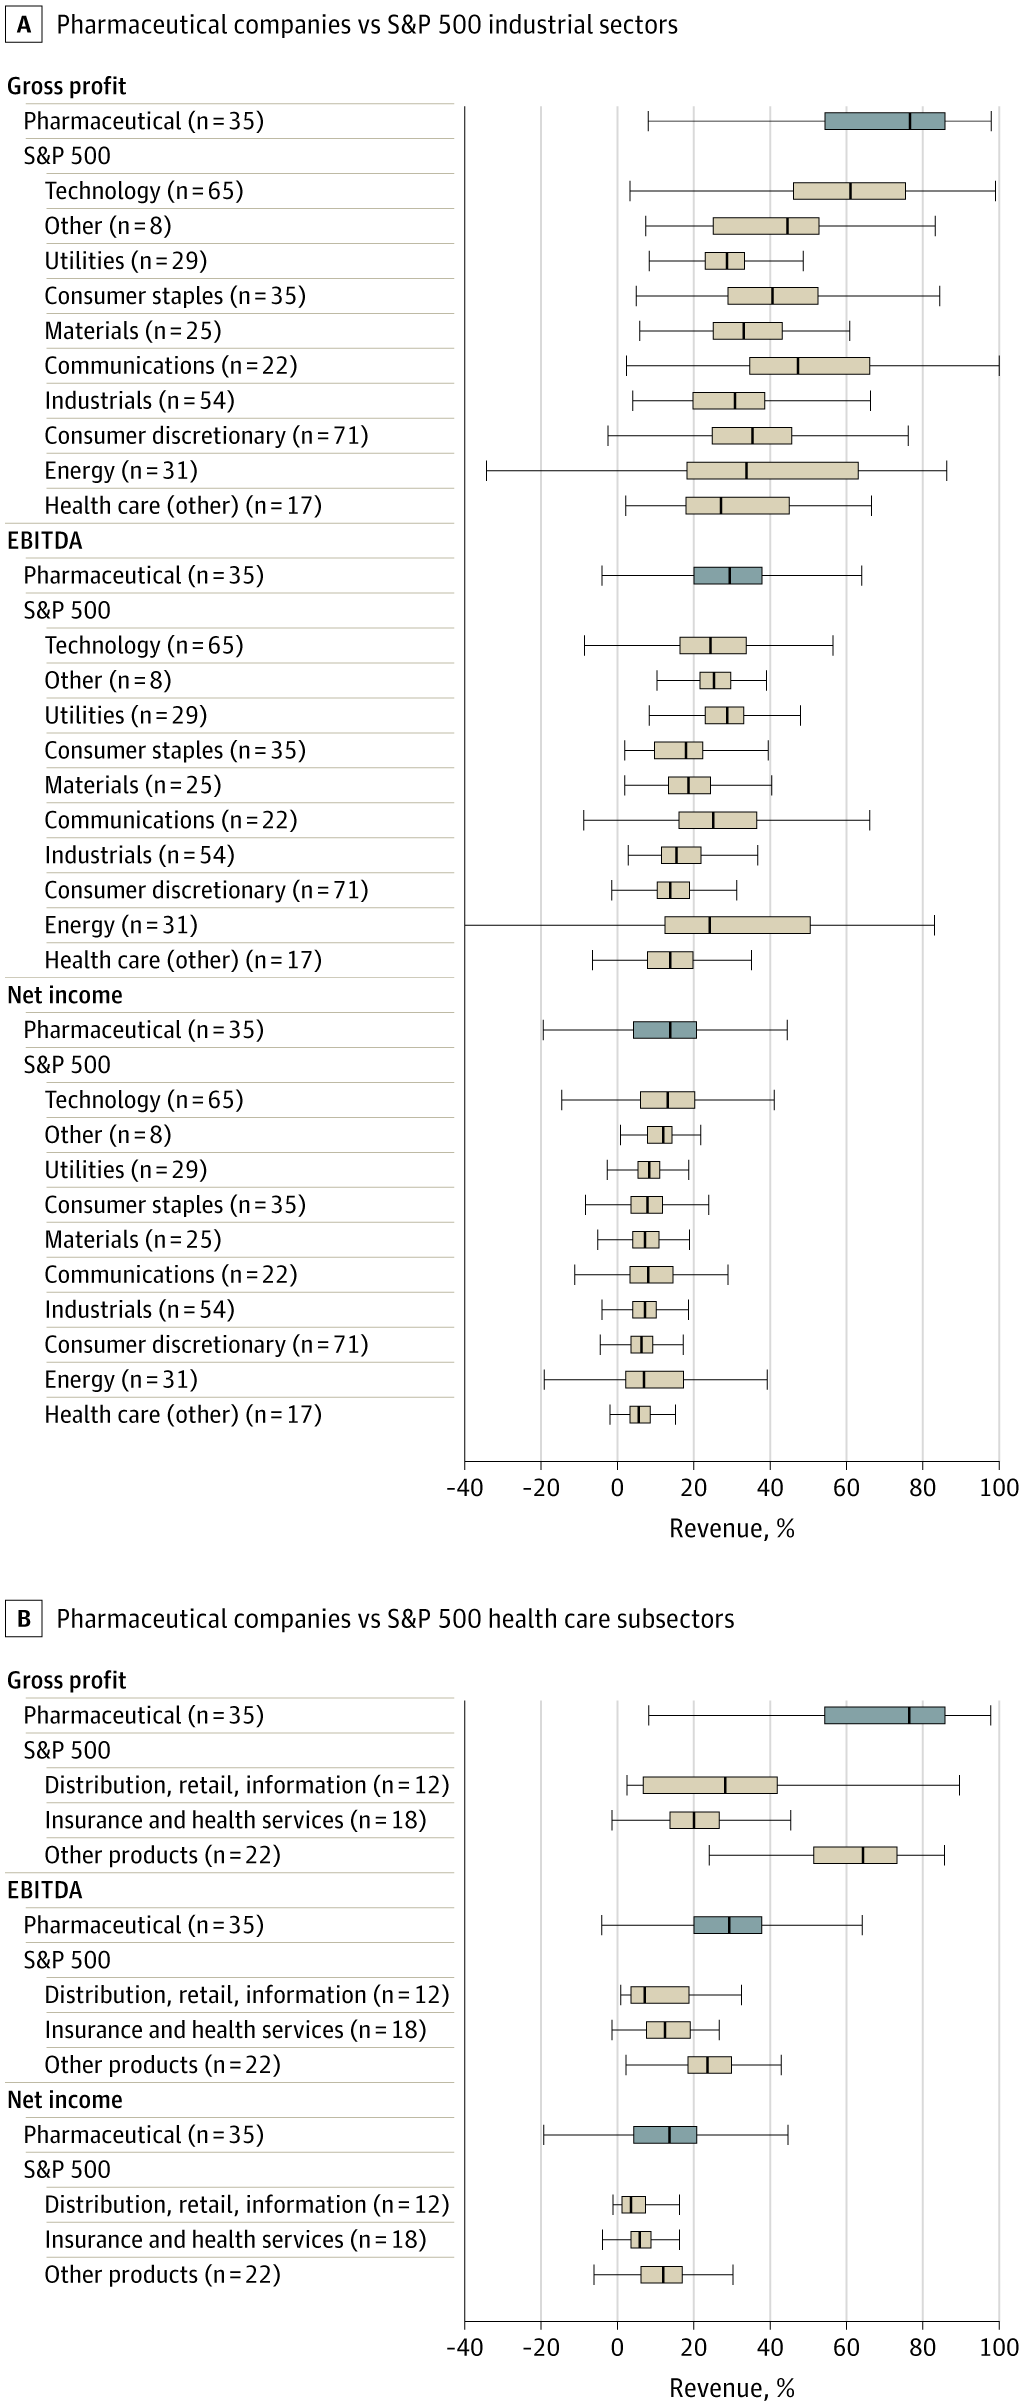
In their 2020 study, ‘Profitability of Large Pharmaceutical Companies Compared With Other Large Public Companies‘ (JAMA 323, 9, March 3, pp. 834-843), Ledley et al. show that, during the period 2000-2018, the top 35 pharmaceutical firms in the S&P500 outperform virtually every other group (with a possible exception of “technology”).
They had higher gross profit margins, higher EBITDA margins and higher net margins. They also did better than non-pharmaceutical health care firms.
This is one of their charts:
-
CreatorTopic
-
AuthorReplies
-
-
June 4, 2021 at 7:14 pm #245760
But did that profitability result in differential capitalization compared to other S&P 500 companies?
Health insurance provider United Health Care (UNH) may not have been as profitable as pharmaceutical companies, but its share price grew much more (>13x) over the same period (2000-2018), at least compared to the two largest market cap pharma companies today:
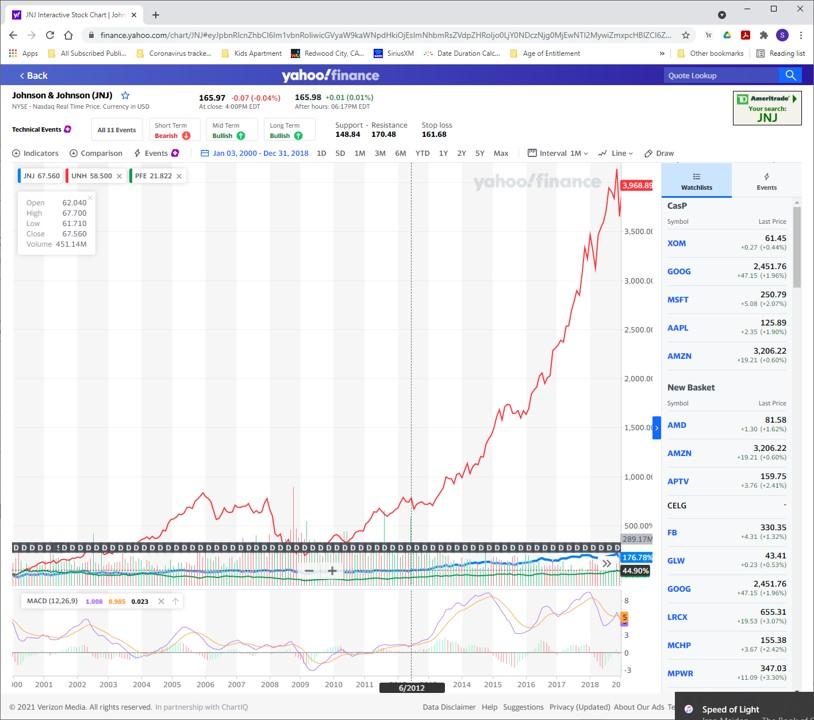
Here is a link to a comparison between UNH and the top 5 pharma companies from 2000 until today. UNH’s share price has grown 6000% compared to Roche’s 425% (the largest increase of the 5) in the same period. The S&P500 grew only 188% over the same period.
FYI – it is my understanding that health insurance companies, like all insurance companies, are judged by a different set of metrics than product companies, as insurance companies don’t do anything other than try to maximize the percentage of premiums they keep as profits. Also, regardless of the rate of inflation, healthcare costs go up by 7% a year in the US because the health insurers and providers negotiate annual price increases and lock them in a year in advance. UNH is fine with annual growth, as long as it retains its 15% of premiums as profits.
-
June 4, 2021 at 7:53 pm #245762
But did that profitability result in differential capitalization compared to other S&P 500 companies?
I don’t know the answer to this question with respect to pharmaceuticals and the S&P500 in the U.S., but I can say something about the global scene.
The figure below is part of my current work-in-progress with Shimshon on the pharmaceutical companies.
The chart shows the distributive share of listed pharmaceutical firms in the net profit and market capitalization of all listed firms in the world (as provided by Datastream).
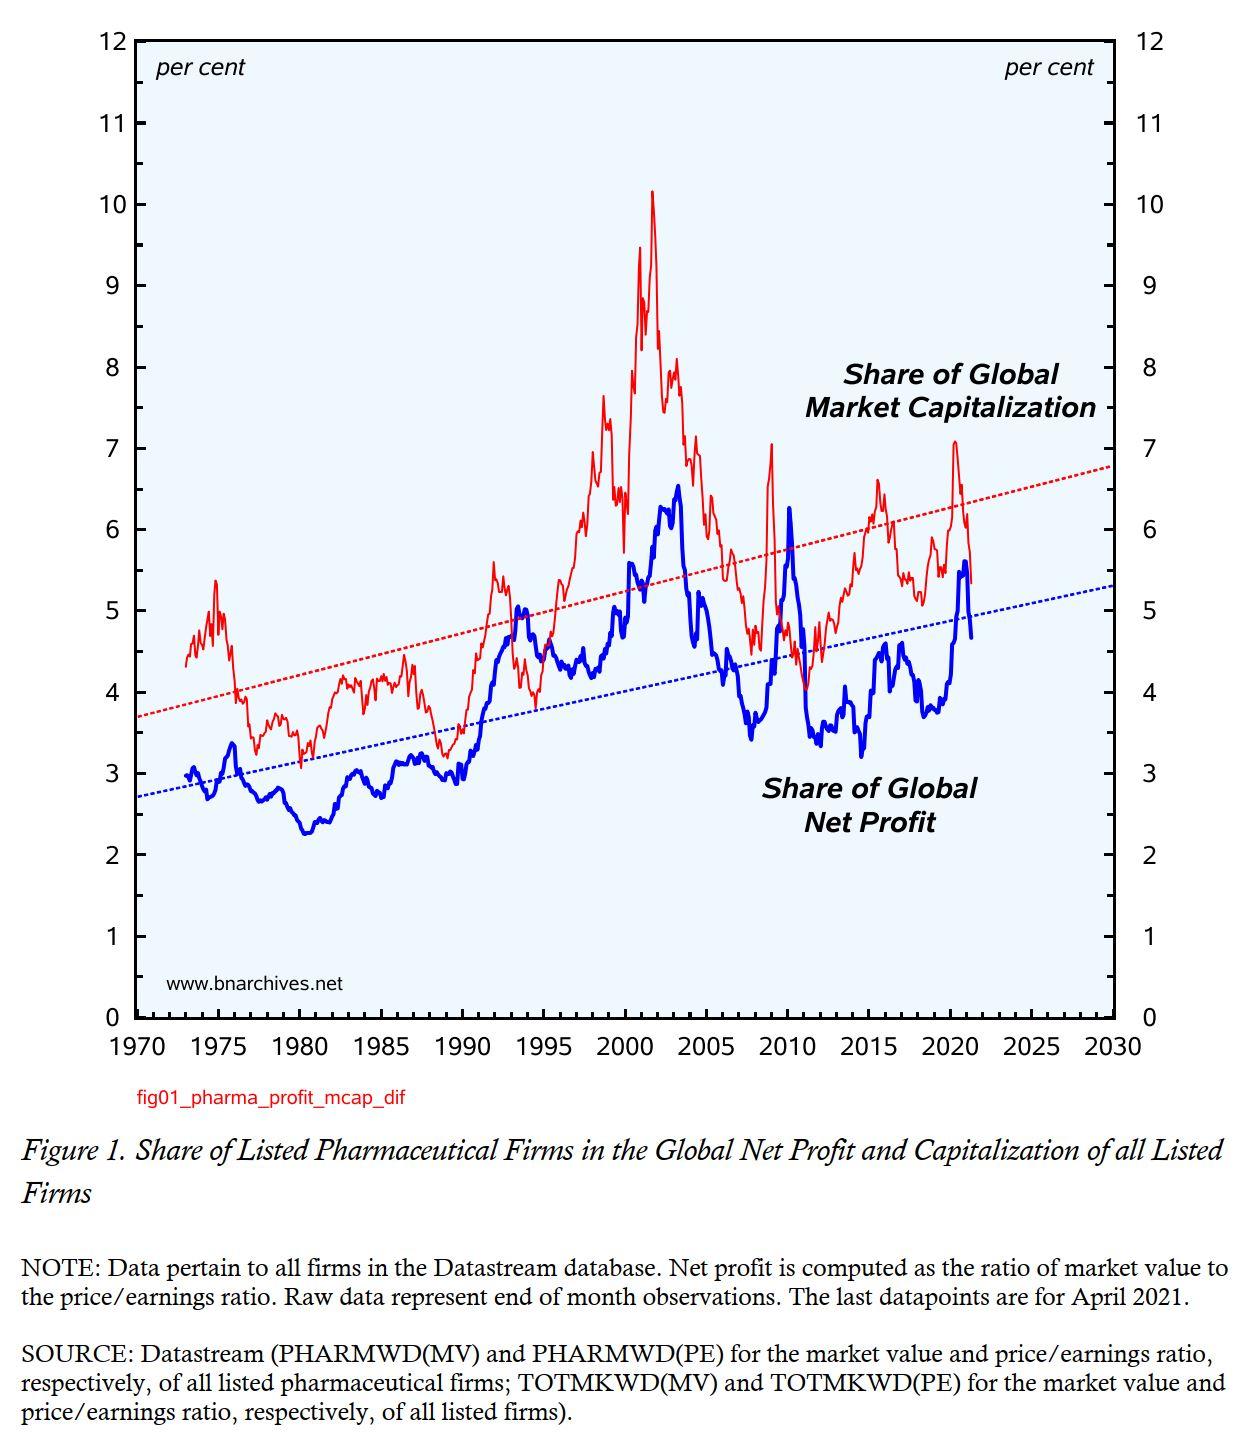
The data suggest that, over the past half century:
(1) both shares have trended upward;
(2) their long-term movements have been positively correlated; and
(3) generally, the pharmaceutical share of market capitalization has been greater than its net profit share.
So, on the face of it, there is basis to think that (1) differential profit growth has driven differential market capitalization growth, and (2) investors expect differential profit growth to accelerate (hence the larger PE ratios implied by the relationship between the two differential indices in the chart).
- This reply was modified 5 years ago by Jonathan Nitzan.
-
June 6, 2021 at 8:44 am #245770
Thanks for this, Yoni. A few follow up questions:
1. Is the pharma PE ratio actually rising in absolute terms? I’m not sure if it’s directly evident from the graph.
2. Is the PE ratio rising diferentially (compared to the global PE)?
3. If it is, why assume it has to do with differential expected profits and not with differential risk reduction?
-
June 6, 2021 at 10:54 am #245771
Max:
1. Both PE ratios — for the pharma sector and for the world — have trended mildly upward over the period.
2. The long-term trend of the ratio of PE ratios (pharma PE / World PE) has been virtually flat at roughly 1.5 (eye balling).
3. You are correct: the positive ratio of PE ratios implies expectations for differential profit growth and/or differential risk reduction. In our ongoing research, we show that this is what happened historically: the pharma sector outperformed on both counts.
-
-
June 8, 2021 at 1:28 pm #245776
Here is a brief research note summarizing our argument on the capitalist outlook:
Bichler, Shimshon, and Jonathan Nitzan. 2021. Pharmaceuticals: Beating the Hell Out of the Average. Research Note (June): 1-5.
More to come.
-
June 10, 2021 at 6:09 pm #245796
Regarding the ‘free-cash-flow’ argument made in the third footnote of our piece.
To reiterate, the claim against Figure 2 in our research note is that (1) capitalists discount not net earnings, but the free cash flow; and (2) that, in the case of pharmaceutical firms, the relative magnitude of the free cash flow (compared to the average) is higher than the relative magnitude of net earnings (compared to the average).
If the relative magnitudes of the free cash flow and of market capitalization are the same, it follows that capitalists see the future growth of pharmaceutical free cash flow and/or risk as being the same as the average.
But that is not what the data indicate.
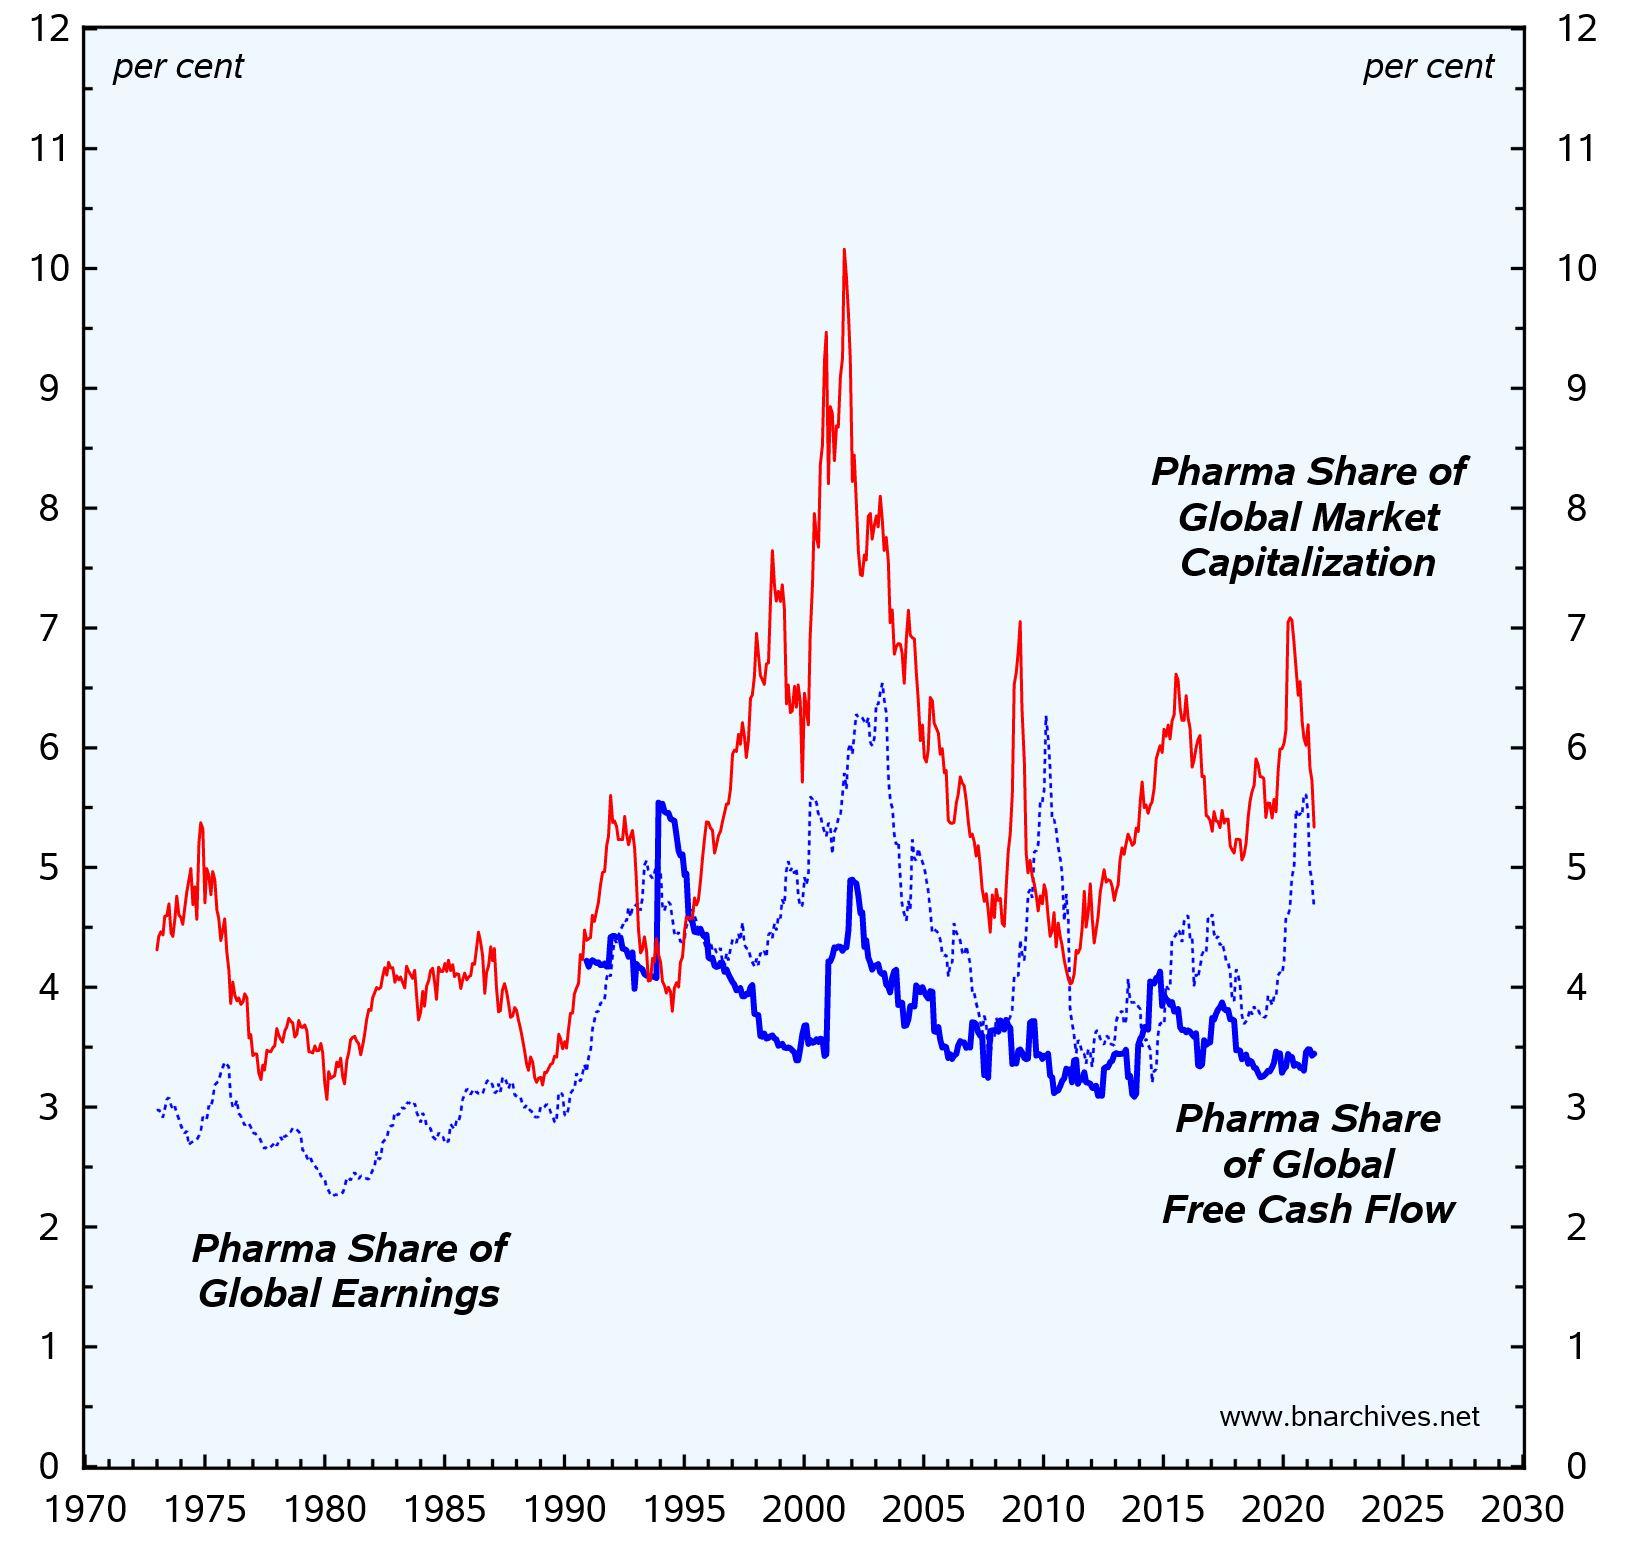
Instead, they show that:
1. In terms of magnitudes, the relative shares of market capitalization > net earnings > free cash flow.
2. In terms of trends, the slopes of market capitalization > net earnings > free cash flow.
- This reply was modified 5 years ago by Jonathan Nitzan.
-
-
June 27, 2021 at 4:57 pm #245838
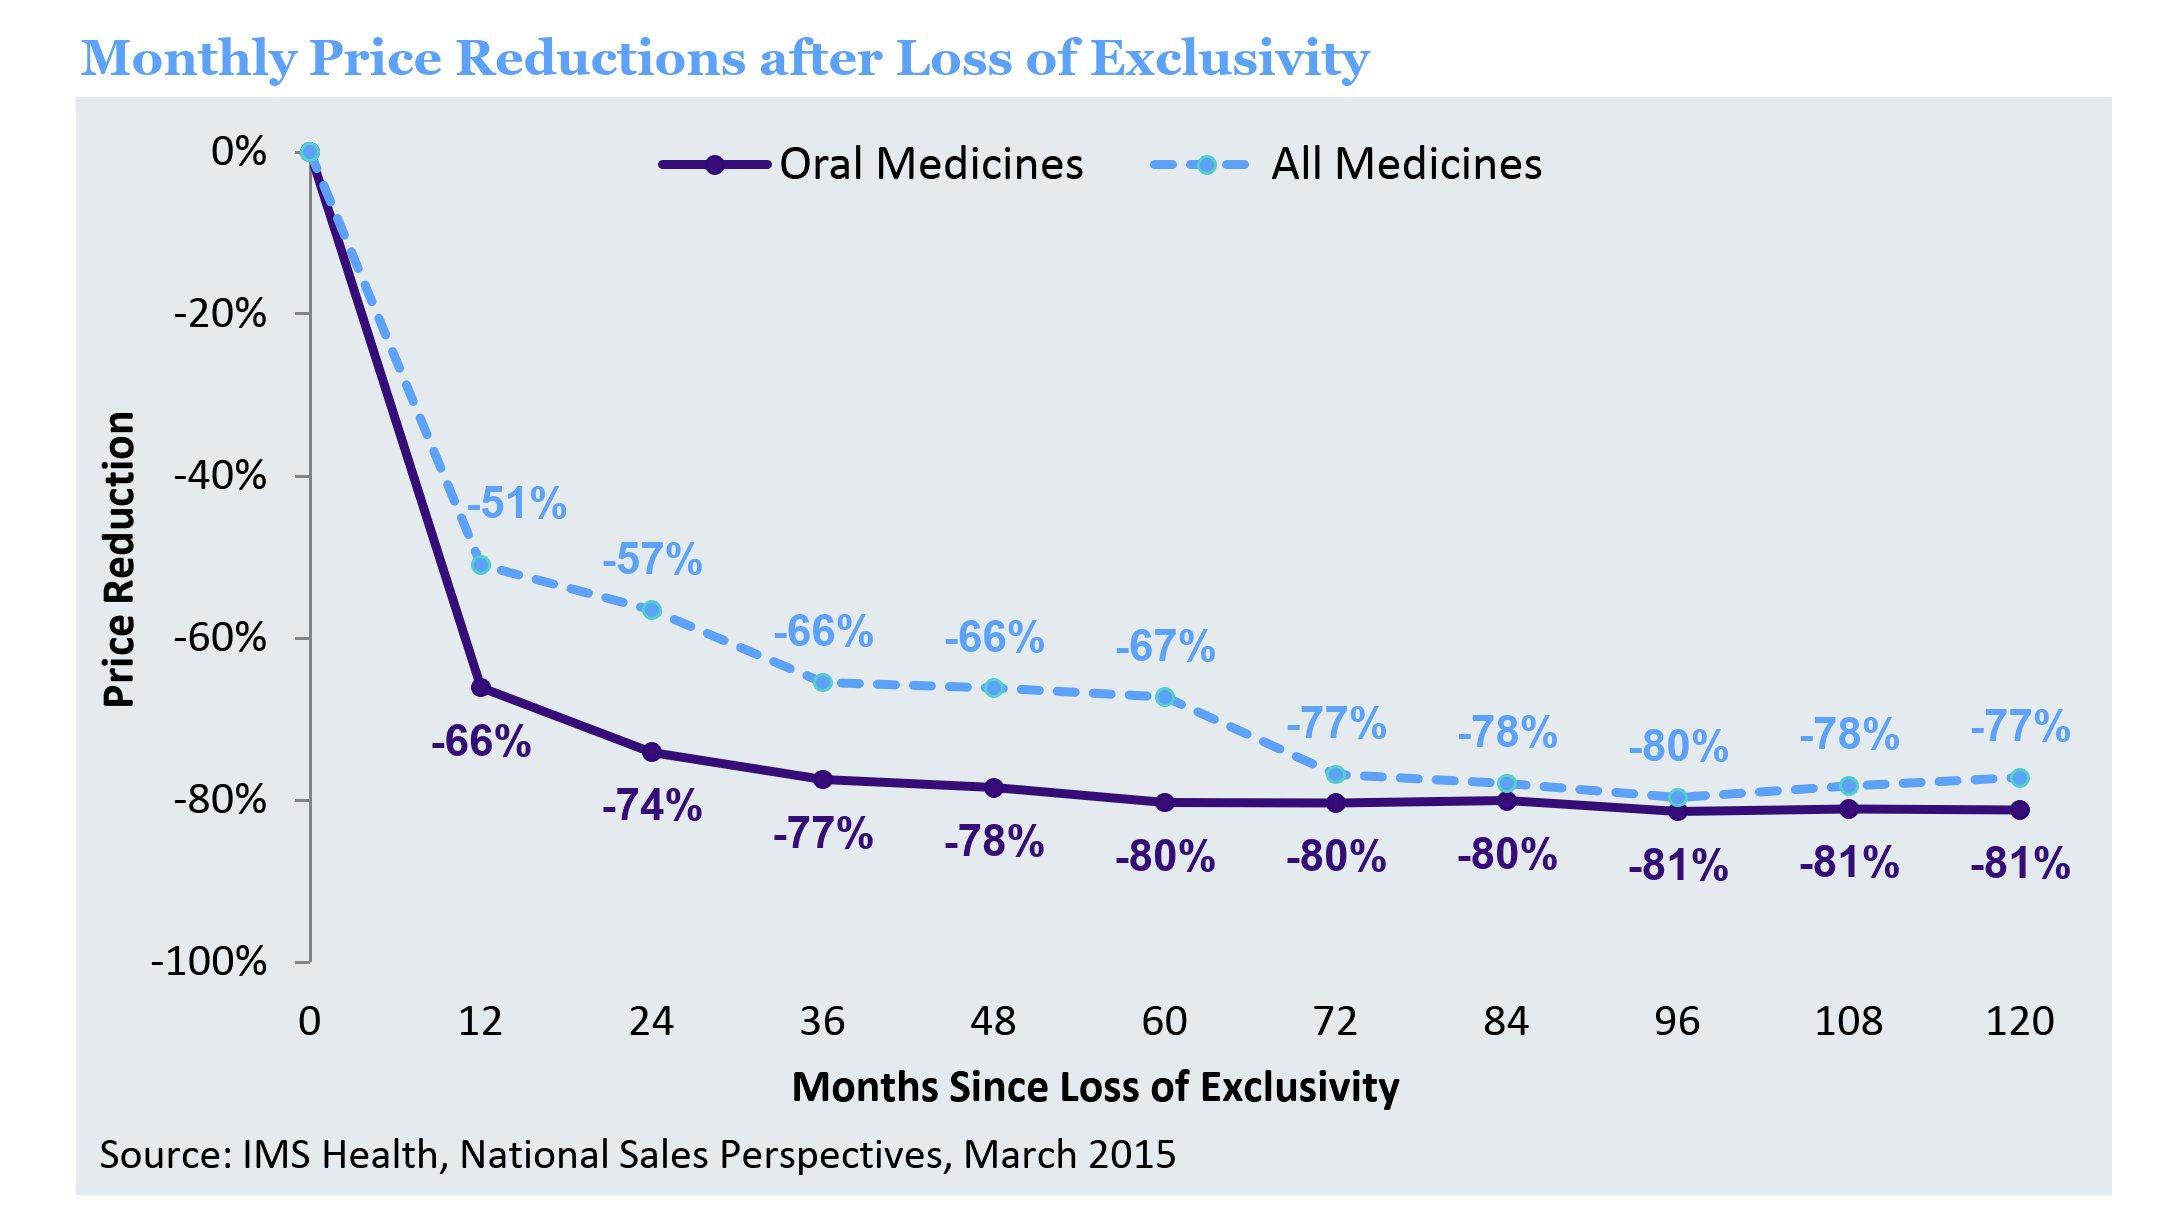
Power? What Power. Pharmaceutical company defenders claim that patent protection helps companies finance their R&D — and, moreover, that protection is temporary: once removed, generic prices drop precipitately.
IMS Institute for Healthcare Informatics. 2016. Price Declines after Branded Medicines Lose Exclusivity in the U.S. January. Parsippany, NJ.
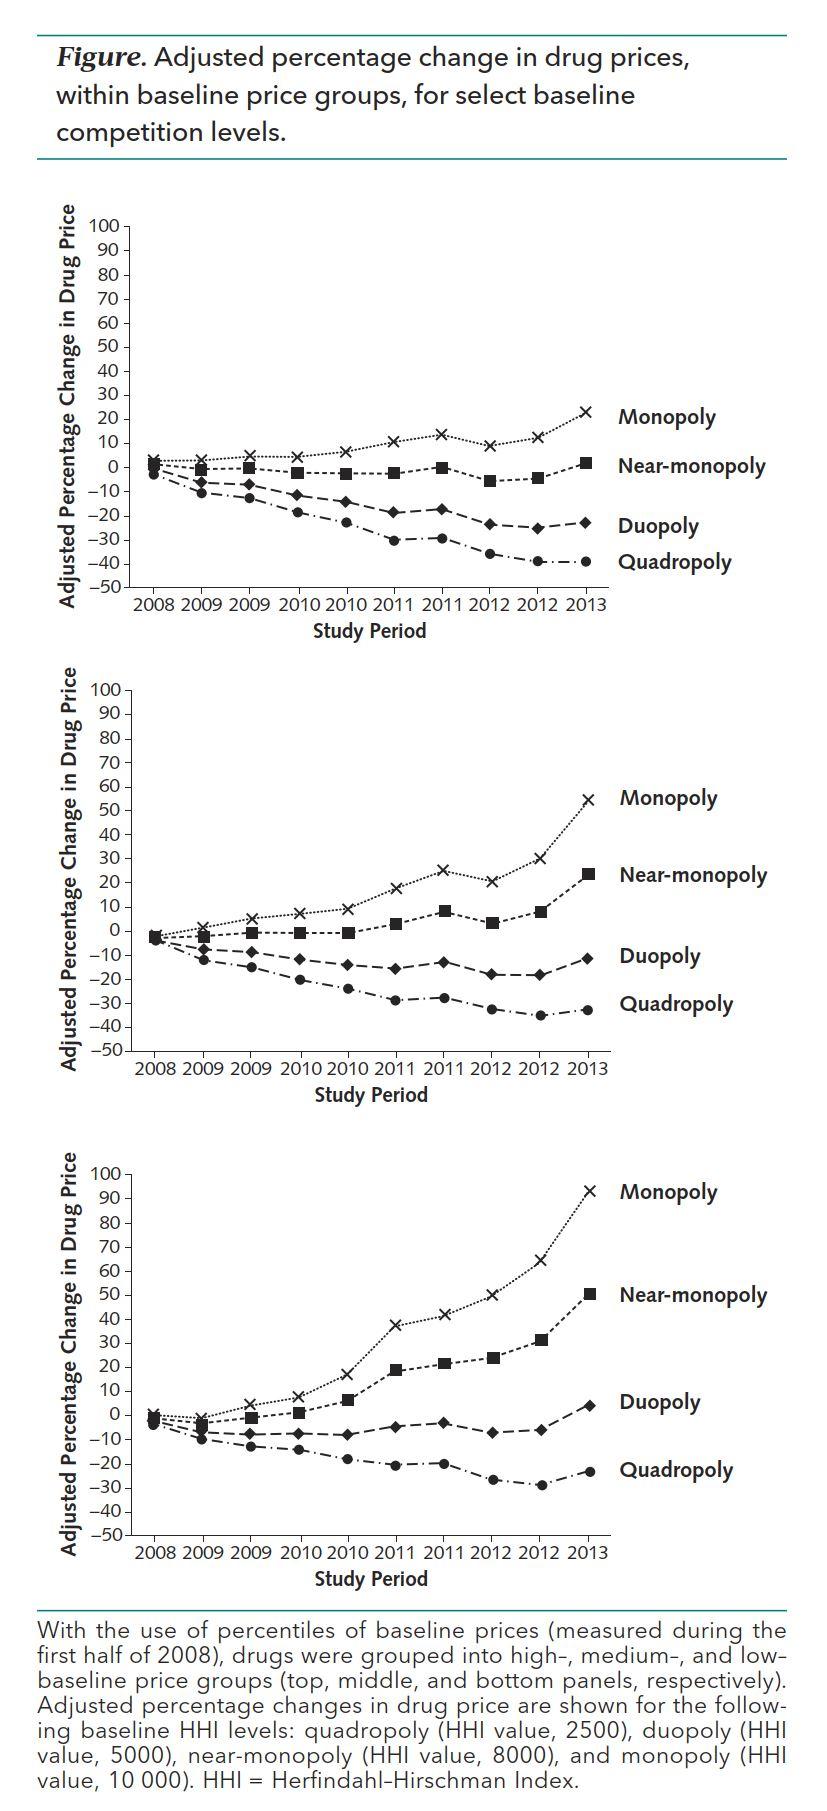
But wait. Generic pharmaceuticals have grown so concentrated, that generic drug prices are rising! In 2008-13, they increased by 30%. In this chart, we see generic price increases for expensive drugs (top panel), medium priced (middle) and cheap (bottom).
Dave, Chintan V., Aaron S. Kesselheim, Erin R. Fox, Peihua Qiu, and Abraham Hatzema. 2017. High Generic Drug Prices and Market Competition. A Retrospective Cohort Study. Annals of Internal Medicine 167 (3): 1-8.
-
June 28, 2021 at 5:18 pm #245839
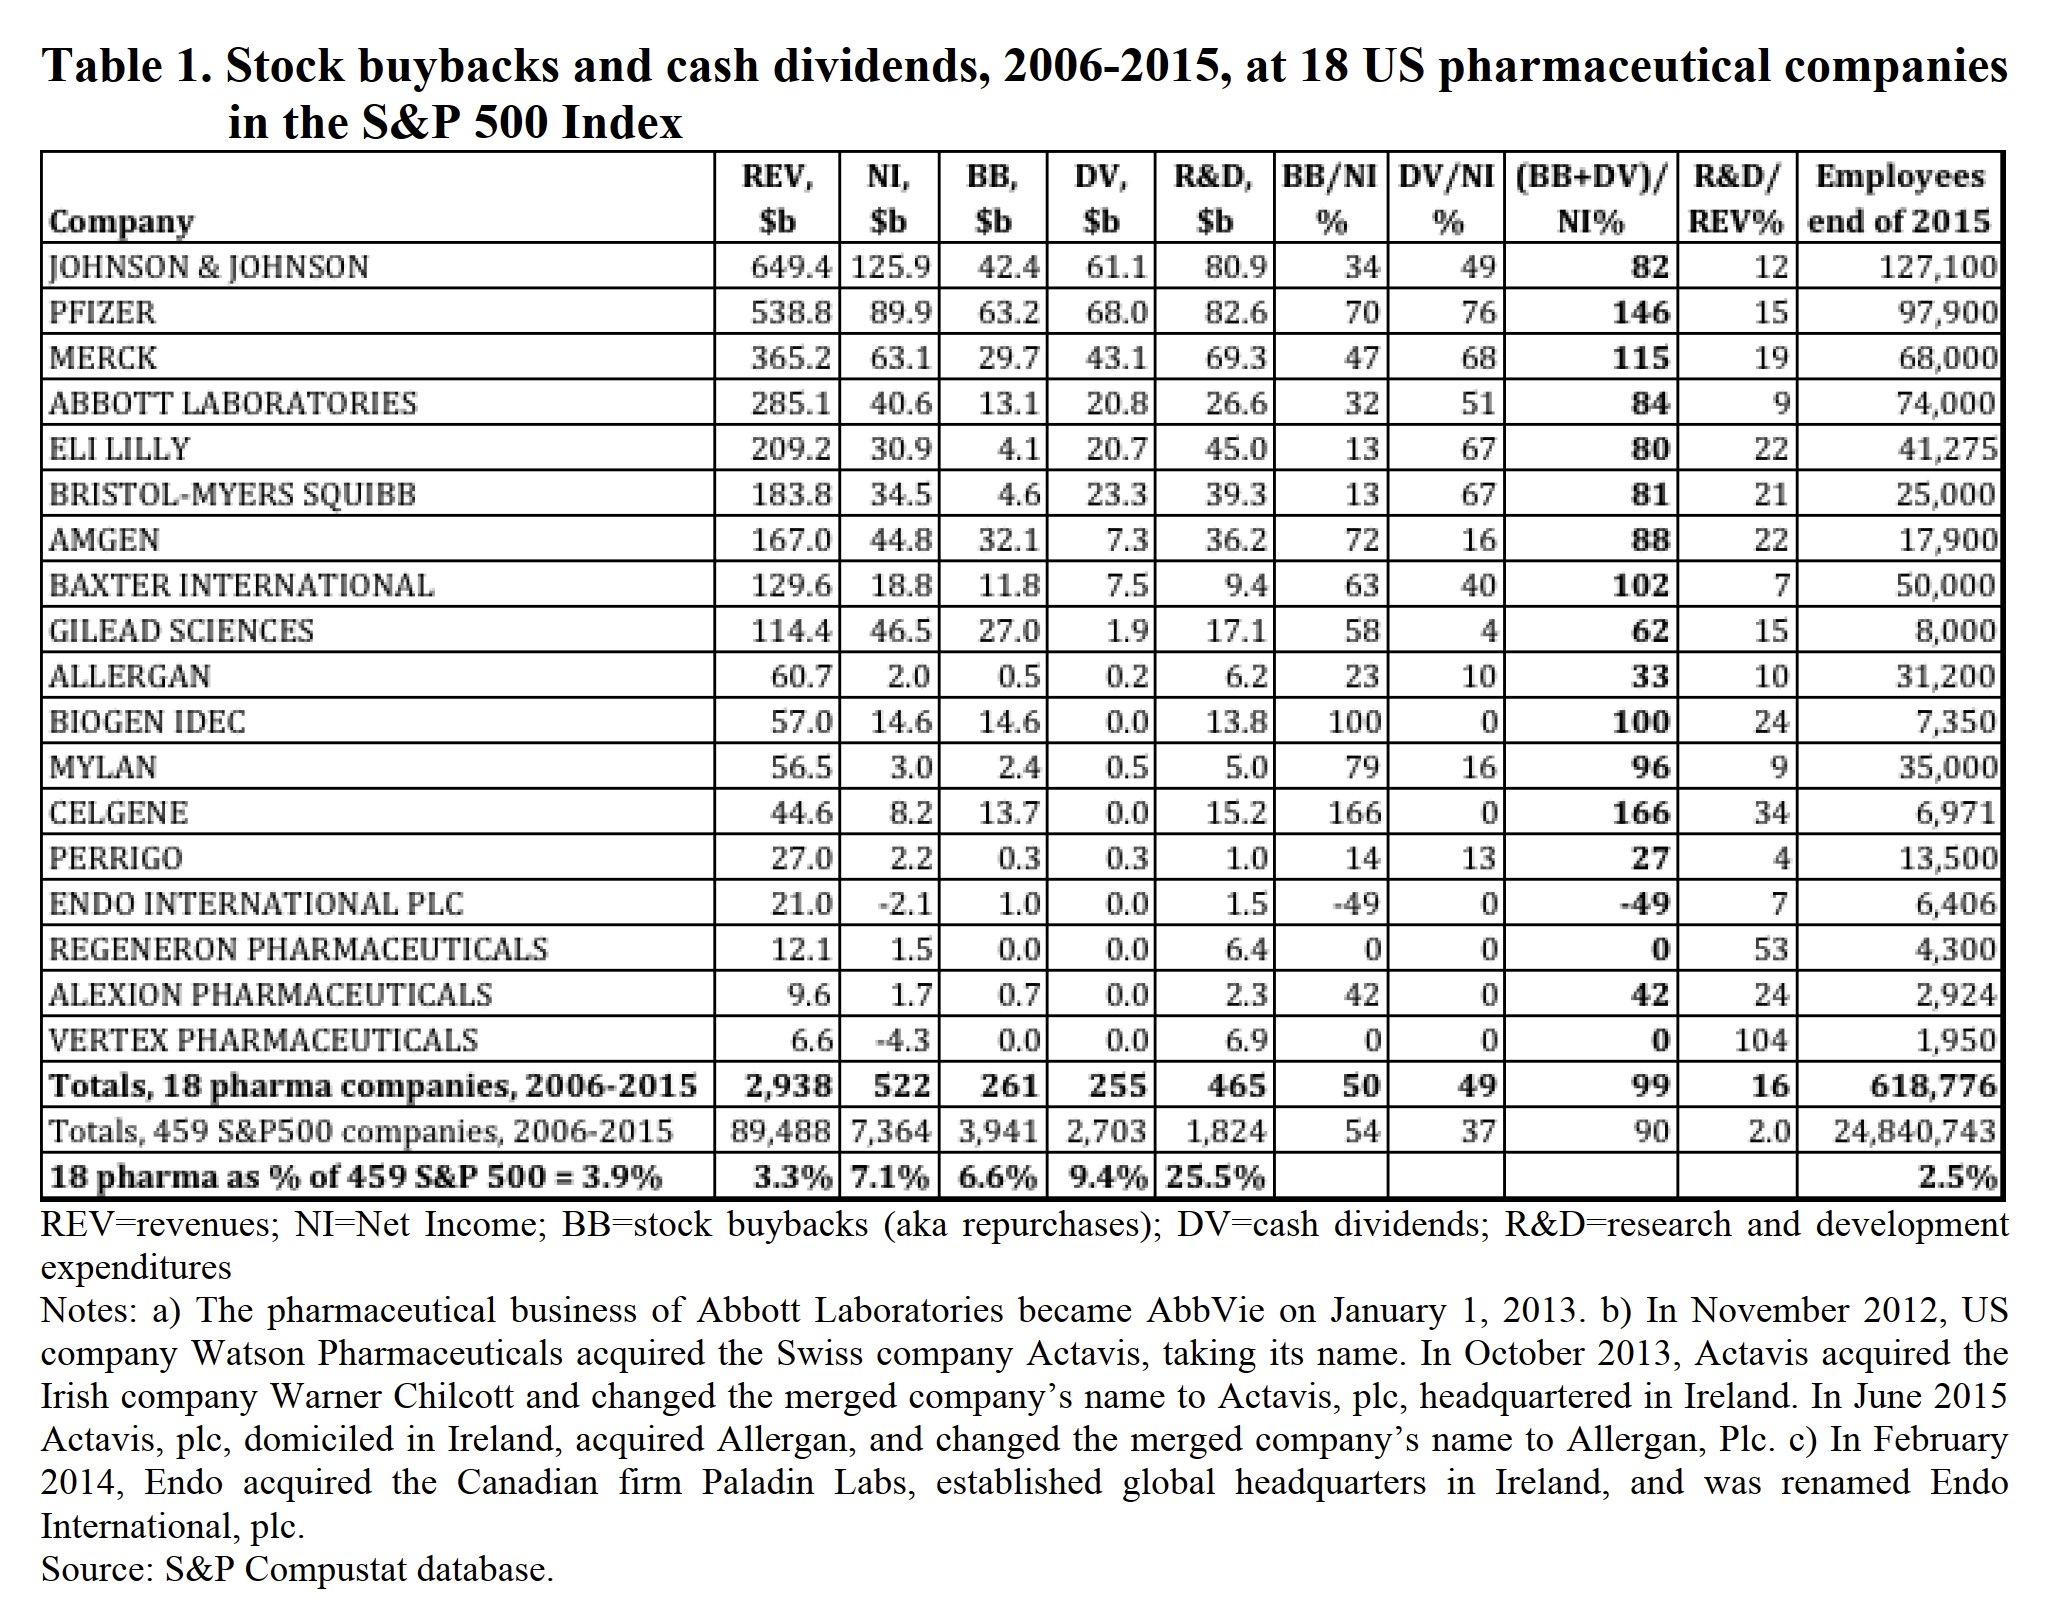
Ever wondered what profit is good for?
Lazonick et. al. show that, in 2006-2015, the 18 U.S. pharmaceutical firms in the S&P500 used 99% of their net income to buy back their own stocks and pay dividends. The number for the rest of the S&P500 was 90%.
Lazonick, William, Matt Hopkins, Ken Jacobson, Mustafa Erdem Sakinç, and Öner Tulum. 2017. US Pharma’s Financialized Business Model. Institute for New Economic Thinking Working Papers (July 13): 1-28.
- This reply was modified 5 years ago by Jonathan Nitzan.
-
June 29, 2021 at 6:47 pm #245842
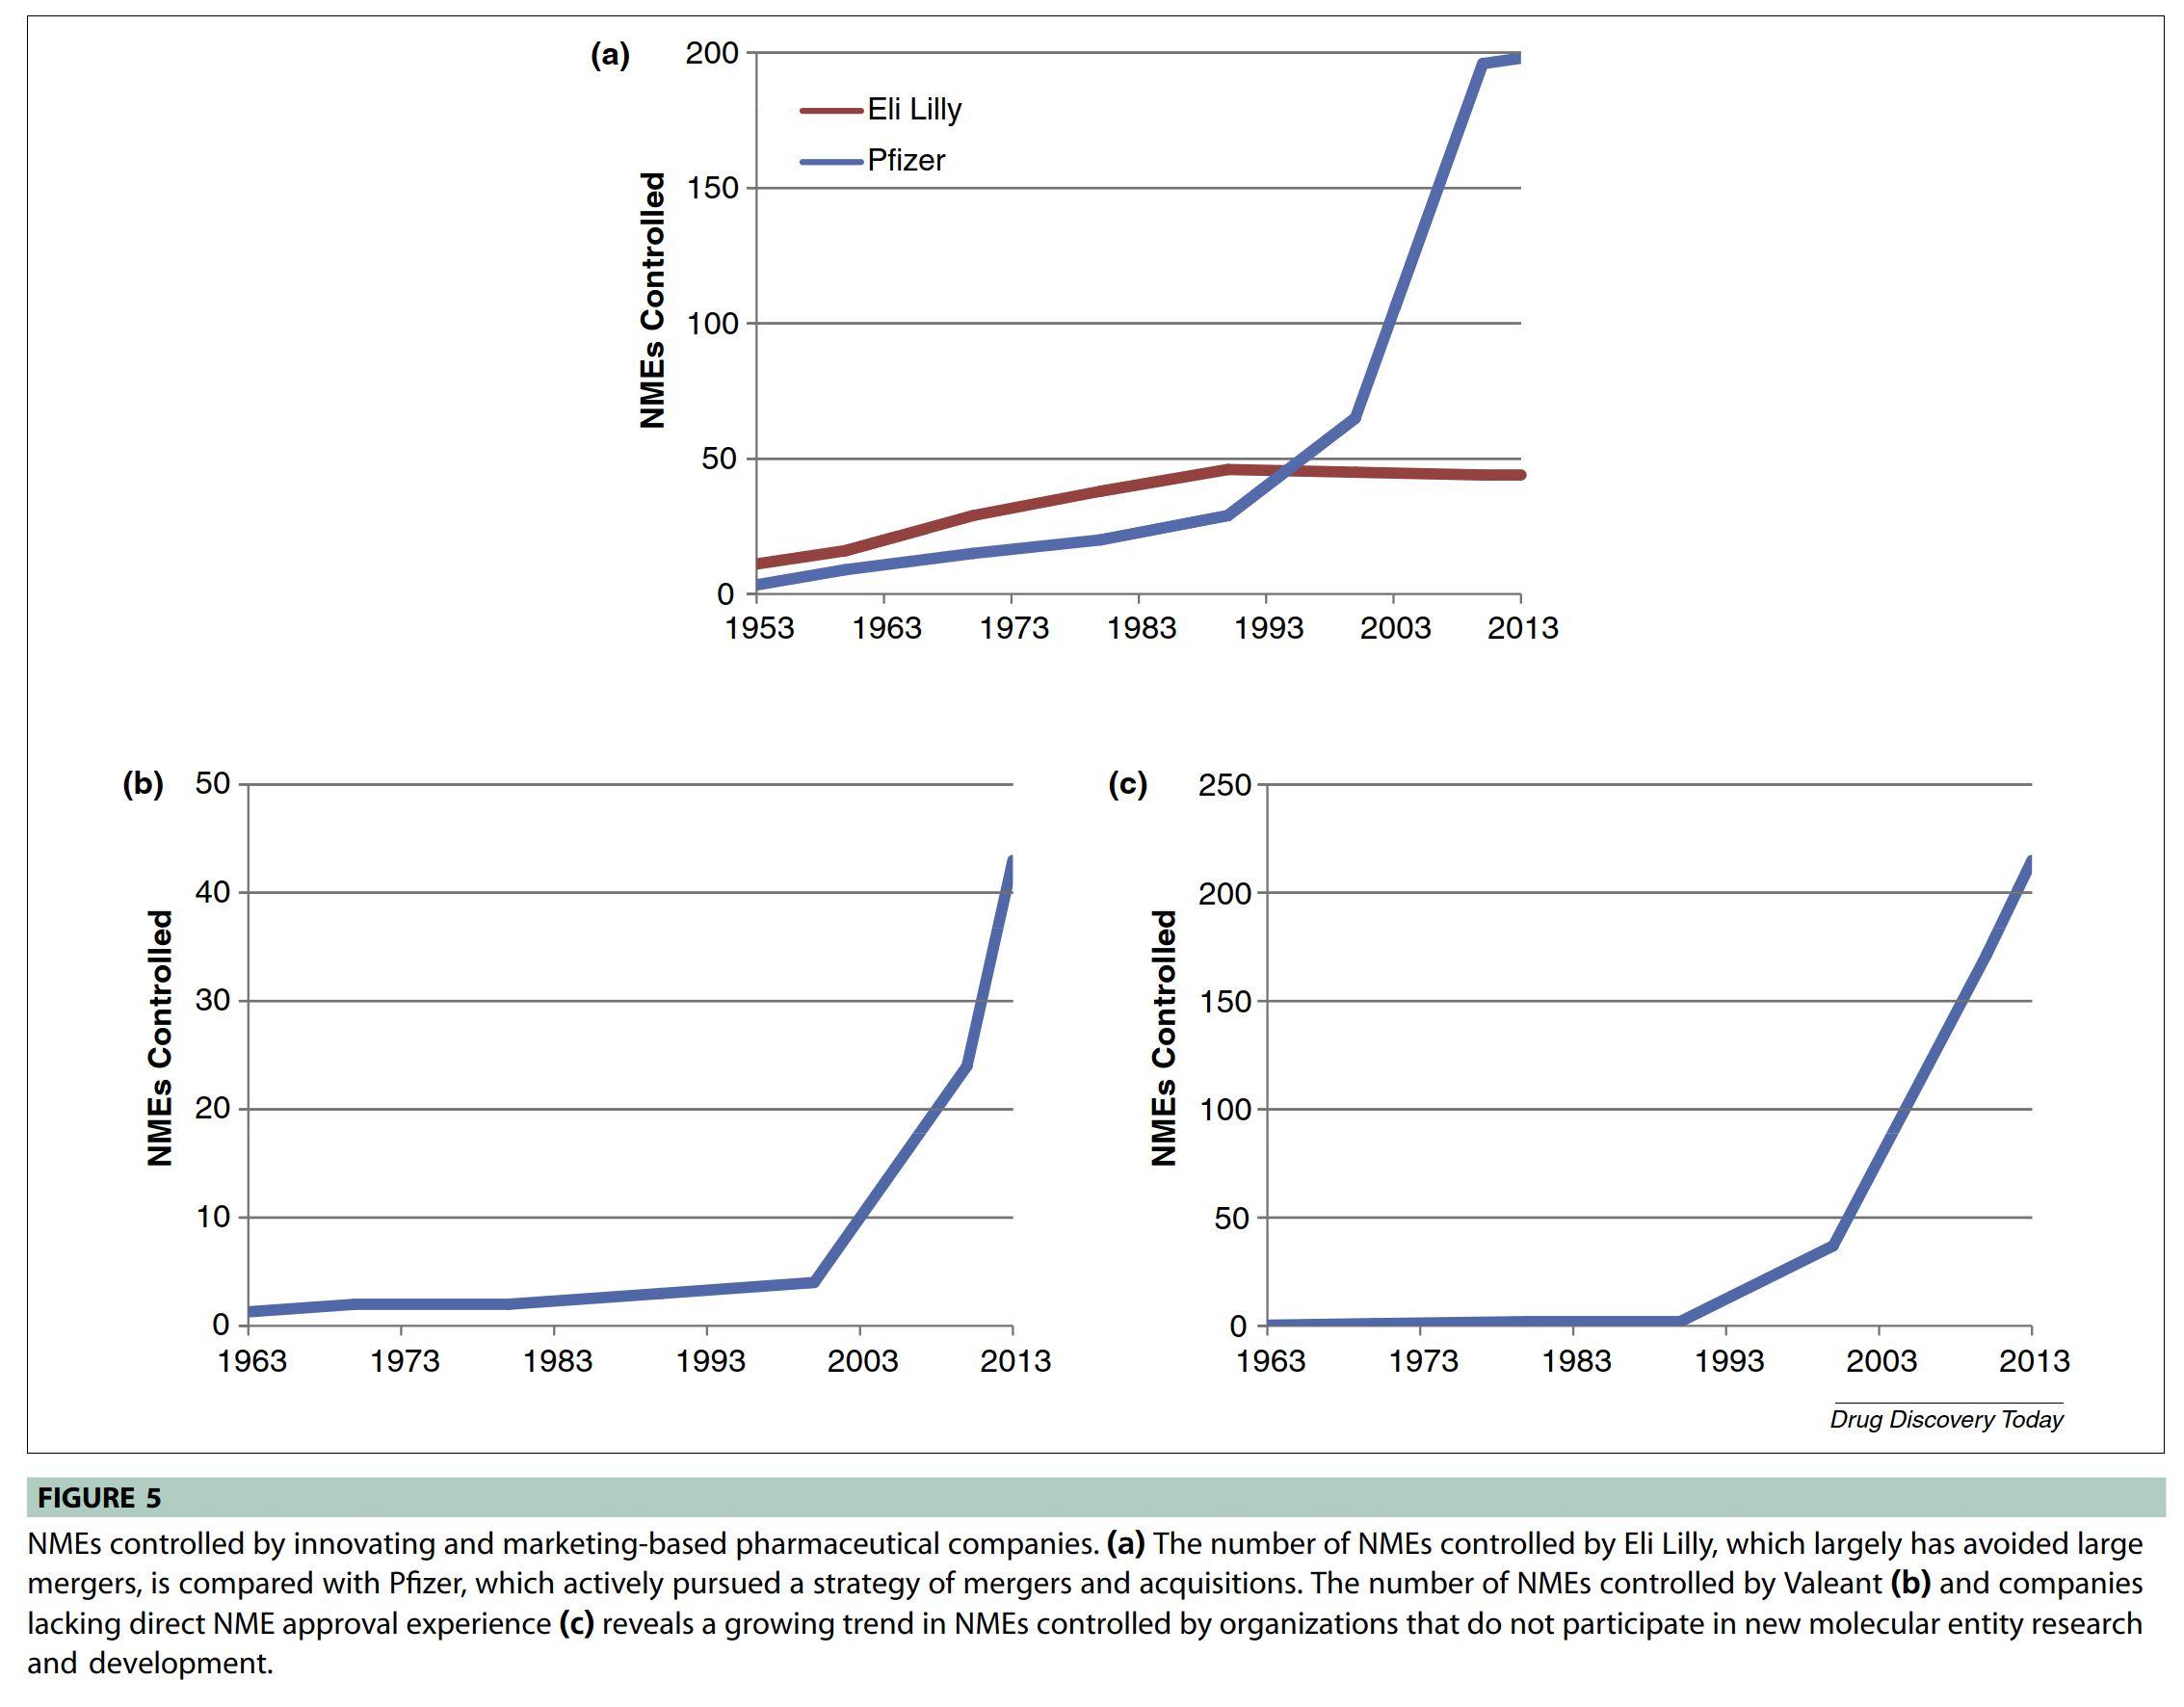
According to Kinch et. al., ownership of new molecular entities (NMEs) has grown highly concentrated – in 2013, the top 10 pharmaceutical firms owned more than 2/3rds of all NMEs, while the top 5 pharmaceutical firms owns over 40%.
Kinch, Michael S., Austin Haynesworth, Sarah L. Kinch, and Denton Hoyer. 2014. An Overview of FDA-Approved New Molecular Entities: 1827-2013. Drug Discovery Today 19 (8, August): 1033-1039.
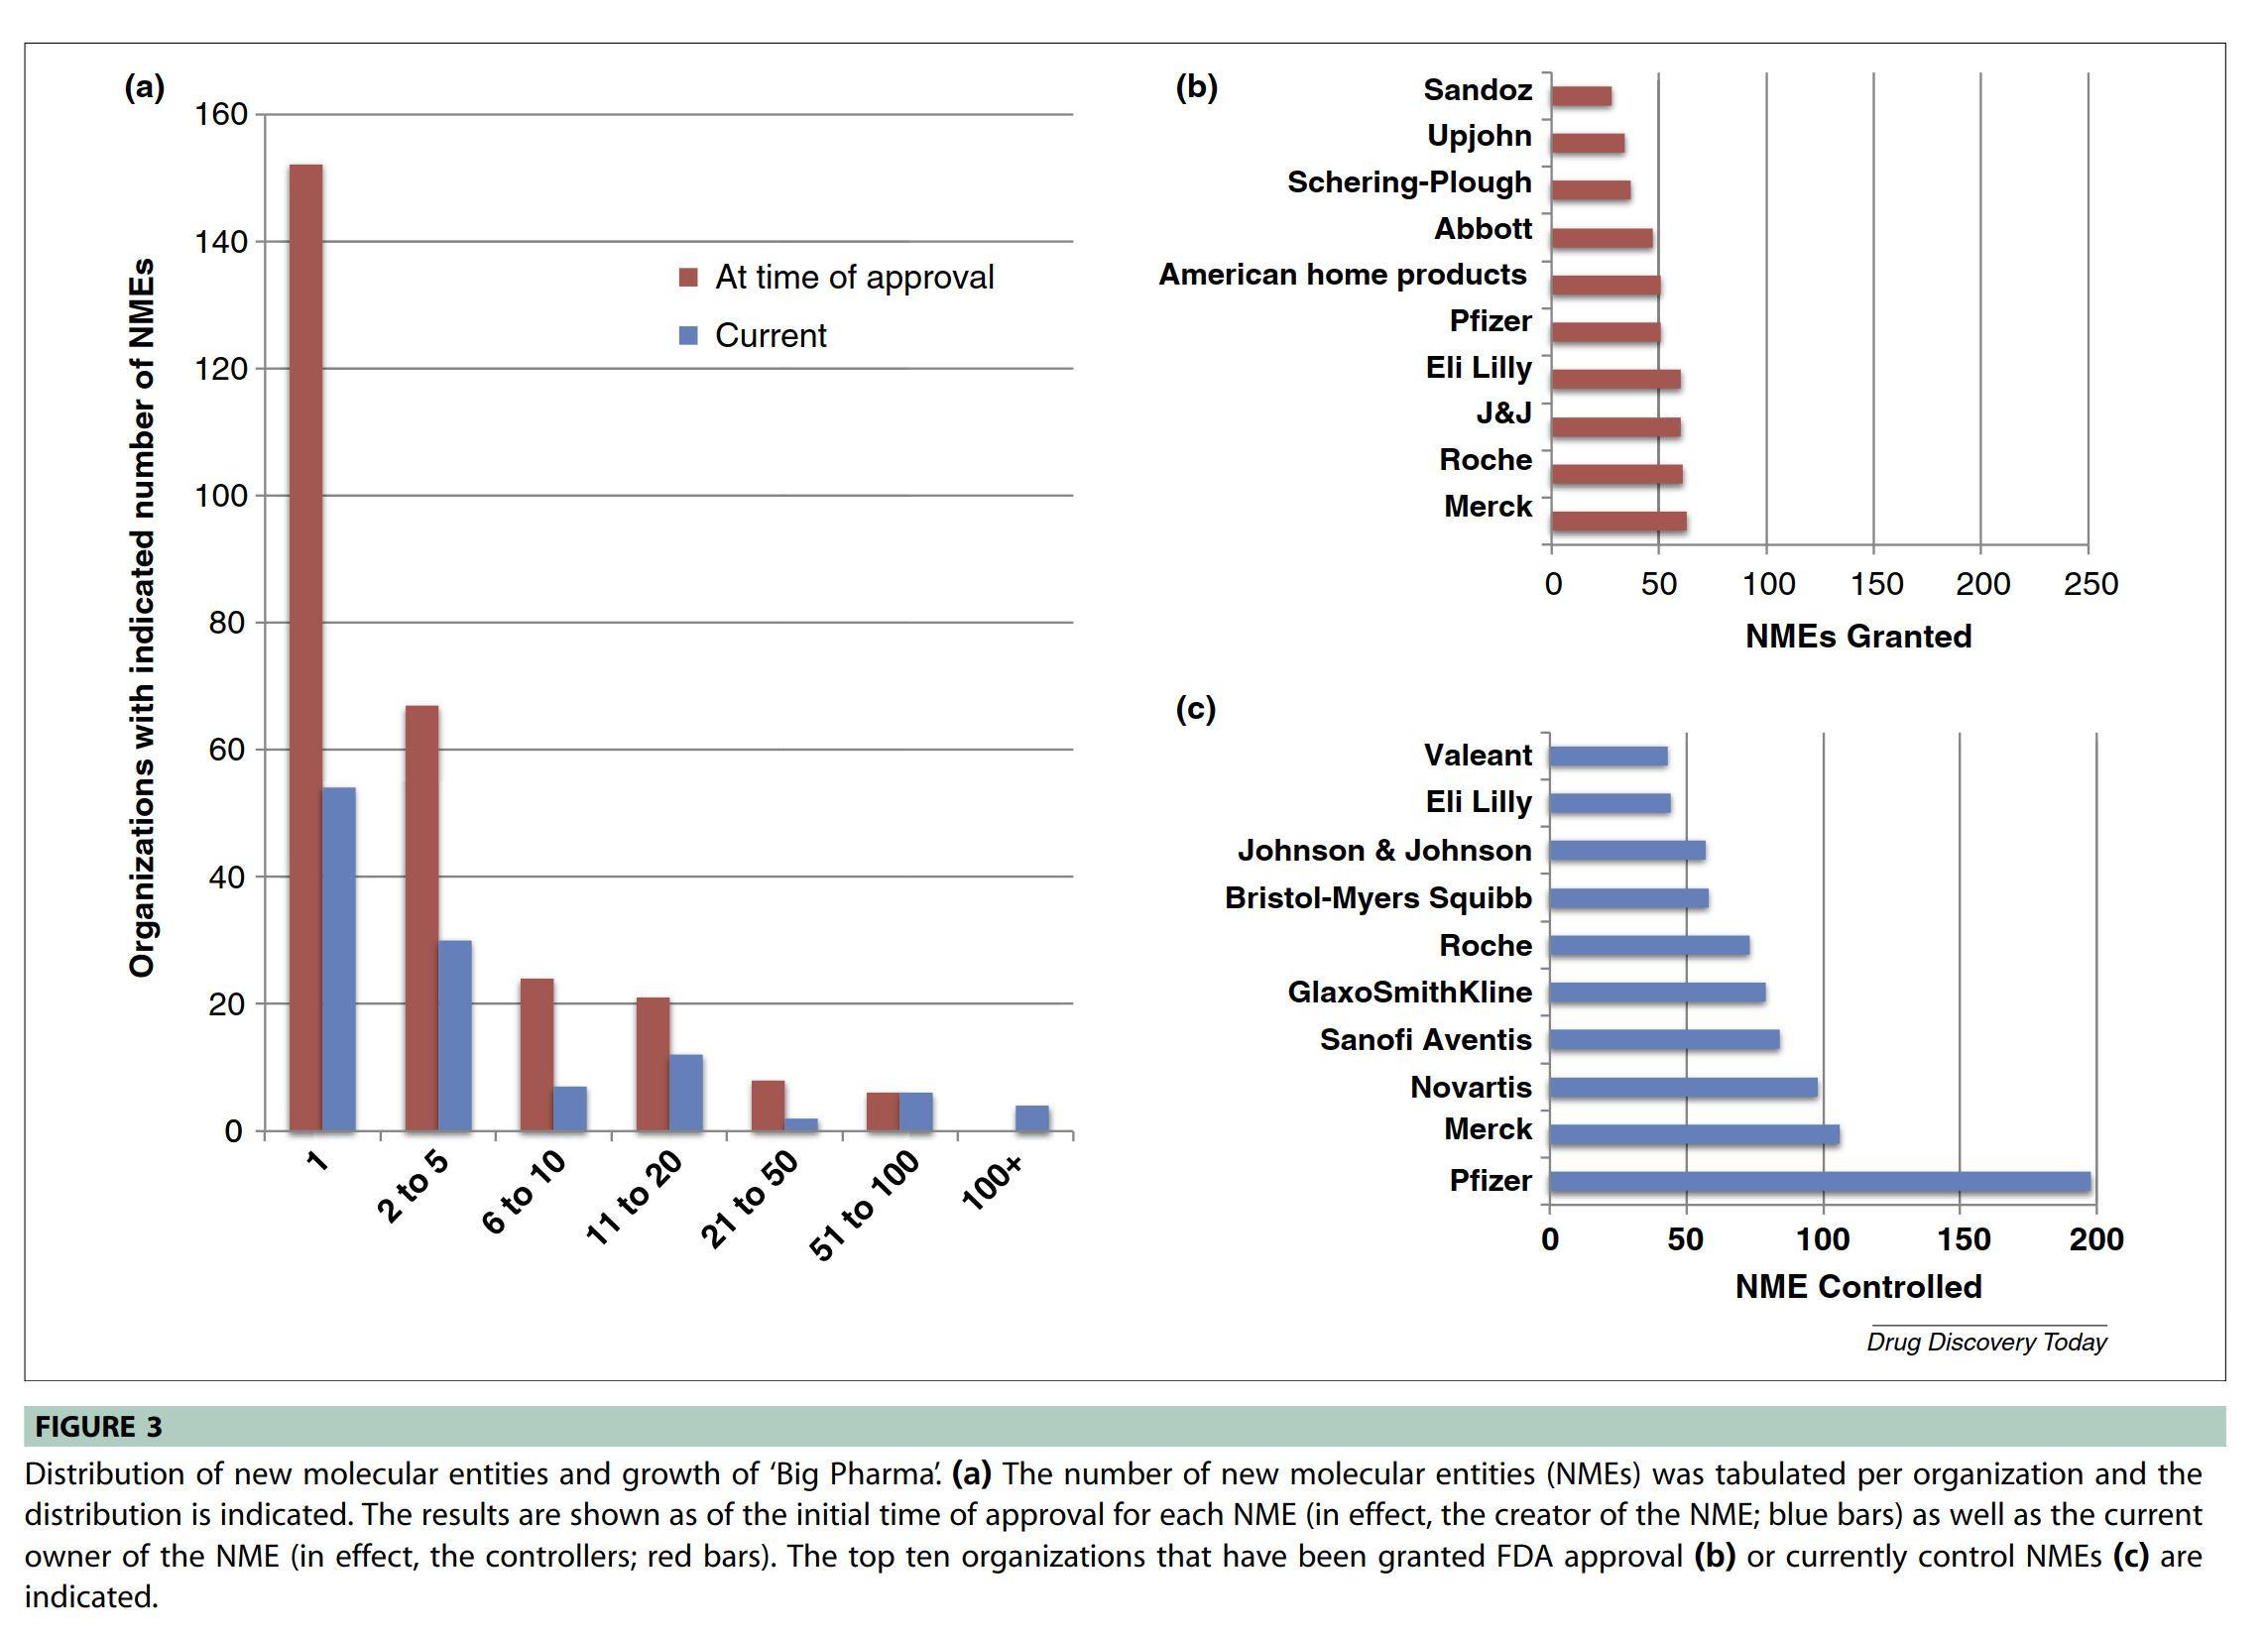
Much of this concentration is due to mergers & acquisitions. Panel 1 shows the rise of company-gobbler Pfizer versus internal developer Eli Lilly. Panels 2 and 3 show NMEs owned by firms that develop none!
-
June 30, 2021 at 9:54 am #245843
Fascinating, Jonathan. It still blows my mind that we allow chemical compounds to be put under intellectual property. Imagine if Marie Curie had patented the formula for Radium. Or worse still, if Dmitri Mendeleev had patented the formula for the periodic table. It would be absurd … and yet drug companies have convinced us that they should have the this right.
-
June 30, 2021 at 3:07 pm #245844
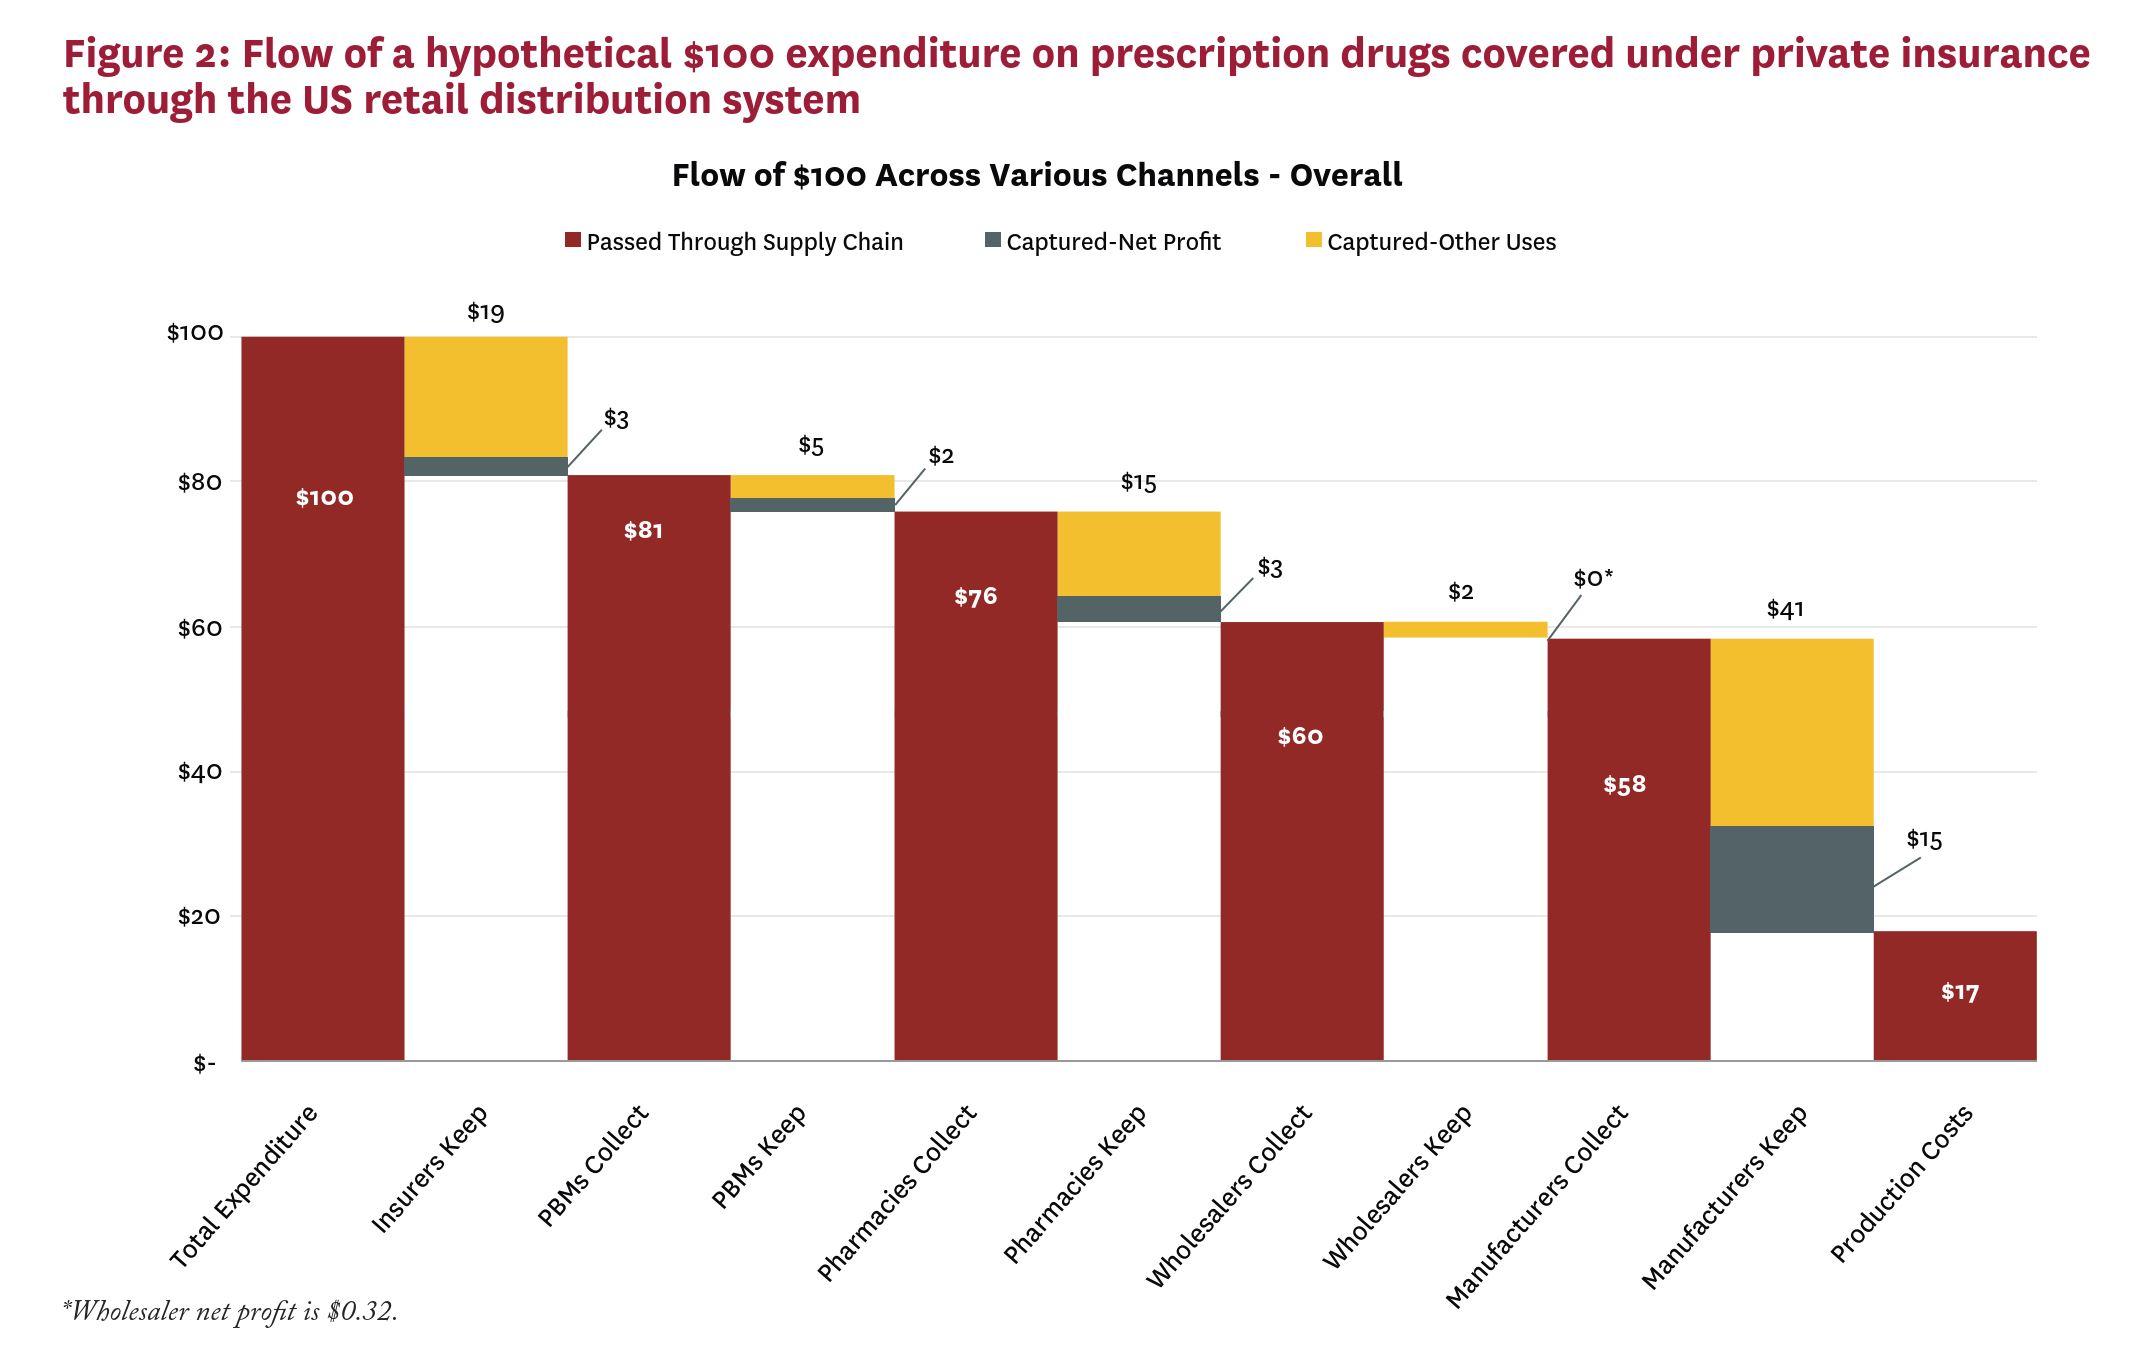
Some breakdown of U.S. drug cost, based on:
Sood, Jeeraj, Tiffany Shih, Karen Van Nuys, and Dana Goldman. 2017. The Flow of Money Through the Pharmaceutical Distribution System. Los Angeles, CA: USCSchaeffer Leonard D. Schaeffer Center for Health Policy Economics.
According to Sood et. al., a $100 drug in the U.S. costs only $17 to produce. The rest goes to the pharmaceutical firms and various intermediaries. A full $23 of the $100 is earned as profit — $15 by the pharmaceutical firms and $8 by the intermediaries.
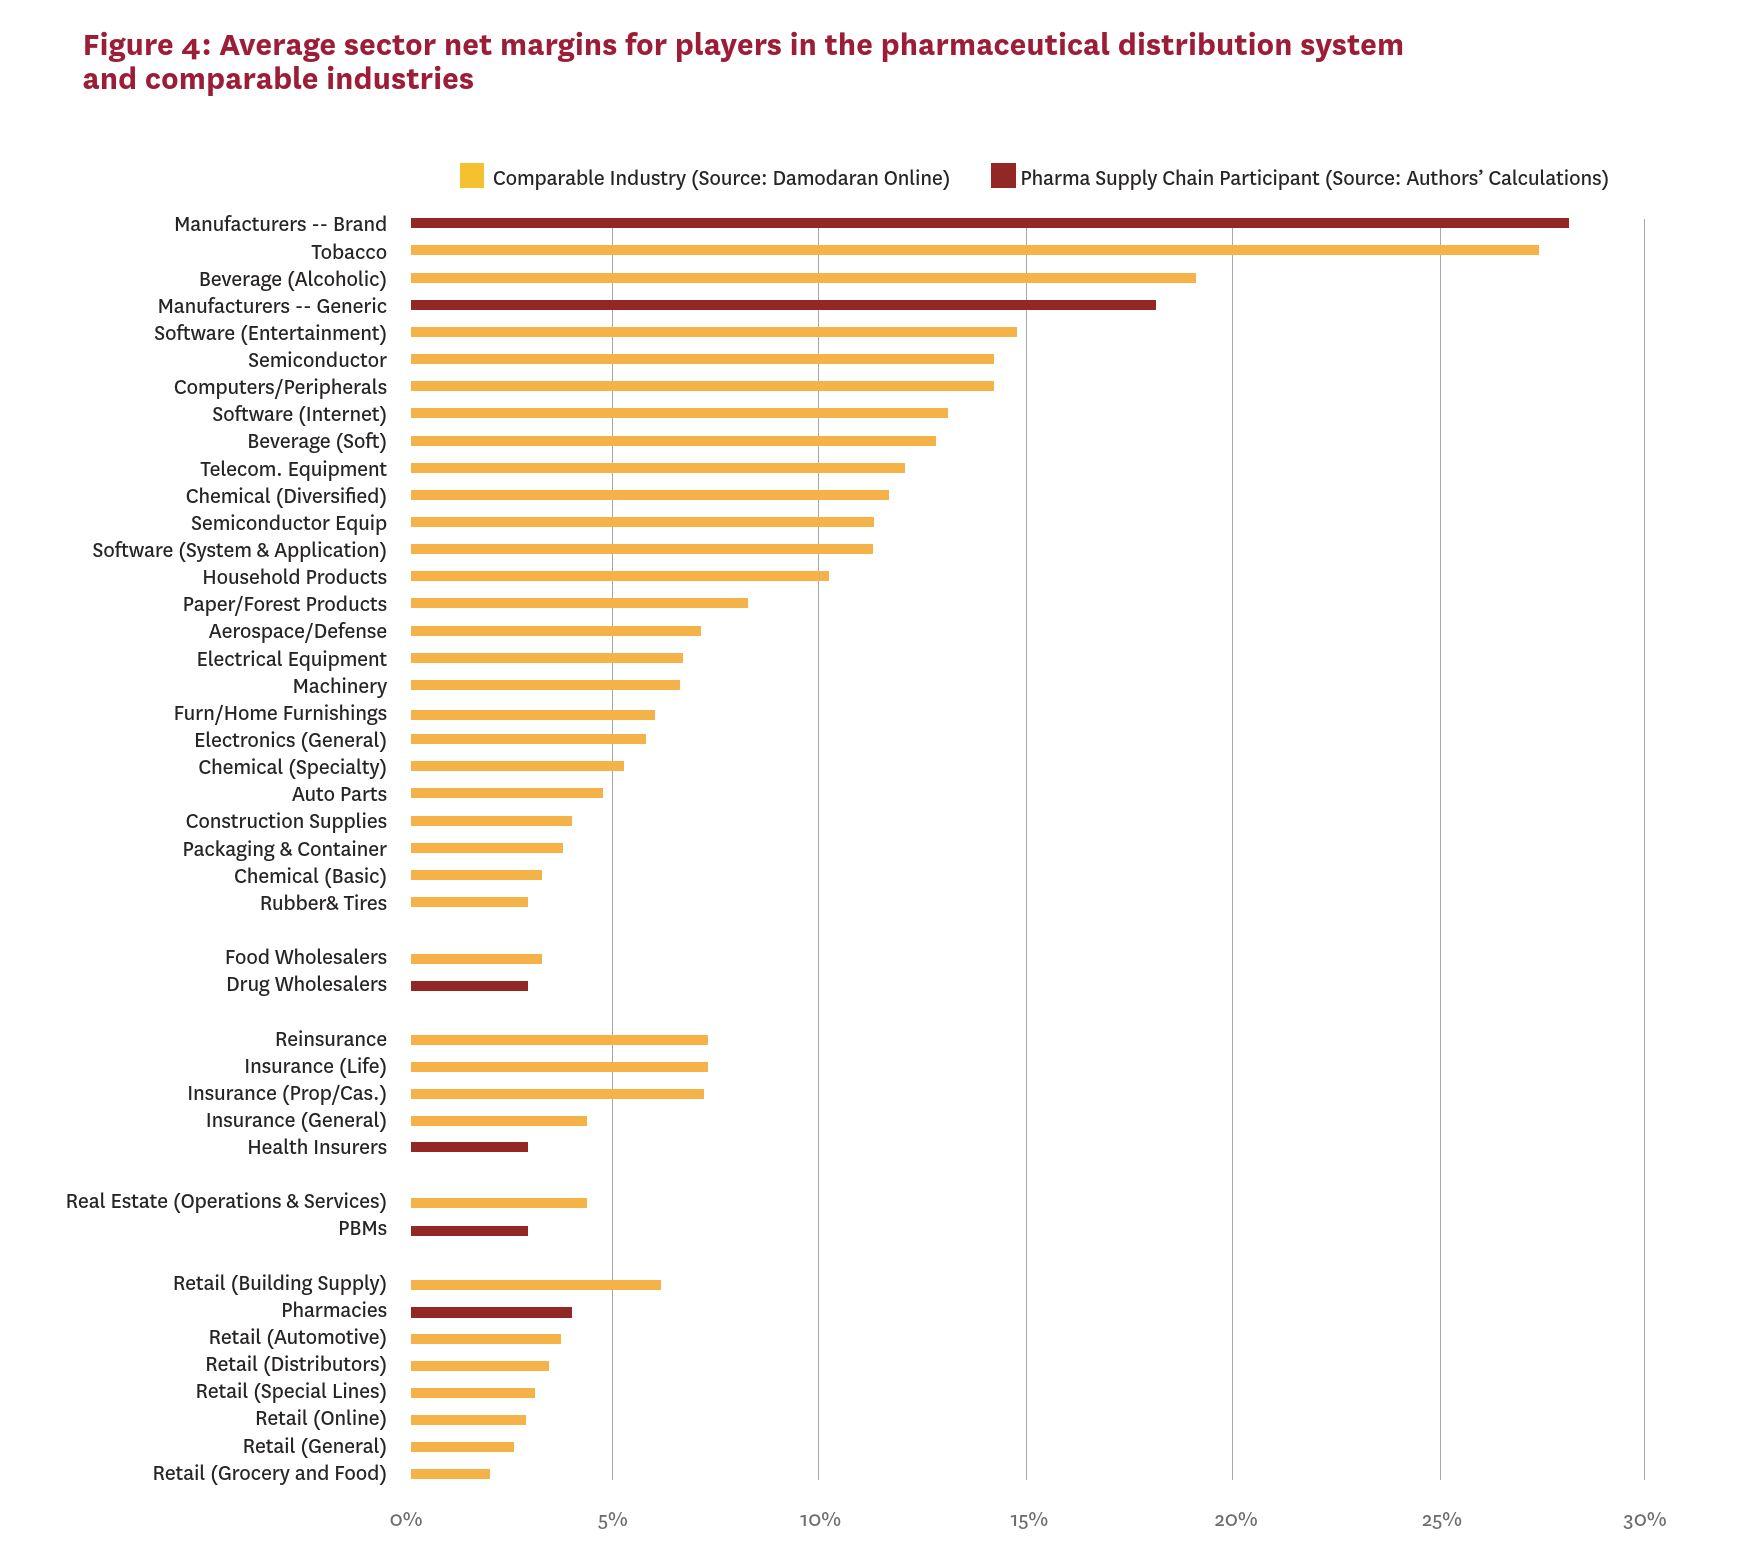
This figure, also from Sood et. al., shows the 2015 net profit margins — i.e., net profit as a % of sales — in various U.S. sectors. Brand pharmaceuticals lead the pack, with generic firms following not far behind.
-
November 5, 2021 at 1:35 pm #247090
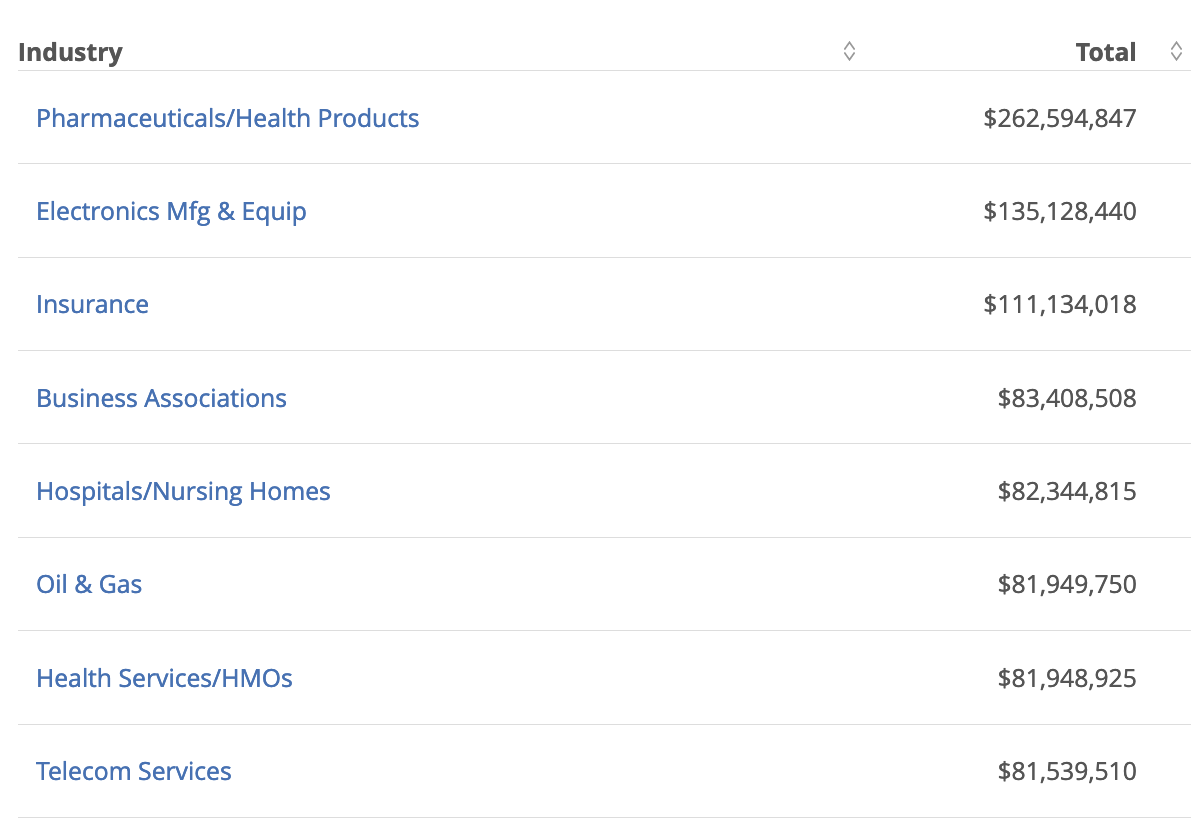
US Lobbying numbers for 2021 (Jan-Sept). Pharmaceuticals industry spends twice the second highest industry (Electronics).
https://www.opensecrets.org/federal-lobbying/industries
Attachments:
You must be logged in to view attached files. -
November 5, 2021 at 5:12 pm #247097
US Lobbying numbers for 2021 (Jan-Sept). Pharmaceuticals industry spends twice the second highest industry (Electronics).
Interesting data, Chris.
(Parenthetically, I think you mean the ‘pharmaceutical business’, not the ‘pharmaceutical industry’.)
-
November 6, 2021 at 6:38 am #247102
In a new and off-the-cuff post I talk briefly about David Harvey’s chat about markets in a short Youtube video of his. That led me to this.
“Braudel argued that capitalists have typically been monopolists and not, as is usually assumed, entrepreneurs operating in competitive markets. He argued that capitalists did not specialize and did not use free markets, thus diverging from both liberal (Adam Smith) and Marxian interpretations. In Braudel’s view, the state in capitalist countries has served as a guarantor of monopolists rather than a protector of competition, as it is usually portrayed. He asserted that capitalists have had power and cunning on their side as they have arrayed themselves against the majority of the population.” – Wikipedia.
It seems Braudel makes a lot of sense. (I have not read his works, I admit.) “The state in capitalist countries has served as a guarantor of monopolists rather than a protector of competition.” This certainly resonates today. It sums up the entire case at the top end (monopoly end) of the “market”. This has been true at least since the early days of the East India Company. It is interesting to note that the American Flag (stars and stripes design) is derived from the East India Company ensign (the stripes). A “Freudian semiotician” would argue that the plagiarism is no accident. He wouldn’t even need to be Freudian really. The idea of a business monopoly over a “new” continent must surely have come from the existing idea and reality of a business monopoly over an old continent. The American Whigs or oligarchs now doubt saw themselves as the New World Company, essentially. The royal prerogative to the New World monopoly simply had to be done away with first by the declaration of the independence of the oligarchs. The US remains true its origins in the Braudelian sense as the state continues to serve as guarantor for the monopolists.
https://en.wikipedia.org/wiki/Flag_of_the_East_India_Company
What we see today is pretty much the total protection of the top monopolists by the state. Sometimes an oligarch goes too far (somehow), upsets the government-oligarchy cartel and gets disciplined or at least questioned. Jack Ma in China and Mark Zuckerberg in the US. Of course, Zuckerberg is in a triopoly situation (so far as I can tell) and that leaves one vulnerable to two-on-one on lobbying.
A feature of modern capitalism (It’s a feature not a bug!) is that poor people who get a dollar must have it stripped back off them. But rich people and businesses who get billions for nothing are permitted to keep it. Crony capitalism is flagrantly obvious now. In Australia we had the “Robodebt” welfare imbroglio.
“The Robodebt scheme, formally Online Compliance Intervention (OCI), was an unlawful method of automated debt assessment and recovery employed by Services Australia as part of its Centrelink (welfare) payment compliance program.” – Wikipedia.
Welfare recipients and their advocates had to fight tooth and nail to have incorrectly calculated welfare debts overturned.
Now we have had the Jobkeeper overpayments imbroglio. The employers got billions to keep workers on the payroll when they were locked down at home due to the COVID-19 pandemic. However, quite a lot of businesses made more money, not less, during the lock-down. They failed to show losses (a condition of the Jobkeeper scheme) but the government has turned a blind eye and not demanded repayment. Thirteen billion dollars are involved. Australia is a small economy, smaller than Canada’s. This is a lot of free money to business. This is how modern capitalism works. You get granted a monopoly or you get lots of free money.. if you are a business. This is how it works. It’s no mystery. Nothing to do with markets at all.
- This reply was modified 4 years, 7 months ago by Rowan Pryor.
-
-
AuthorReplies
- You must be logged in to reply to this topic.