- This topic has 10 replies, 4 voices, and was last updated February 9, 2022 at 10:07 am by CM.
-
CreatorTopic
-
February 7, 2022 at 11:44 am #247739
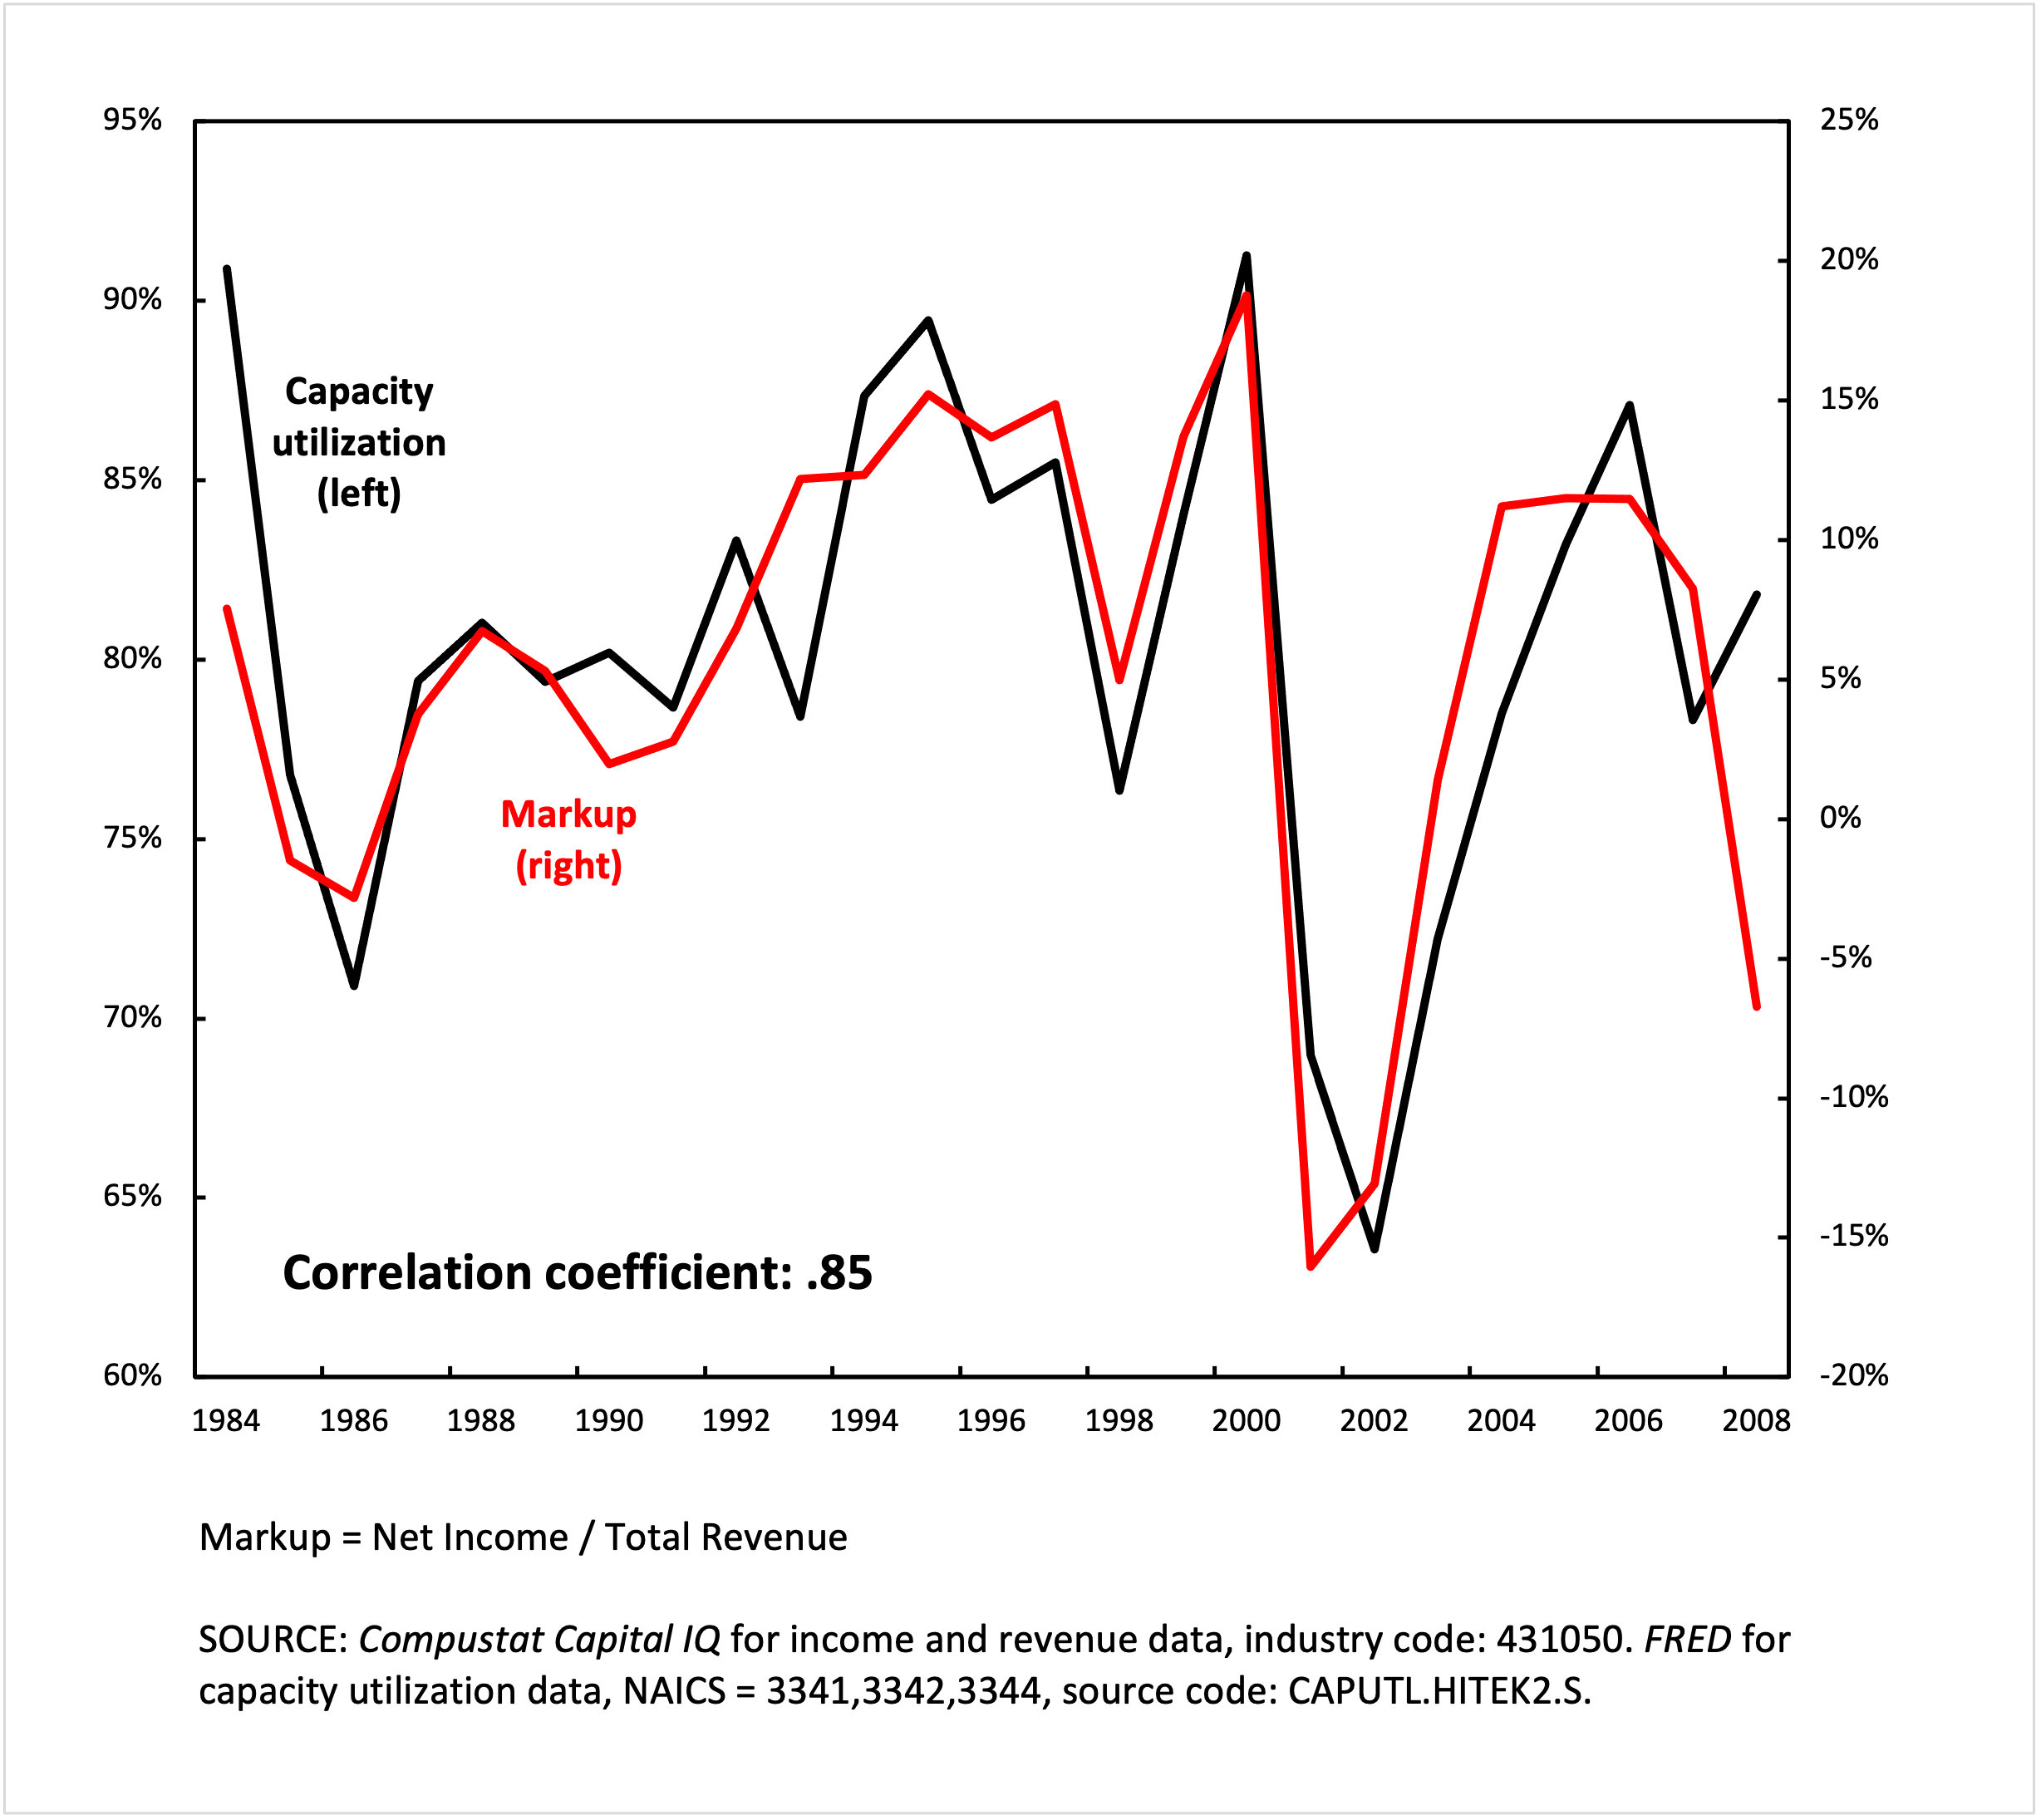
Is there any obvious reason why, within a given business sector, the average markup should correlate closely with capacity utilization?
Below is a chart showing the capacity utilization and the average markup (income/revenue) of the US semiconductor business. Between 1984 and 2007, the two measures are tightly correlated.
Some of my guesses:
1. If markup is a rough approximation of price over cost, perhaps due to the high overhead costs of fabrication, costs are lowest when capacity utilization is highest, making markup high when capacity utilization is high
2. Semiconductor firms increase production when semiconductor prices are high, decrease when semiconductor prices are low.
Thoughts?
Attachments:
You must be logged in to view attached files. -
CreatorTopic
-
AuthorReplies
-
-
February 7, 2022 at 2:14 pm #247749
Chris,
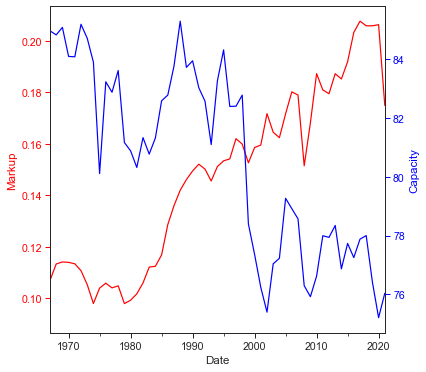
This is a creative approach to thinking about sabotage, or at least a measurable proxy of it. Curiously I made this for Capacity Utilization: Manufacturing: Non-Durable Goods: Food, Beverage, and Tobacco (NAICS = 311,2):
A word of warning to filtering by NAICS. The codes work by digit, rather than by number. Thus, the codes in bold are in the same higher-order classification:
311
311
511
611
3111
31111
31112If you sort NAICS by number, you can see where it is hard to group everything together. I know of an easy Python fix, so let me know if you need help.
- This reply was modified 4 years, 5 months ago by jmc.
-
February 7, 2022 at 9:12 pm #247753
Thanks!
Your comment made me realize I cited the wrong source for this particular chart. The capacity utilization data is from a discontinued series from the FRED website, and the NAICS codes cited are for computers, communications equipment and semiconductors. The semiconductors series was discontinued after 2015, and I was using the latter combination as a proxy for 2015-2020 (not shown in this chart).
This is very good to know as I will be working more with NAICS in the future, and had no idea how the codes worked. I will definitely get in touch if I have a question!
Your chart is interesting because markup is going up as capacity utilization drops, possibly indicating a depth strategy of accumulation at work. Here’s what the rest of the time-series for semiconductors looks like:
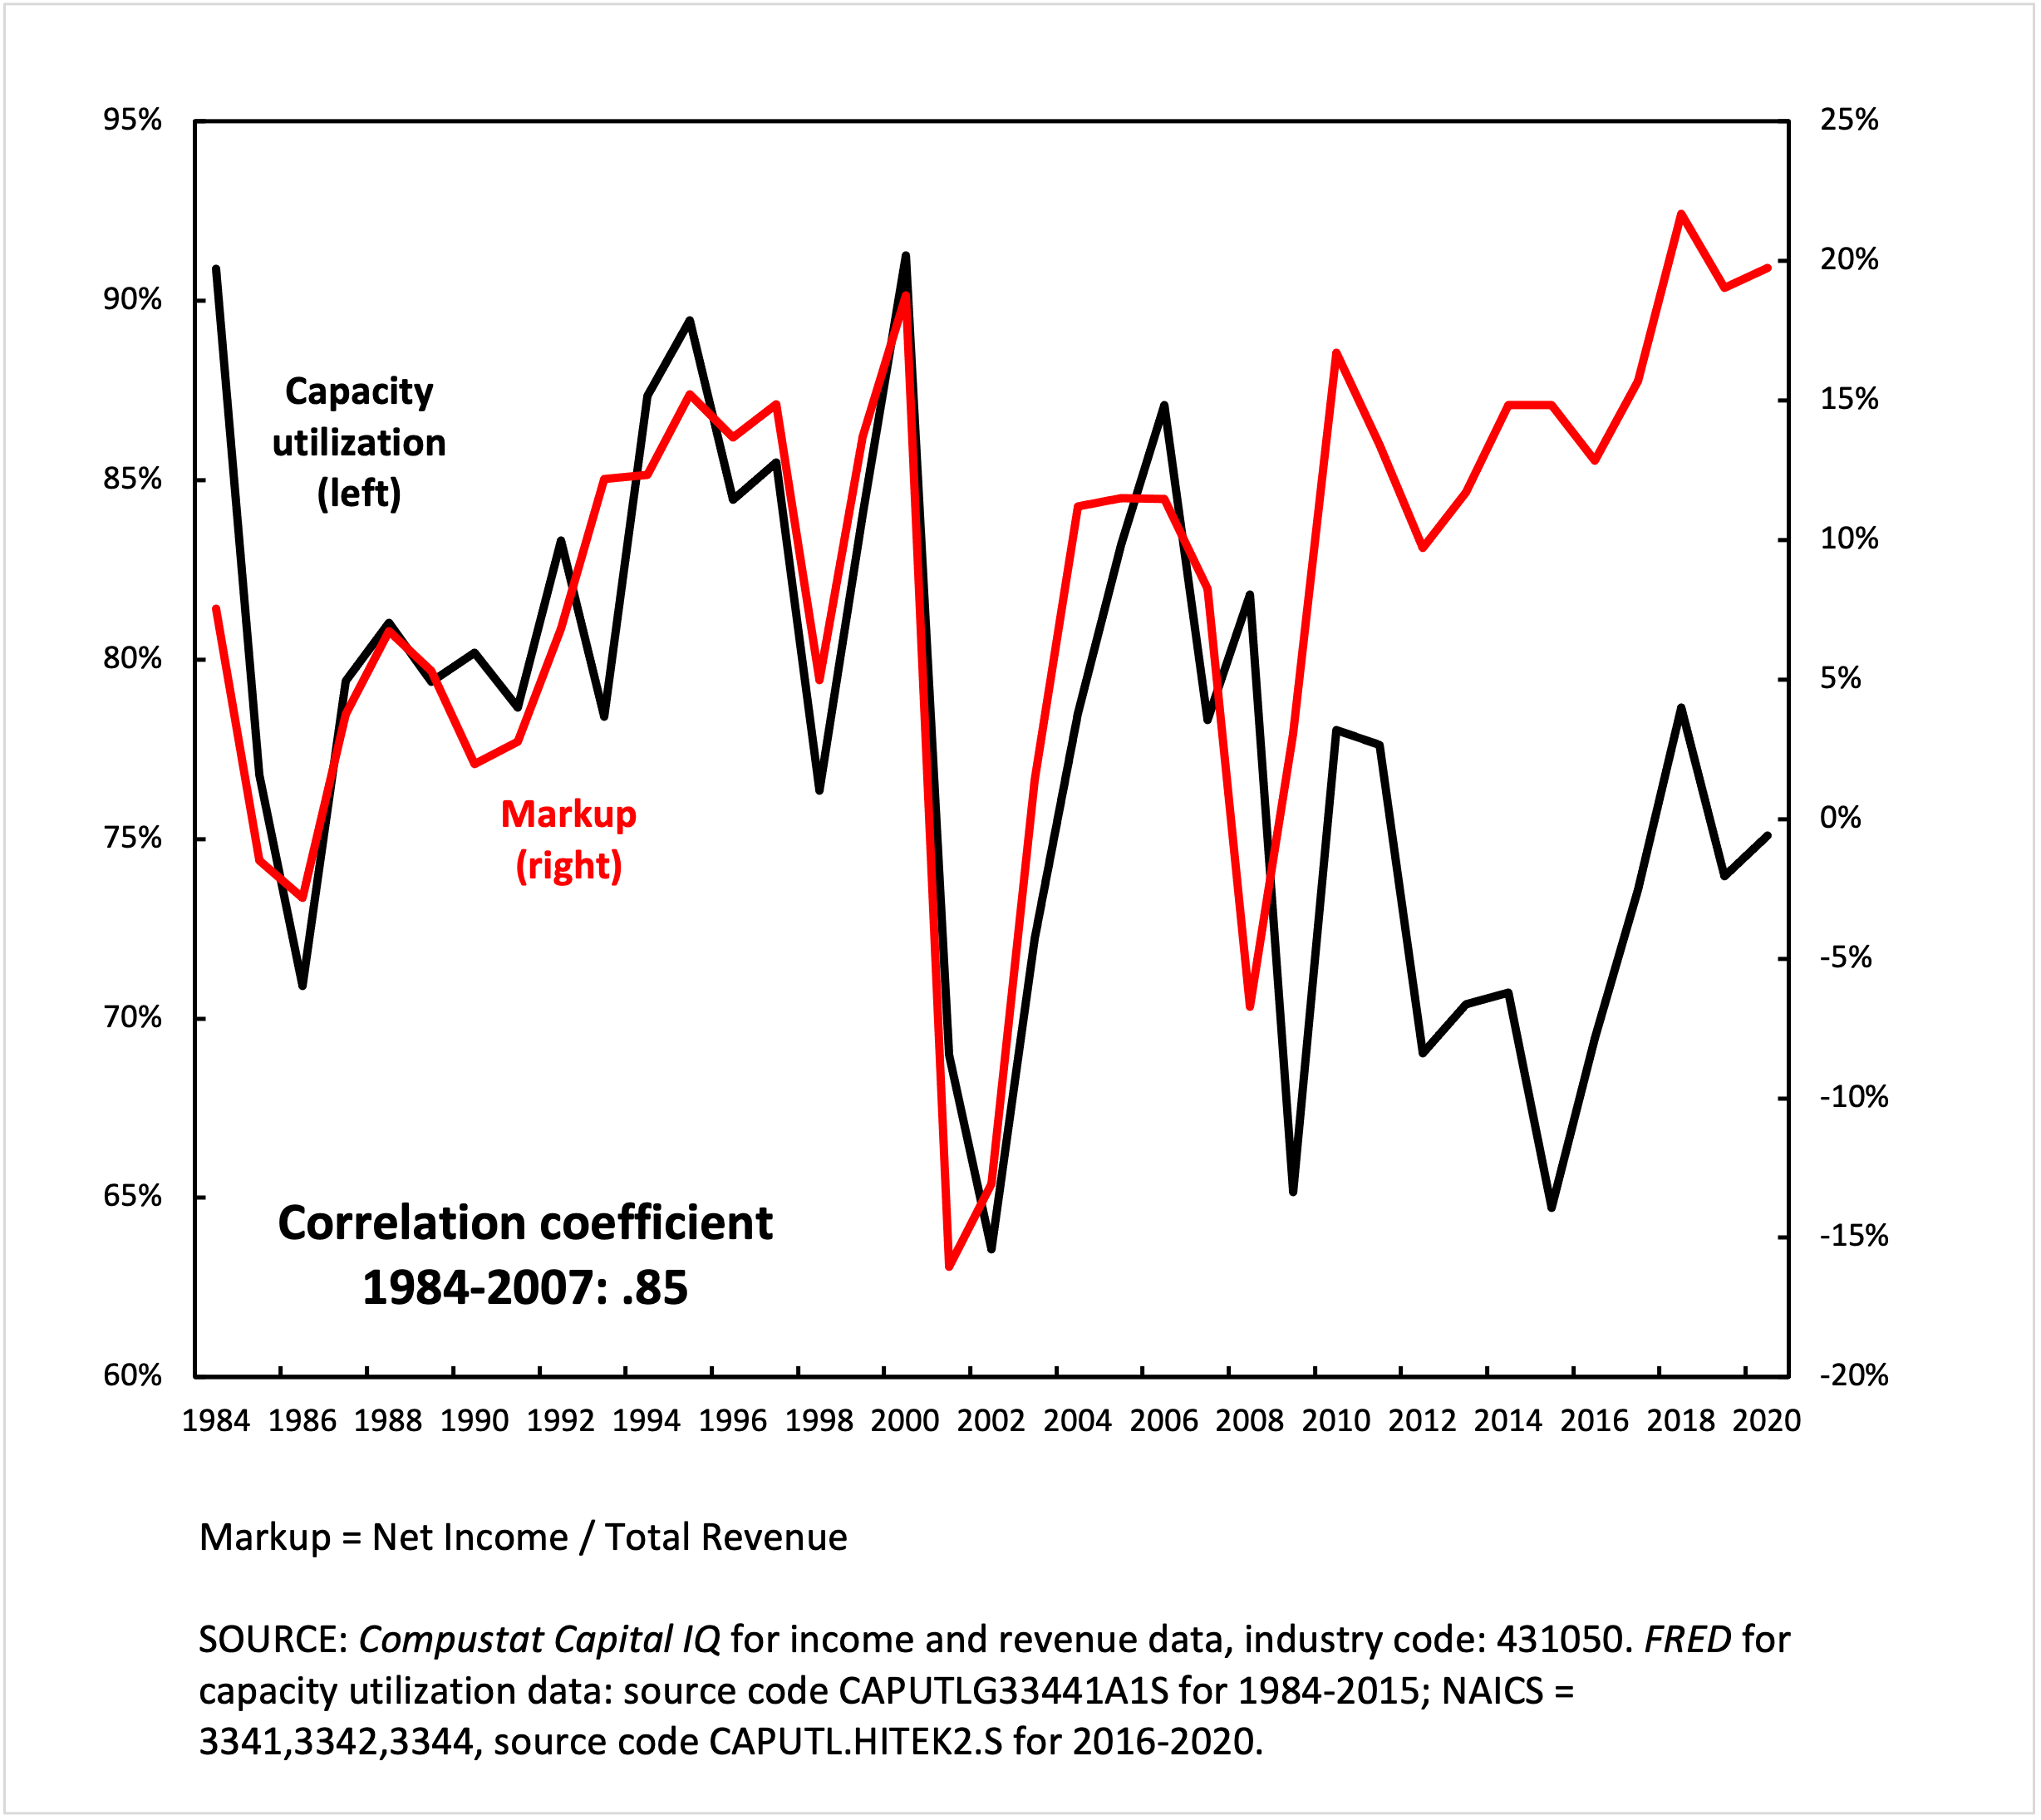
As you can see, after 2008/09 something similar happens.
-
February 8, 2022 at 12:25 pm #247754
I think the correlation is due to accounting rules.
Regardless of utilization, running a fab involves fixed costs and variable costs (together, the cost of goods sold) and depreciation (which hits the operating margin, not the gross margin). When you budget for 85% utilization, your fixed costs are equal to what it costs to run the fab at 85% utilization. So, if you are actually running at 65% utilization, your fixed costs are spread out over 20% fewer units, decreasing the gross margin. Depreciation does not depend on utilization, so you are spreading 100% of depreciation over 65% of the maximum number of units, reducing your operating margins.
When I was at Intel (20 years ago), I heard that utilization below a certain threshold can result in the acceleration of depreciation that would further squeeze margins in the quarter the write down occurs, but I can’t recall if that kind of write down is triggered by a single quarter or multiple quarters below the threshold. I think this kind of accounting rule depends in part on utilization history. A new fab, for example, can’t be expected to immediately be at 85% utilization.
See this risk factor from Intel’s most recent 10-K, which discusses the accounting consequences of underutilization:
Due to the complexity of our manufacturing operations, we are not always able to timely respond to fluctuations in demand and we may incur significant charges and costs. Because we own and operate high-tech fabrication facilities, our operations have high costs that are fixed or difficult to reduce in the short term, including our costs related to utilization of existing facilities, facility construction and equipment, R&D, and the employment and training of a highly skilled workforce. To the extent product demand decreases or we fail to forecast demand accurately, we could be required to write off inventory or record excess capacity charges, which would lower our gross margin. To the extent the demand decrease is prolonged, our manufacturing or assembly and test capacity could be underutilized, and we may be required to write down our long-lived assets, which would increase our expenses. We may also be required to shorten the useful lives of under-used facilities and equipment and accelerate depreciation. As we make substantial investments in increasing our manufacturing capacity as part of our IDM 2.0 strategy, these underutilization risks may be heightened. Conversely, at times demand increases or we fail to forecast accurately or produce the mix of products demanded. To the extent we are unable to add capacity or increase production fast enough, we are at times required to make production decisions and/or are unable to fully meet market demand, which can result in a loss of revenue opportunities or market share, legal claims, and/or damage to customer relationships.
-
February 8, 2022 at 5:47 pm #247755
Thanks Scot,
You articulated much more clearly one of my guesses, namely that high fixed costs of fabs eat into operating margins when production is slow. But there are still at least two puzzles for me. First, why such a tight correlation? I’ve looked at a few other sectors and so far I haven’t found much if any correlation between these two variables. Second, if its just an accounting issue, what happened after 2007?
-
-
February 8, 2022 at 7:00 pm #247756
It is worth noting that in most cases ‘capacity’ measures refer to the maximum volume that businesses think they can produce profitably. In a minority of cases, when business surveys are not available, the statisticians simply connect production peaks and interpret the interpolation (or extrapolation) as capacity.
These methods mean that published capacity is not the technical maximum, but the business maximum — either in the mind of managers, or based on the interpolated/extrapolated history of business production.
-
February 9, 2022 at 10:06 am #247760
Thanks Jonathan,
I was dimly aware of this fact, but maybe not of its full implications.
It was my understanding that the Federal Reserve constructed a capacity index out of some weighted combination of “preferred capacity rate” (business maximum) and “practical capacity rate” (ostensibly closer to a measure of pure technical capacity). If the capacity utilization rate represented only the business maximum, it would make sense that markup and capacity utilization were in close alignment. If the business maximum is the simply most profitable utilization, it is conceptually equivalent to the utilization at which the highest markup is reached, and so the two would rise and fall together.
This indicates then, possibly, that the “business maximum” is more heavily represented in the capacity utilization index for the semiconductor business than any practical or technical measure (at least during 1984-2007). If this is the case, it could be that the divergence after 2007 reflects, as Scot said, the increasing relevance of fabless firms, for which the capacity utilization rate does not apply. If the fabless firms have a higher markup on average, it could produce the divergence in the chart.
-
-
February 8, 2022 at 7:31 pm #247757
Thanks Scot, You articulated much more clearly one of my guesses, namely that high fixed costs of fabs eat into operating margins when production is slow. But there are still at least two puzzles for me. First, why such a tight correlation? I’ve looked at a few other sectors and so far I haven’t found much if any correlation between these two variables. Second, if its just an accounting issue, what happened after 2007?
Interesting questions. I would argue there are two primary factors driving the correlation (or lack thereof): (1) the rise of the fabless and fab-lite semiconductor business models; and (2) the shift in the semiconductor industry’s focus from personal computing to wireless, especially smart phones.
First, fabless companies do not bear the risk of underutilization, their foundry partners do. Similarly, fab-lite companies have reduced risk and typically manage that by only keeping fabs they can run at near 100% capacity (at Spansion in the early 2010s, we averaged 95% utilization in our legacy fab). In the 80s and 90s, most large semiconductor companies were IDMs (integrated device manufacturers) who made all their own chips (or even provided foundry services), and they did not use foundries. This changed over time, and today only 2 of the top 10 semiconductor companies make all their own chips (5 are fabless, 1 is fab-lite, and two are IDMs who are significant foundry customers).
Second, as PCs became less important and wireless/mobile became more important, many fabless companies became industry leaders, and even large IDMs like Intel were forced to make competing chips in foundries, often because to compete in the new area they acquired companies that were fabless.
So, when most semiconductor companies made almost everything they sold, you had a tight correlation. As the semiconductor industry increasingly outsourced manufacturing to foundries (due to a combination of the economics of fabs and a change in product mix), the correlation disappeared.
Fabless and Fab-Lite
TSMC, which currently has over 50% of the foundry market, was founded in 1987 to provide contract semiconductor manufacturing services. Originally, most of their customers were companies like IBM, GM, etc. who designed their own chips but didn’t want or have the ability to make the chips themselves. Over time, especially with the success of PC in the early 90s, you saw a lot of specialty chip companies adopting a fabless model. Nvidia, for example, was founded in the early 1990s by former engineers at Sun Microsystems who wanted to make a single-chip multimedia (graphics, video and audio) chip for PCs and gaming consoles. (They could never get the multimedia chip to work, so they stuck with just the graphics, which is what the founders really knew how to do well.)
Starting around 2000 a lot of IDMs decided to stop building new fabs and/or to divest themselves of existing fabs to go fabless or fab-lite. These decisions were typically announced around the time companies had to decide whether to invest in the next node of lithography. A few dropped out at the 90nm node, more at the 65nm node, and a lot more at 45nm. AMD, whose original CEO claimed “Real men have fabs,” went fabless in 2008-9 (near the 45nm node), spinning out Global Foundries and letting it invest in 32nm instead. A prior AMD spinout, Spansion, which I later worked at, went fab-lite in 2010 (we had a fully depreciated fab in Austin, TX, doing primarily legacy stuff at >90% capacity, and all the new stuff went through foundries in Taiwan and China).
Today, even the largest IDMs are big foundry customers. Indeed, Intel, who was number 2 in semiconductor sales in 2021, is TSMC’s largest customer (and it has its own foundry business, too).
Of the top 10 semi companies in 2021, 5 are fabless (Qualcomm, Nvidia, AMD, MediaTek and Broadcom), 1 is fab-lite (TI stopped making their own chips at 45nm) and 2 are big foundry customers (Intel and Samsung). Only the pure-play memory (DRAM and flash) makers like Micron and SK Hynix (who round out the top 10) remain IDMs, and that is only because they don’t have any margin to share with foundries.
The move towards fabless has been accompanied by a lot of industry consolidation, as well. Shortly after I left Spansion in 2014 (after we acquired a division of Fujitsu), Cypress acquired it, and last year Infineon acquired Cypress. So you have fewer companies selling chips, and more chips being made by foundries.
Shift from PC to Wireless
In the 1980s and 1990s, the PC drove semiconductor sales, especially for microprocessors and DRAM (system memory). Flash memory was just being introduced in the 1980s (I was at Intel as a co-op engineer in 1987 when they taped out their first NOR flash product), and did not find much use in the PC until recently (SSDs were being invented in the early 1990s, but did not see production until the 2010s).
Everything started to shift in the mid-2000s with the rise of affordable cellular phones and other mobile devices. Then Apple introduced the iPhone in 2007 and the iPad in 2010. By then, PC industry growth had slowed (if not started dropping), so wireless became the semiconductor industry’s driver, changing the pecking order of the industry as a whole, with many of the most prominent fabless companies rising to the top 10 in sales (what had been specialty products like baseband processors were now mainstream, high volume runners) and a lot of old line top semiconductor companies (like Toshiba, Fujitsu and Sony) focusing on internal customers, dropping out of the top 10 (or even top 20).
-
February 8, 2022 at 8:09 pm #247759
Here is a link to what appears to be a good resource on the rise of the semiconductor foundry and fabless business model.
-
February 9, 2022 at 10:07 am #247761
Thanks! It’s definitely on my reading list.
-
-
-
February 8, 2022 at 7:48 pm #247758
It is worth noting that in most cases ‘capacity’ measures refer to the maximum volume that businesses think they can produce profitably. In a minority of cases, when business surveys are not available, the statisticians simply connect production peaks and interpret the interpolation (or extrapolation) as capacity. These methods mean that published capacity is not the technical maximum, but the business maximum — either in the mind of managers, or based on the interpolated/extrapolated history of business production.
That’s right. For example, large semiconductor companies like Intel and Samsung typically target a minimum of around 85% fab utilization, assuming 15% downtime for maintenance, etc.. One of the reasons why these companies are starting to offer foundry services is they cannot reach 85% utilization of the new fabs they are building, if they only make their own products.
-
-
AuthorReplies
- You must be logged in to reply to this topic.