- This topic has 2 replies, 2 voices, and was last updated February 2, 2021 at 3:33 pm by .
-
Topic
-
Dominant Capital is Much More Powerful Than You Think
by Shimshon Bichler and Jonathan Nitzan [1]
(http://bnarchives.yorku.ca/671/)
1. Capital as power, differential accumulation and dominant capital
According to the theory of capital as power (CasP), capitalists and corporations are driven not to maximize profit, but to ‘beat the average’. Their yardstick is not an unmeasurable theoretical abstraction, but the readily observable performance of others. Their aim is not to increase their ‘material gain’, counted in fictitious utils or socially necessary abstract labour time, but to earn more money than everyone else. And the reason, we argue, has to do with power. In capitalism, capital is power, and to accumulate it differentially – i.e., relative to others – is to fortify and augment one’s organized power over others.
Following Kepler’s modern notion of force, CasP sees capitalized power not as a stand-alone qualitative entity, but as a quantitative relationship between entities.
First, capitalized power is not absolute, but relational. It’s not a ‘battery’ or ‘energy’ that some entities possess and use to impose their will over others. Instead, it is the actual structure of differential relationships among capitalist owners and organizations as well as between those owners and organization and others who are subjugated to them and resist their domination.
Second, capitalized power is a pure quantity. The actual institutions, structures and processes of capitalist power – from production, to finance, to government, religion, ideology, international relations, crime and what not – vary greatly. They are qualitatively different from each other and, in that sense, hard if not impossible to compare and aggregate. But in capitalism, these qualitative differences all get reduced to pure numbers: they are converted to the universal quantities of differential profit, investors’ hype and risk perceptions – and from there they get discounted to the universal quantity of differential capitalization.
The ongoing quest to beat the average and accumulate differentially goes hand in hand with CasP’s notion of ‘dominant capital’. All capitalists try to beat the average, but only some succeed and only a minority succeeds systematically, at least over a certain period. In time, this minority percolates up the hierarchies of power to formulate the cluster we call dominant capital. This cluster comprises the largest government-backed corporate coalitions at the centre of any given sector, a particular society, a group of countries and, ultimate, the capitalist world as a whole. The constituent entities of dominant capital change over time – the Alphabets and Apples of today have substituted the U.S. Steels and AT&Ts of a century ago and will likely be replaced by others in the future. But topologically, as a ruling entity, dominant capital is ubiquitous. There is hardly a capitalist setting without it.
2. Aggregate concentration
How should we measure the power of dominant capital?
Economists, although seldom if ever referring to ‘dominant capital’, quantify the relative size of large firms by measuring their so-called aggregate concentration – namely, their combined share in a particular business total. The computation of this measure is straightforward. You start from the corporate universe in question – for example, all active corporations operating in the United States. You then calculate their aggregate size – that is, their total assets, total sales, total profit and so on, as the case may be. Next, you identify the dominant capital group in question – for instance, the top 100 or top 500 corporations in the United States – and compute their own total assets, sales or profit. Finally, you measure the share of total assets, sales or profit that is accounted for by dominant capital. And that’s it.
Figure 1 shows two measures of aggregate concentration for total U.S. net profit (expressed as five-year trailing averages). The bottom series shows the net profit share of the top 100 corporations, while the top one shows the same share for the top 500 corporations. The two groups of top firms are ranked annually by market capitalization. They comprise entities that are incorporated and listed in the United States and exclude foreign and unlisted firms.
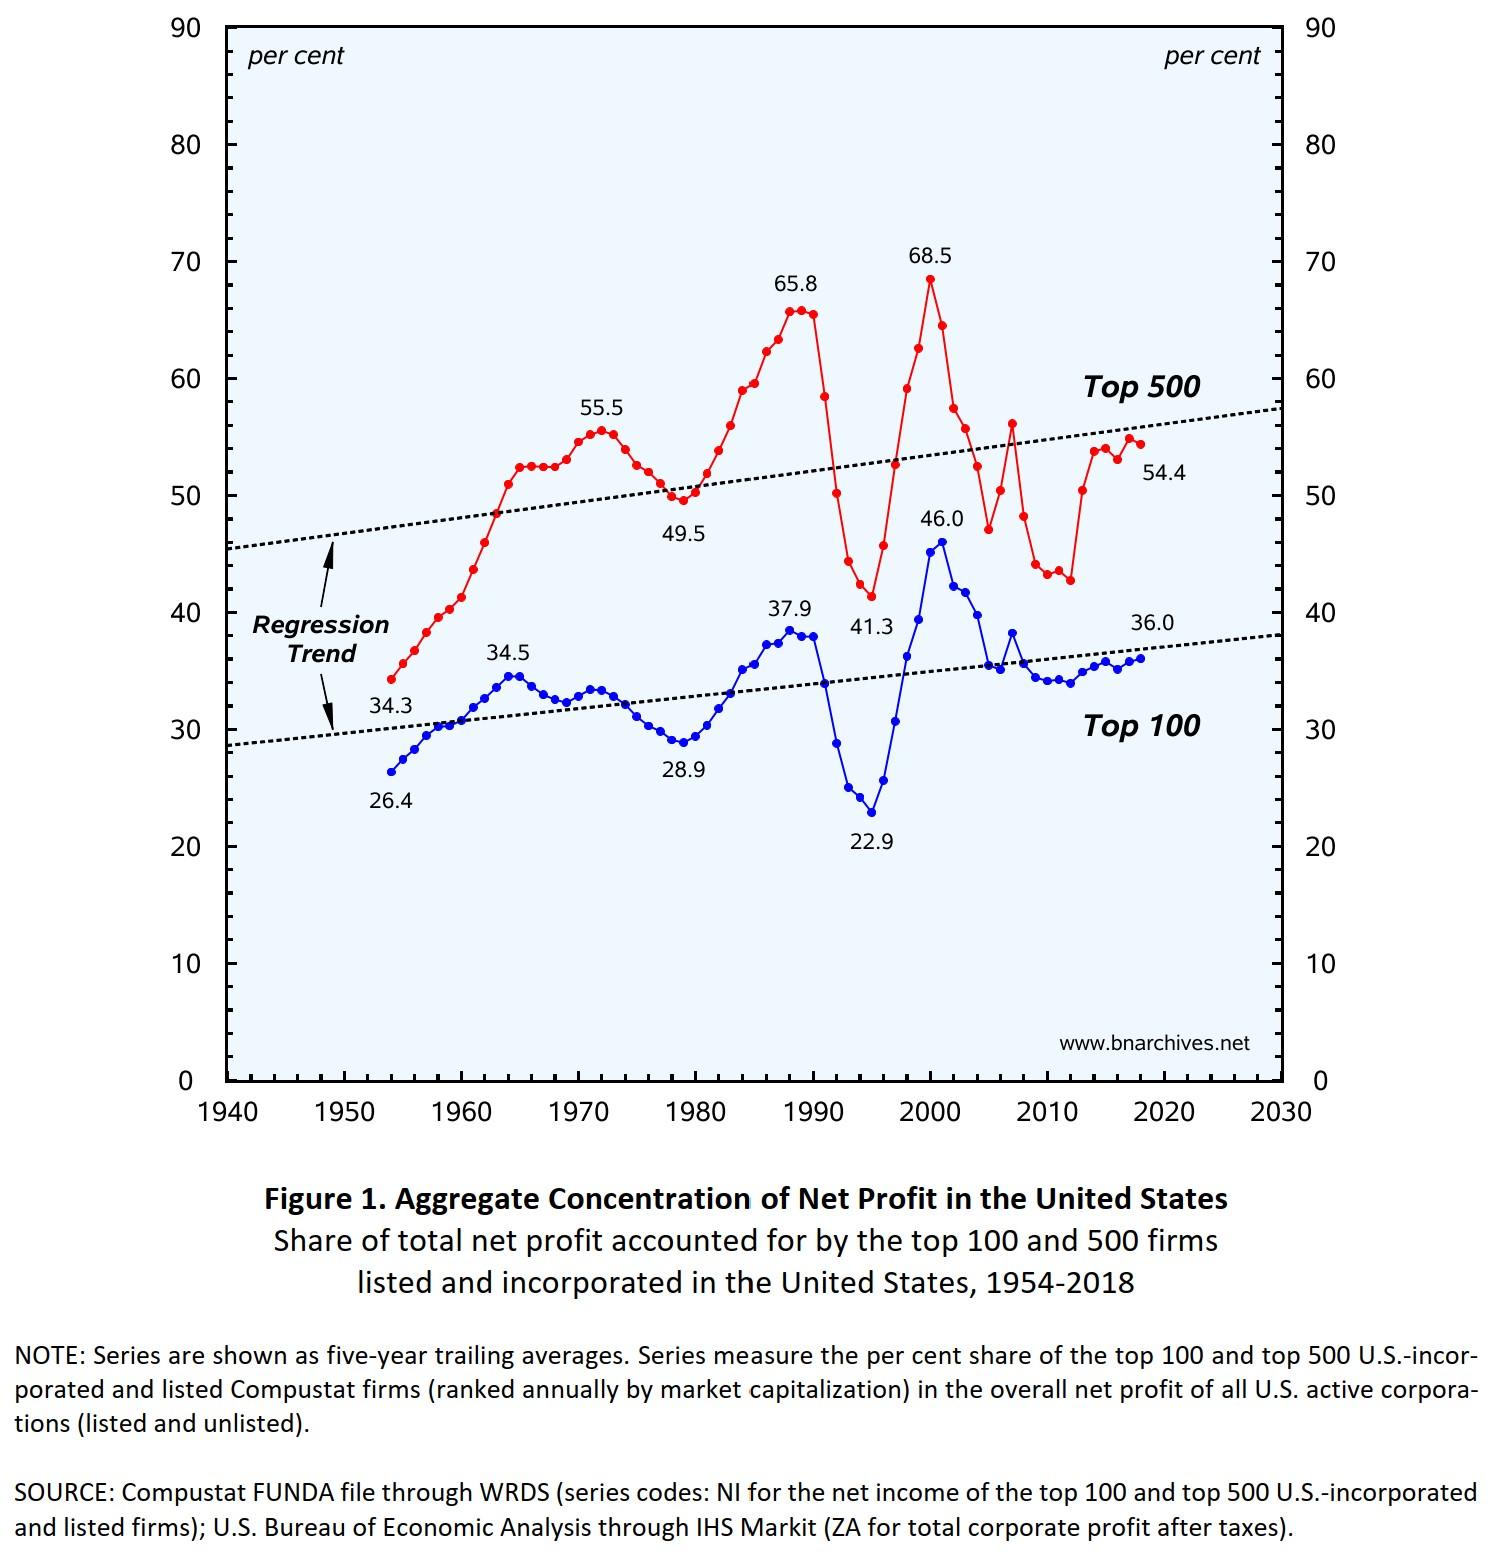
If we take the aggregate concentration of profit as our measure of power, we have to conclude that dominant capital is very powerful. Its top 100 corporations currently account for more than one-third of the country’s net profit, while its top 500 earn more than one-half. We must further conclude that this power has risen over time (note the regression uptrends). Compared to the early 1950s, the top 100 firms have seen their size rise by over one-third, while the top 500 by nearly two-thirds. Finally, based on its dramatic fluctuations, we need to infer that the rise of this power has been rather erratic.
But for all the insight they offer, measures of aggregate concentration have one serious shortcoming: they tend to underestimate the power of dominant capital and its temporal growth – by a lot.
3. The trouble with aggregate concentration
The difficulty starts with the definition and can be explained with basic algebra. Let’s use the letter (s) to denote the average size of a dominant capital firm (in our case here, this will be the average net profit, in dollars, earned by a ‘typical’ dominant capital firm). Similarly, let’s use (n) to count the number of dominant capital firms (in this case, the number will be 100 or 500, depending on the group we focus on). Next, let’s have (S) stand for the average size of a firm in the corporate universe (which, in our case, will be the average net profit per corporation, in dollars). Finally, we’ll use (N) to denote the number of firms in the corporate universe (in this case, the total number of active corporations in the United States). Using these basic notations, we can express aggregate concentration with Equation 1, such that:
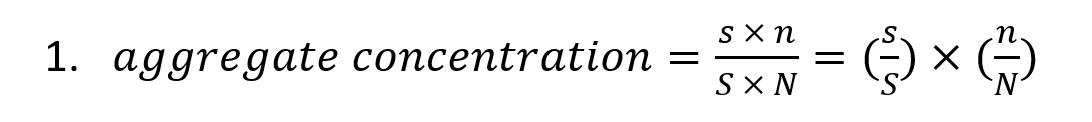
According to the equation, the rate of aggregate concentration depends on two distinct ratios: (1) the ‘size ratio’ (s/S), which measures the differential magnitude of dominant capital; and (2) the ‘number ratio’ (n/N), which compares the number of dominant capital firms to the total number of firms.
And here lies the problem: over time, these two ratios – the size ratio (s/S) and the number ratio (n/N) – trend in opposite directions.
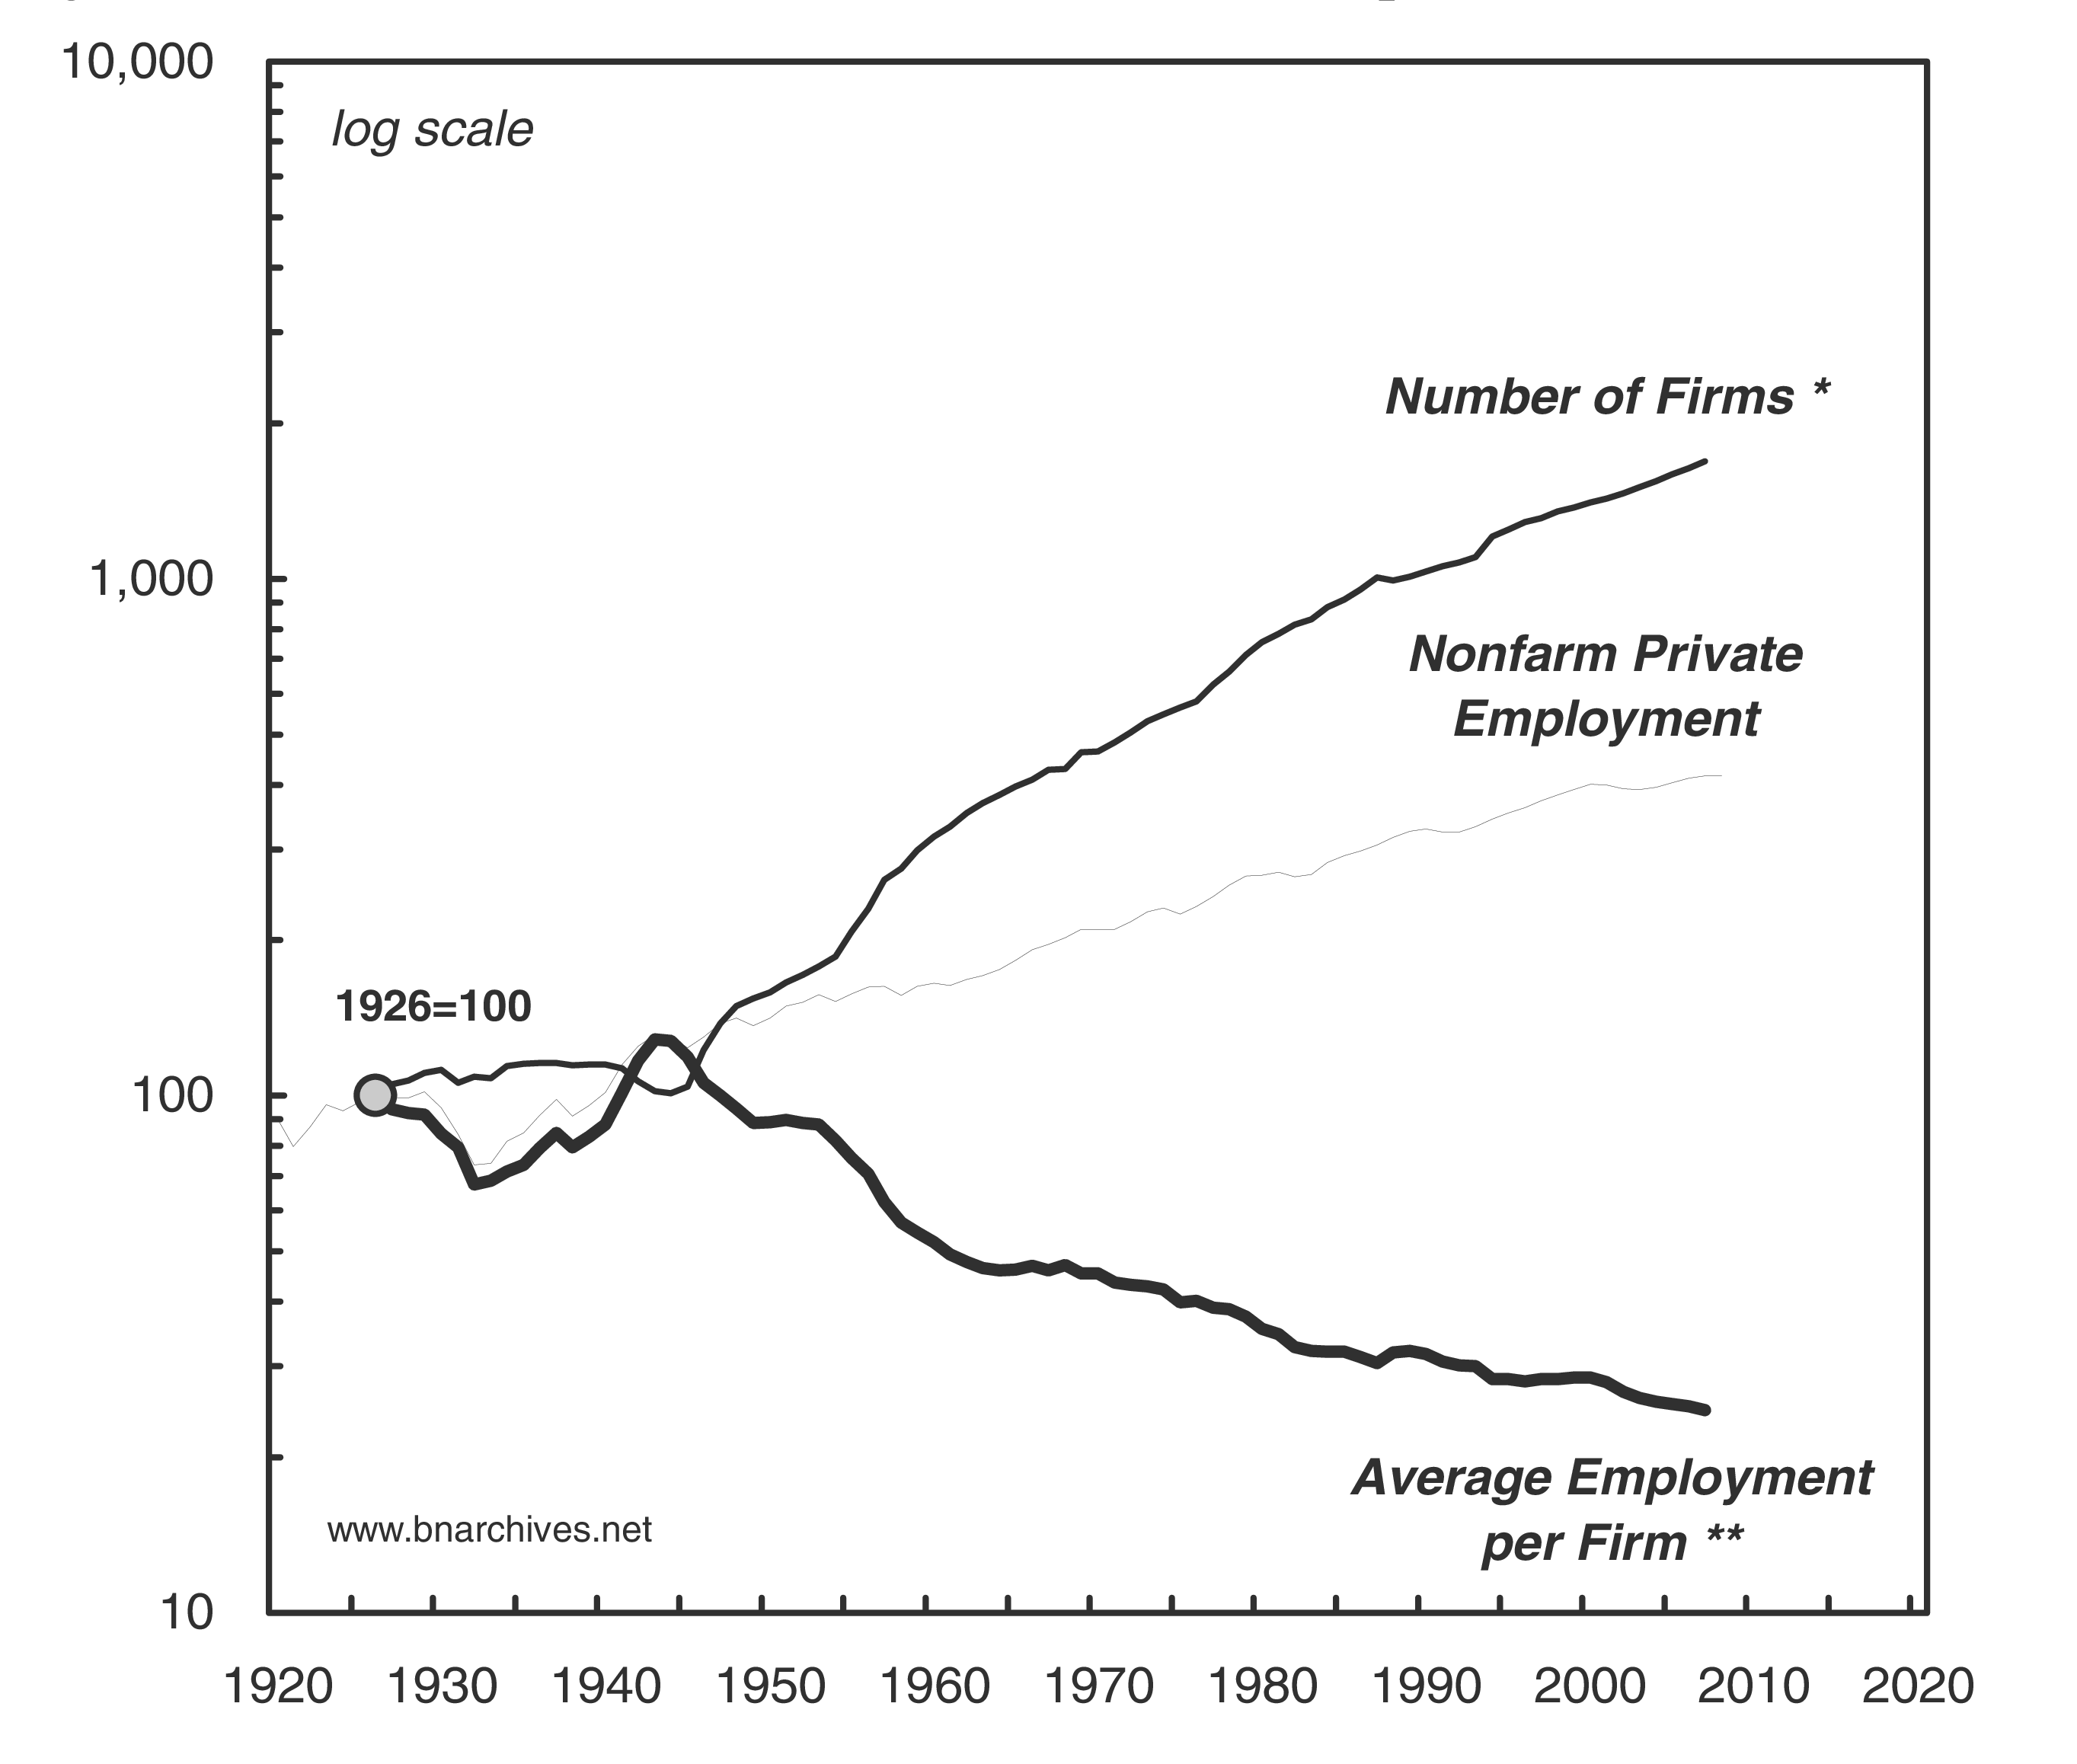
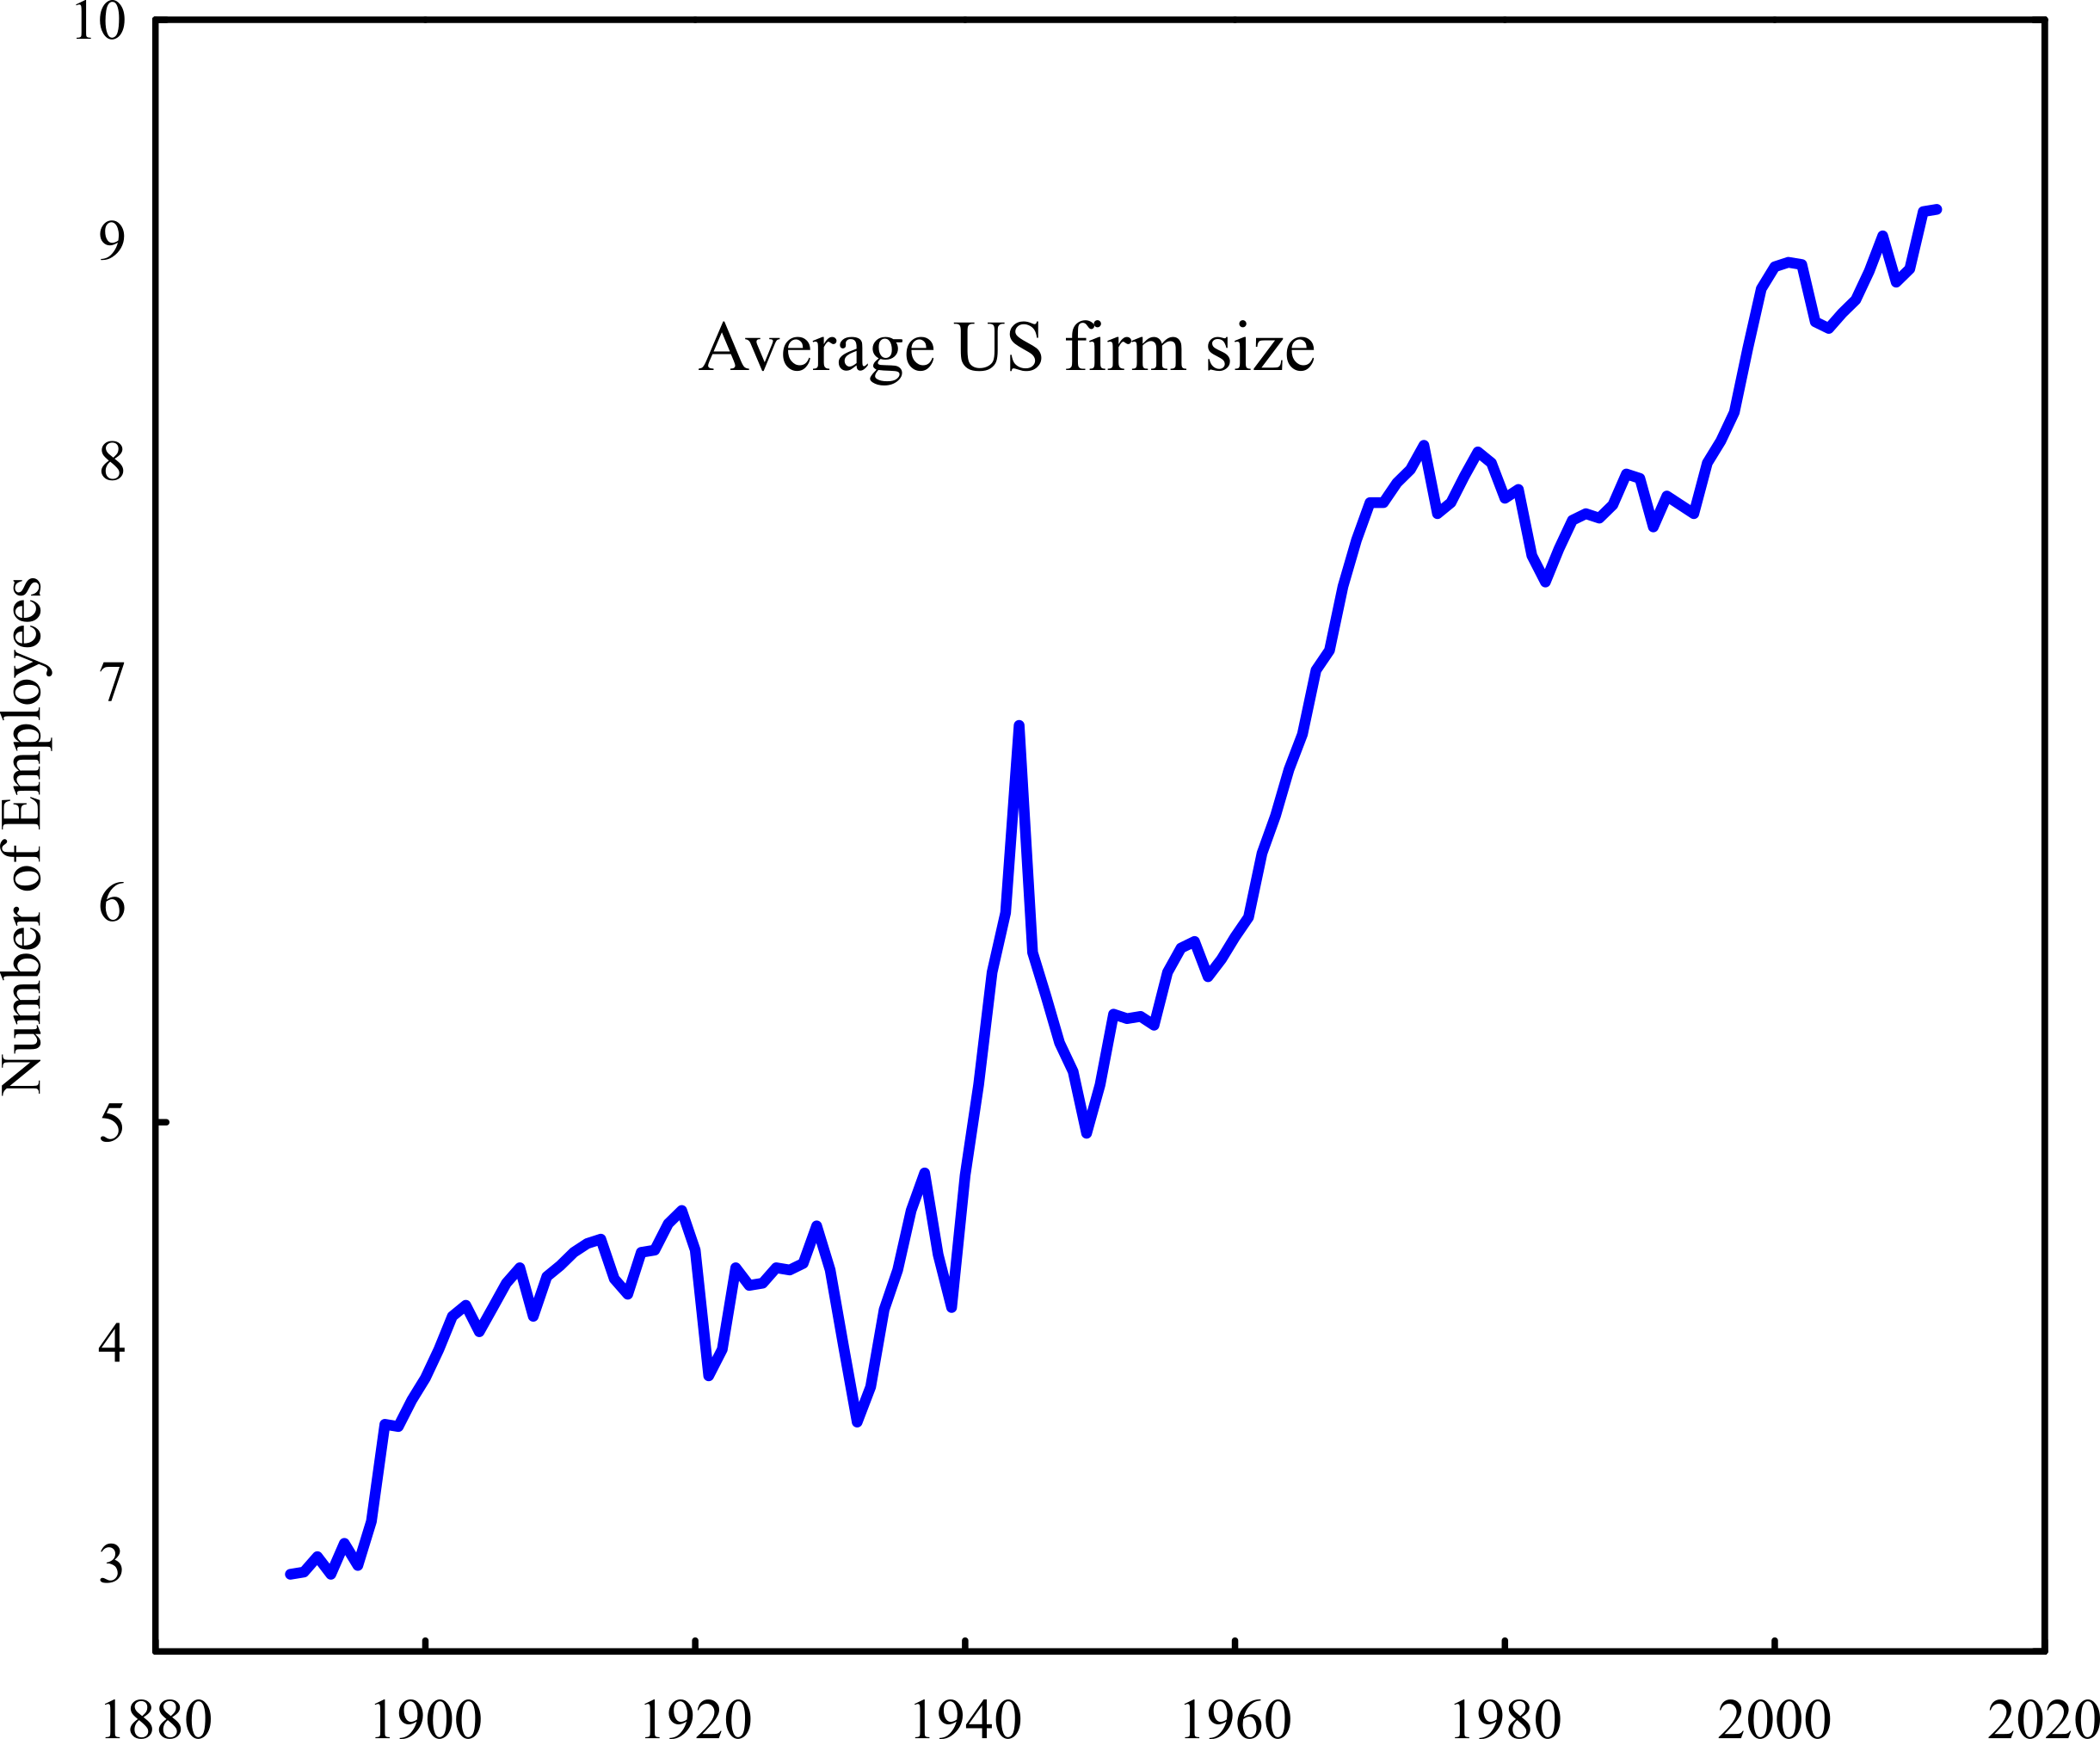
The size ratio (s/S) tends to go up. The main reason is that while large firms grow rapidly, small firms, on average, grow rather slowly. The relatively low rate of small-firm growth merits an explanation. Individually, some small corporations can grow rapidly and a select few may even rise to the ranks of dominant capital. But the corporate universe as whole is constantly infused with newborn corporations, and newborn corporations are almost always small. The magnitude of this infusion is significant. Over the past century, the number of active U.S. corporations has risen more than 18-fold – from around 340,000 in 1916 to over 6,300,000 in 2017 – representing a compounded annual increase of more than 2.9 per cent. This ongoing influx of tiny corporations causes the average corporation to remain small and grow rather slowly.
By contrast, the number ratio (n/N) tends to fall. This drop occurs because the number of dominant capital corporations remains fixed – at 100 and 500 in our case here – while the overall number of firms, as we have seen, keeps rising.
These opposite movements – the rise of the size ratio (s/S) and the fall of the number ratio (n/N) – mean that a significant drop in (n/N) can stunt the growth of aggregate concentration or even make it negative, and this stunting/inversion can happen even if the typical dominant capital firm grows relative to the average corporation!
4. Dominant capital versus the rest
The counter movement of the size and number ratios is conceptually problematic because the numerator and denominator of aggregate concentration do not represent the same type of entity. In fact, they pertain to fundamentally different entities.
The numerator measures the overall size of dominant capital — an organized cluster whose key owners/controllers are a close proxy for the ruling class as one can get. This group is subject to intra-distributional struggles, exits and entries, organizational rearrangements, mergers and divestitures. But overall, it is probably the most cohesive and often the only self-aware class in society. The members of this group, its owners and controllers are connected and fused through numerous ownership, business, cultural and sometimes family ties; they are tightly linked to key government and international organs through a complex web of regulations, policies, contracts, revolving doors and a shared worldview; they impose, reinforce and obey the same encompassing logic of forward-looking capitalization and the institutions that protect it; and their accumulation trajectories often show close similarities.
The denominator, representing the corporate sector as a whole, is a very different creature. Excluding dominant capital, the vast majority of its firms are small. Unlike dominant capital, whose worldview is shaped and reshaped by the mode of power it constantly recreates and imposes, the owners of smaller firms often cling to bygone nineteenth-century ideals. They continue to swear by the ‘free market’ and the ‘autonomous consumer’, they love to bedevil ‘government intervention’ and the higher-up ‘lobbies’ and ‘deep state’ organs, and they long for the good old days of ‘equal opportunity’ and a ‘level playing field’. Their own corporate units are only loosely related through professional associations, if at all; they are removed from the high politics of organized sabotage; they have very little say in matters of formal politics, at least the important ones; and, most crucially, they tend to act at cross purposes. In no way can they be considered a unified power bloc.
The difference between the relatively unified body of dominant capital and the fractured nature of the rest of the corporate sector makes aggregate concentration ratios difficult to interpret: for example, an increase in the number of small corporations causes aggregate concentration to decline — yet that very increase fractures the small-corporation segment even further, causing the relative power of dominant capital to rise.
5. Differential measures
In our view, a better way to measure the power of dominant capital is do so not in the aggregate, but differentially. We need to compare not the totals, but the ‘typical’ units that make up those totals. In short, we need to focus on the relevant (s/S) in Equation 1.
This is what we do in Figure 2, which displays two differential measures — one for the top 100 firms, the other for the top 500 (which we express as five-year trailing averages and plot against a log scale). These measures are calculated in three steps: (1) by computing the average net profit of a dominant capital firm (total net profit earned by the top 100 and 500 Compustat firms divided by 100 and 500, respectively); (2) by calculating the average net profit per firm in the entire universe of active corporations (total net profit divided by the total number of active U.S. corporations); and (3) by dividing the first per-firm result for the top 100 and 500 corporations by the second per-firm result for the average corporation.
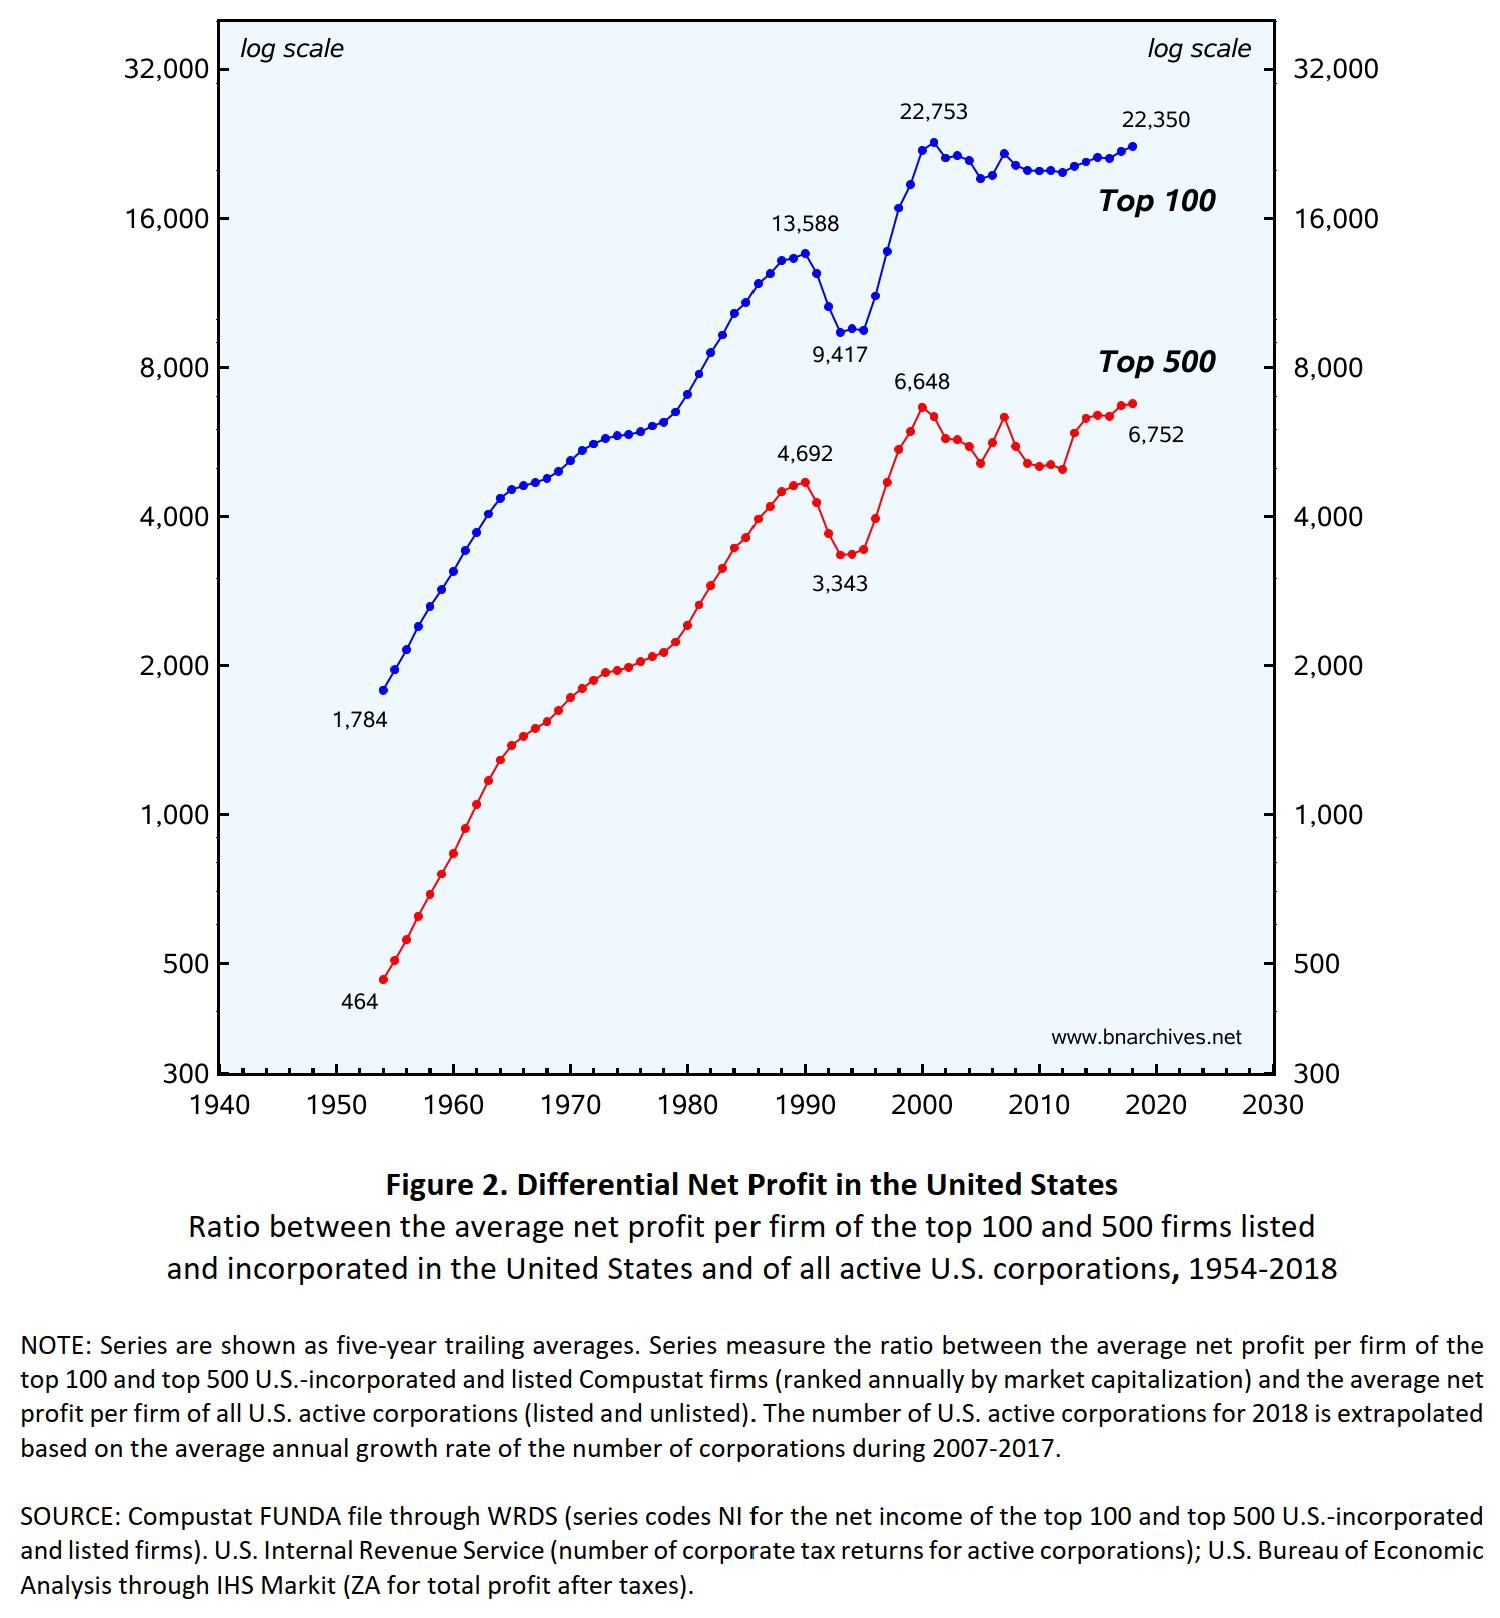
The ensuing ratios denote the differential-net-profit-read-power of the largest corporations. Beginning with the top 100 corporations, we can see that, in the early 1950s, the net profit of a typical dominant capital corporation was nearly 1,800 times larger than that of the average U.S. active corporation. By 2018, this multiple had risen more than 12-fold, to over 22,000.
The path for the top 500 corporations is different in magnitude but similar in dynamics. In the late 1950s, a typical top 500 corporation was over 460 time larger than the average corporation, and this ratio had risen more than 14-fold to nearly 6,800 by 2018.
6. Orders of magnitude
The power of dominant capital looks very different when measured differentially rather than in the aggregate. Aggregate concentration suggests that U.S. dominant capital currently accounts for between one-third and one-half of all profit (depending on whether we look at the top 100 or 500 corporations), and that since the 1950s this power has risen by between one-third and two-thirds (for the top 100 and top 500, respectively).
But dominant capital is qualitatively different from the rest of the corporate universe, so these aggregate measures can be misleading: since dominant capital is highly cohesive whereas the rest of the corporate sector is highly fractured, treating their overall sizes as comparable assigns to the latter group far more power than it possesses.
Differential measures minimize this bias. By comparing the size of the typical unit in each group, they offer a better sense of their relative power. And the difference between the two methods is very large. In the United States the magnitude of differential profit is three to five orders of magnitude larger than that of aggregate concentration, and its overall growth rate since the 1950s is two orders of magnitude bigger. [2]
Dominant capital is far more powerful and has grown much faster than it seems.
Endnotes
[1] This research note revises, expands and updates arguments and data first published in our 2009 book, Capital as Power: A Study of Order and Creorder, pp. 316-321. Shimshon Bichler and Jonathan Nitzan teach political economy at colleges and universities in Israel and Canada, respectively. All their publications are available for free on The Bichler & Nitzan Archives (http://bnarchives.net). Work on this research note was partly supported by SSHRC. We thank Daniel Moure for his proofreading.
[2] Note that aggregate concentration is shown here in per cent while differential profit is expressed as a pure ratio.
- You must be logged in to reply to this topic.