- This topic has 4 replies, 3 voices, and was last updated February 3, 2023 at 12:44 pm by .
-
Topic
-
Part of my research on Netflix is going to test arguments using BN’s concept of hype. Oftentimes, including in my research so far, hype’s place in the capitalization formula has been absorbed into a larger definition of expected earnings. When decomposed into earnings and hype, hype is a short-term scaling factor. It also brings in the effects of herd behavior and human emotion. Didn’t Public Enemy tell us don’t believe the hype?
I’m not sure how many times I will update this thread, but I want to share my experiences using IBES (sometimes styled as “I/B/E/S”), accessed through WRDS. IBES is a Thompson Reuters database that provides histories of financial analyst estimates. Summary histories are available, as well as detailed histories of individual estimates.
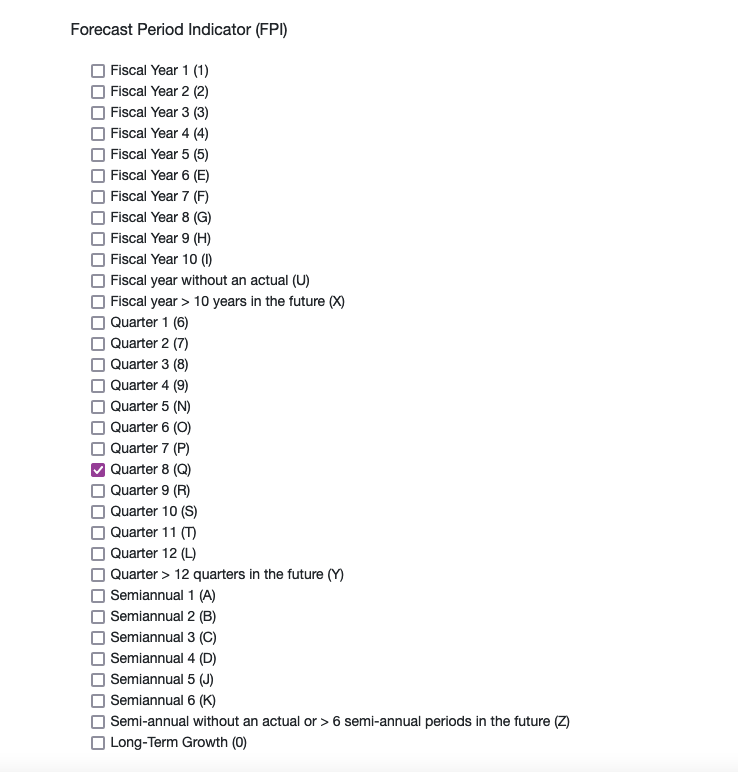
Using the database, it is not hard to replicate BNs measures of hype, which uses EPS. For my paper, I using the detailed history of individual estimates. Thus, each row in the dataset is a single estimate about a specific company. Every estimate is categorized by length of the forecast. The forecast period can be as short as one quarter or longer than ten fiscal years. I’m looking at the forecast period of 4 quarters.
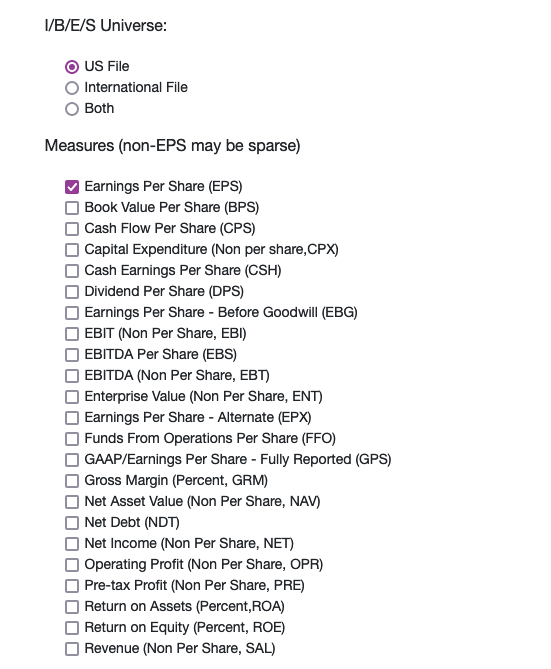
Be sure to download your data with the FPEDATS variable. This enables estimate data to be set to the dates they are estimating, and it makes the comparison to actual values simple.
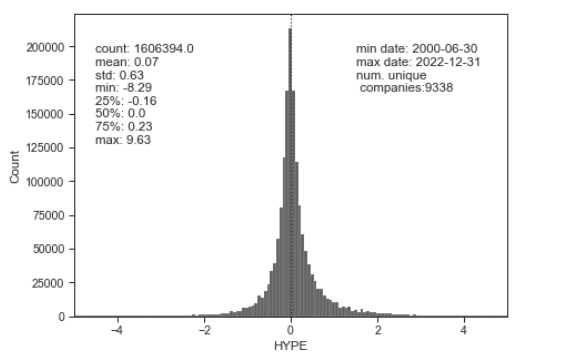
When actual values are available, my calculation of hype is the natural log of the ratio of an estimate of earnings per share, made four quarters prior, to the actual earnings-per-share value. This is essentially the same thing as BN, but I am taking the log of the ratio to transform the distribution into a more Gaussian shape. Yet taking the log limits this analysis to measures of hype that are composed of two positive numbers. Such a limitation is not as severe as we might think. As I work through this research, I can’t conceptualize (or my math is not good enough) how a ratio with losses would work. Try, for example, to conceptualize what a measure hype would mean when the estimate is positive and the actual is negative, or when both values are negative. When both values are negative, the meaning of the ratio is reversed. A ratio of -3 estimated to -2 actual suggests a pessimistic outlook, but this ratio would produce the same measure of hype as the ratio of 3 estimated to 2 actual, which suggests a positive outlook.
Anyways, here are some graphs to share.
First we have the distribution of all 4-Qtr measures of hype between 2000 and 2022:
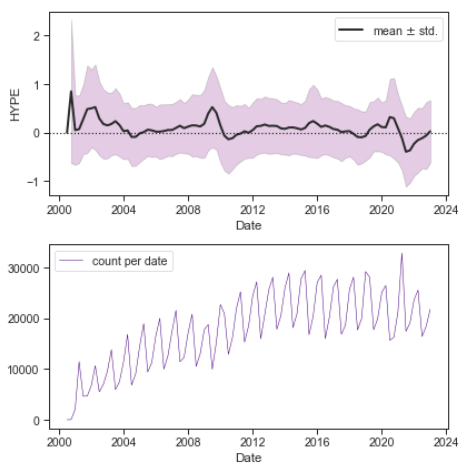
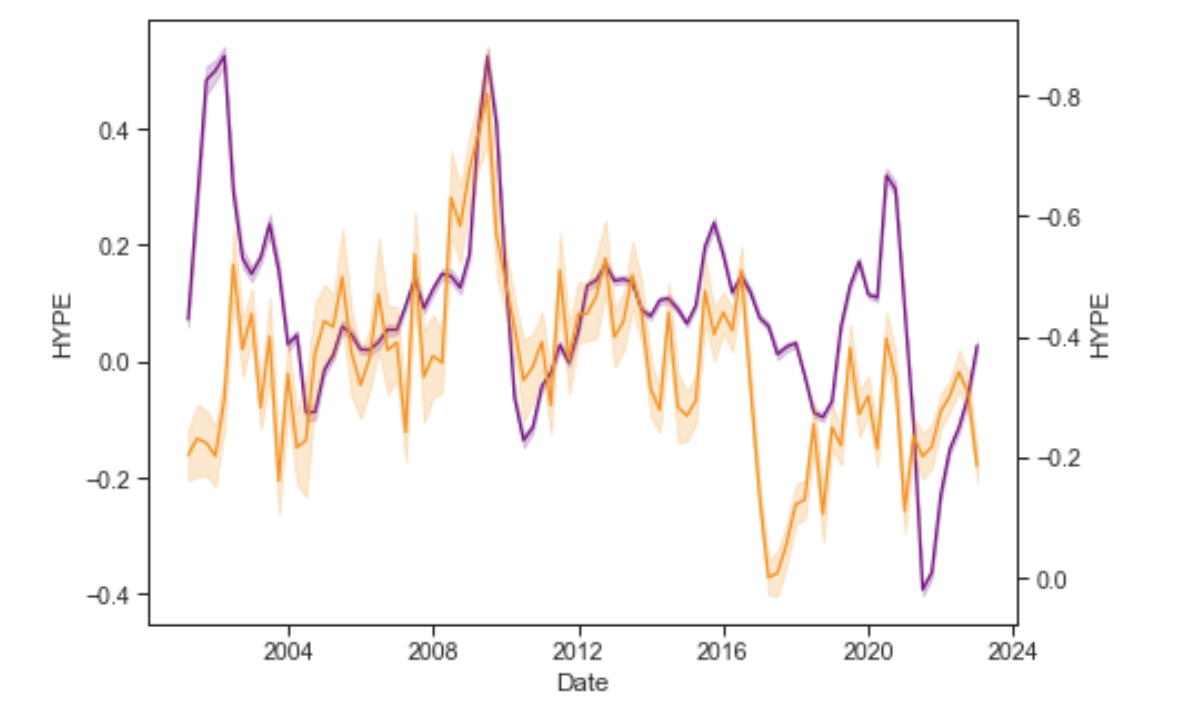
Then we have the mean and standard deviation over the years. One thing I notice is that extreme levels of hype are slightly delayed to the event we would associate it with. The high levels of hype about 2008 financial crisis occur when the rug is pulled from under the estimators. Thus, the big wave of big hype occurs in 2009, when the pre-crash estimates of 2008-Q1 and 2008-Q2 are measured against 2009-Q1 and 2009-Q2.
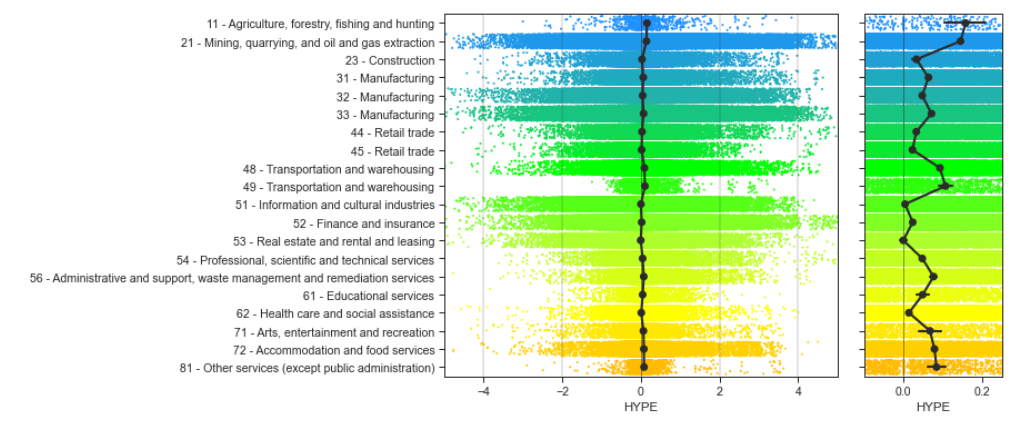
Here are the distributions of hype by NAICS sector (the first 2 digits in often a much larger code).
- You must be logged in to reply to this topic.