Home Forum Research The 1-2-3 Toolbox of Mainstream Economics

  • Creator
    Topic
  • #245408

    Bichler, Shimshon, and Jonathan Nitzan. 2021. The 1-2-3 Toolbox of Mainstream Economics: Promising Everything, Delivering Nothing. Working Papers on Capital as Power (2021/03, March): 1-26.

    http://bnarchives.yorku.ca/678/

    Preamble

    We write this essay for both lay readers and scientists, though mainstream economists are welcome to enjoy it too. Our subject is the basic toolbox of mainstream economics. The most important tools in this box are demand, supply and equilibrium. All mainstream economists – as well as many heterodox ones – use these tools, pretty much all the time. They are essential. Without them, the entire discipline collapses. But in our view, these are not scientific tools. Economists manipulate them on paper with impeccable success (at least in their own opinion). But the manipulations are entirely imaginary. Contrary to what economists tell us, demand, supply and equilibrium do not carry over to the actual world: they cannot be empirically identified; they cannot be observed, directly or indirectly; and they certainly cannot be objectively measured. And this is a problem because science without objective empirical tools is hardly science at all.

    1.      Introduction

    Our purpose in this paper is not to criticize demand, supply and equilibrium as such, but to show that, right or wrong, these tools do not translate into actual science.

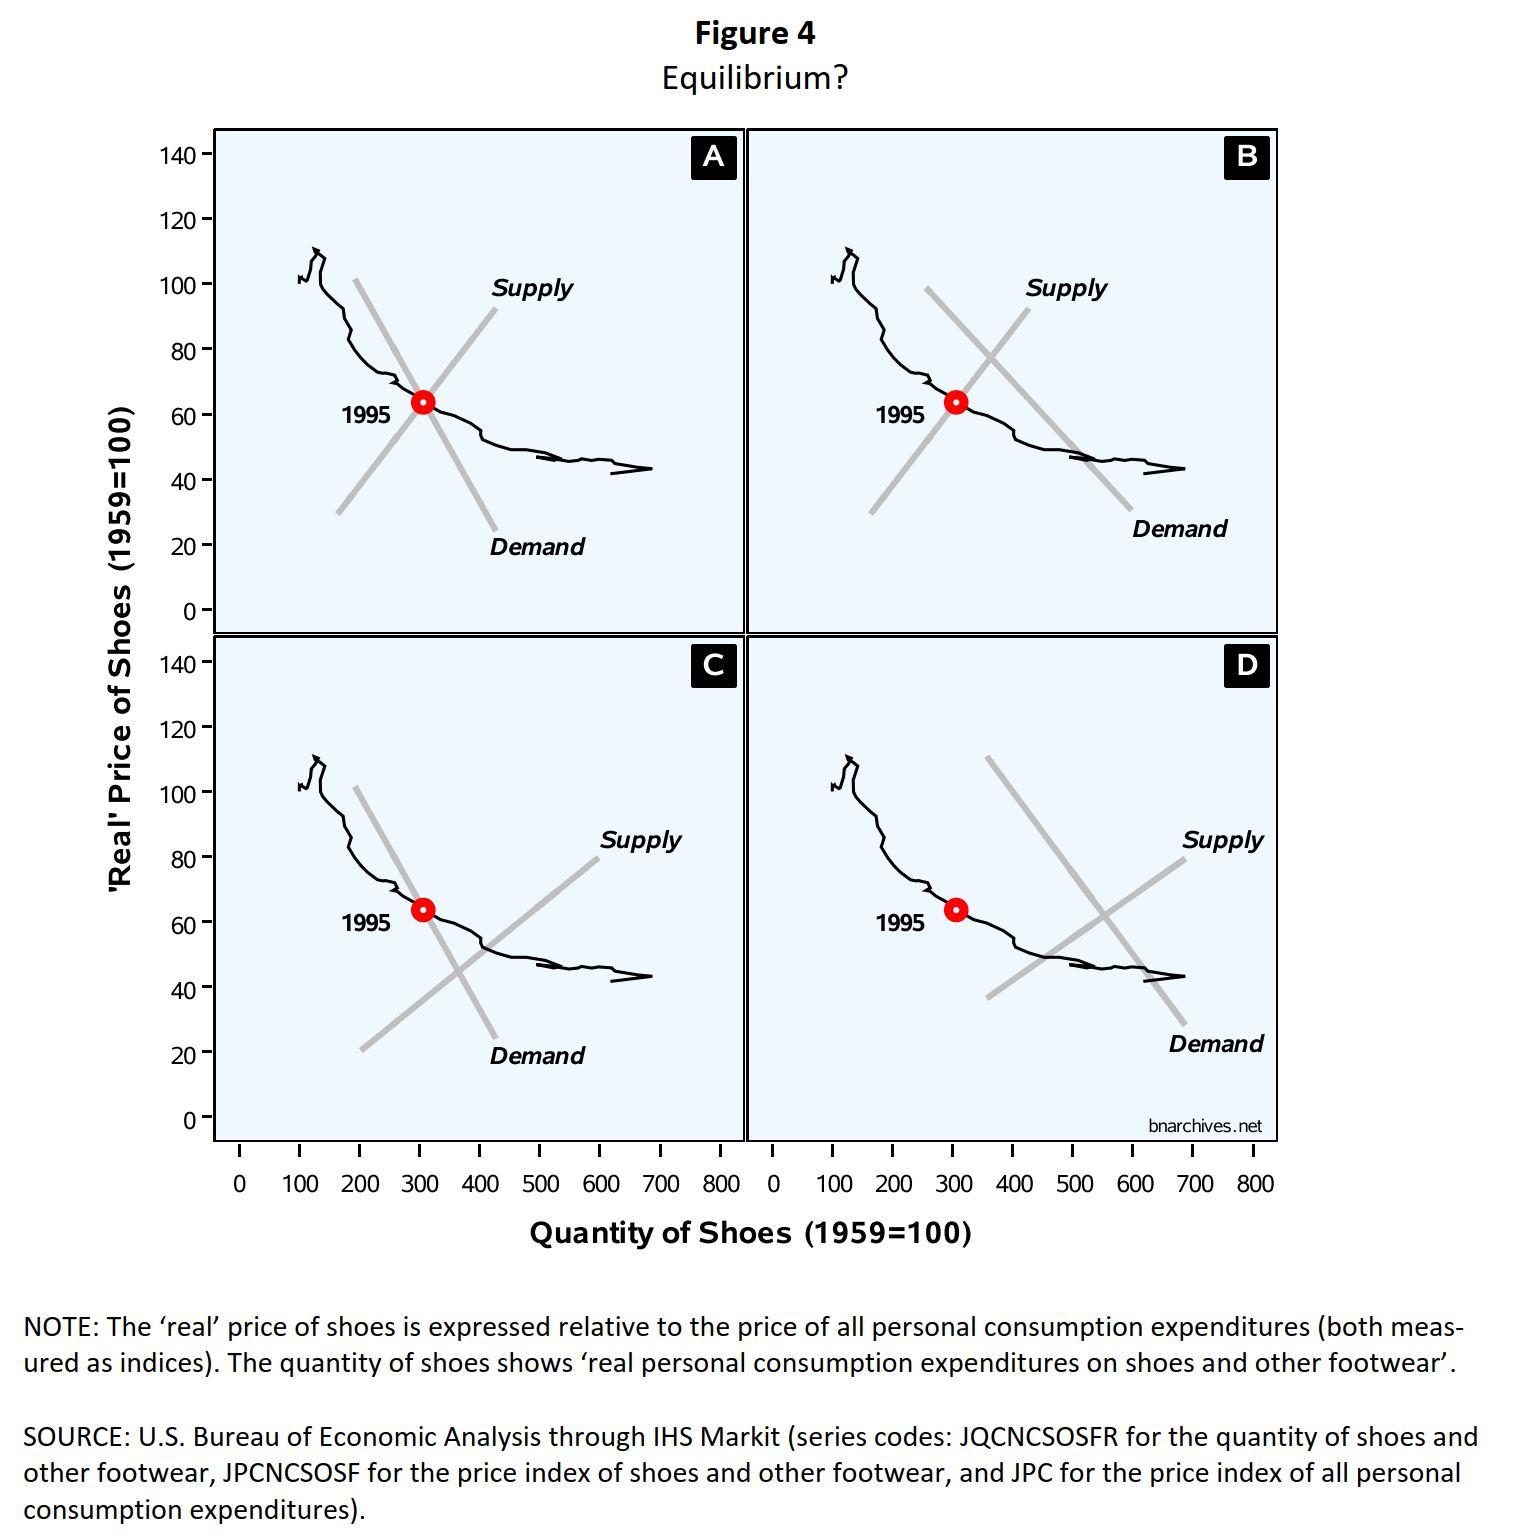
    We begin in Section 2 with what we call the 1‑2‑3 toolbox of mainstream economics. Mainstream economists claim that the key tools in this box – namely, demand, supply and equilibrium – explain virtually any and every market. We argue they do not. In Section 3, we illustrate how in practice these tools produce baffling if not contradictory results and suggest they merit closer inspection. In Sections 4, 5 and 6 we offer a clean-slate outline of demand, supply and equilibrium analysis, show the price and quantity history of the U.S. shoe market, and illustrate how mainstream economists would use their 1‑2‑3 toolbox to explain it. Their explanation, though, is deeply problematic, and for the simplest of reasons: nobody, including economists, has any idea what demand, supply and equilibrium look like!

    As we explain in Section 7 and 8, the demand and supply curves express the intentions of buyers and sellers, and these intentions are unknowable to outsiders (and sometimes even to those who supposedly possess them). In practice, the best economists can do is estimate demand and supply indirectly – and that does not work either. The first method, which we examine in Section 8, is to interview buyers and sellers. On the face of it, this method might seem sensible, but a deeper look shows its results are impossible to assess and often nonsensical. The second method is to estimate demand and supply curves econometrically, based on actual price and quantity data. In Section 9 we show that this method too runs into the wall. Demand and supply regressions, no matter how fancy, are tautological: they assume what they seek to prove. And that is hardly the end of it. Econometric estimates are only as good as the econometric models they are based on, and, as we show in Sections 10 to 12, these models – and therefore the estimates they generate – are virtually all bad (though nobody can say how bad, because the ‘true’ demand and supply curves, assuming they exist, are unknowable).

    So, all in all, the 1‑2‑3 toolbox, even if perfectly effective on paper, is virtually useless in practice. It spews out tons of estimated coefficients, but these estimates have no demonstrable relation to the demand, supply and equilibrium they presumably represent. For all we know, these estimates are no more than ghosts in the minds of the estimators. And, as Section 13 illustrates, these ghost-like estimates often end up spread all over the place. On these counts, mainstream economics is not even close to being a science.

    Continue reading: http://bnarchives.yorku.ca/678/4/20210300_bn_the_1_2_3_toolbox_wpcasp_web.htm

Viewing 1 reply thread
  • Author
    Replies
    • #245414

      This is a reply to our Working Paper by Alexander Douglas.

      It is taken from his blog here: https://axdouglas.com/2021/03/17/defending-microeconomics/ and can also be found here: http://bnarchives.yorku.ca/679/

      ***

      Defending Microeconomics?!

      by Alexander X. Douglas

      I was sent a link to this article by a colleague, who was concerned with the boldness of the central claim – that standard economic theory explains nothing about market behaviour. I thought I might as well share the outline of my response here.

      I’m far from being a defender of the foundations of mainstream microeconomics. But this attack goes much too quickly, in my view. I find myself in the odd position of defending something I don’t believe in from an attack I think is unfair – indeed counterproductive.

      Bichler and Nitzan attack the textbook explanation of prices and quantities as determined by an equilibrium between supply and demand.

      Textbook economics represents market equilibrium, for a given commodity, as the intersection between a supply curve and a demand curve. Bichler and Nitzan notice that we never observe demand or supply curves. Of course not, because these represent counterfactuals: the maximum amount consumers would buy if the price were higher/lower, the minimum price firms would charge if the quantity purchased were higher/lower. The famous ‘scissors’ diagram in all the textbooks is not a picture of different states that a system could be in at different times; it’s a picture of a single moment in time, along with a bunch of counterfactuals for that same moment. As Joan Robinson said, time is at right angles to the diagram. So yes, of course supply and demand curves can’t be observed. We don’t observe counterfactuals; we only observe factuals, if I can say that. That is, we only see the price and quantity determined by the actual (factual?) market. So far what Bichler and Nitzan say is obviously true. How do they get from an obvious truth to a devastating critique?

      First, they look at a time-series of actual market data. Each point represents the quantity of shoes purchased in a given year (in the US) and the average price paid for a pair of shoes in that year:

      They then point out that this data is consistent with each point being a market equilibrium between a different supply and demand curve:

      But it’s also consistent with each point being off the equilibrium in any number of ways:

      What does this prove? Not much, in my view. It’s hardly news that supply and demand curves can be drawn so as to intersect at any point you like. Since they can’t be observed, they must be constructed on the basis of assumptions. Bichler and Nitzan draw their curves arbitrarily, but they propose that neoclassical economists do the same:

      But how did we know what these curves looked like and that they indeed equilibrated at those designated points?

      The answer is we didn’t. Just like the neoclassicists, we have no idea what actual demand and supply curves look like. Just like the neoclassicists, we simply plotted them so that they intersected in the observations for 1995, 2000 and 2010. And like the neoclassicists, we did so because these intersections are consistent with the neoclassical doctrine.

      But the “just like the neoclassicists” clauses here don’t seem right to me. The ‘neoclassicists’ would surely require some rationale for drawing supply and demand curves a certain way. The curves are counterfactual and unobservable, but they’re meant to represent plausible counterfactuals – plausible given certain assumptions. You can’t just draw them anywhere you like; you need a story about why you draw them where you do.

      Now the shifting supply curves drawn by Bichler and Nitzan – S1, S2, S3 – make sense on standard neoclassical assumptions. The years seem roughly to move from left to right in this time-series. A standard assumption is that technology improves over time, and better technology means more efficient, lower-cost production. So this will constantly push the supply curve outwards.

      But the shifting demand curves drawn by Bichler and Nitzan – D1, D2, D3 – seem entirely unmotivated. Of course demand changes. Tastes change; changes in income affect demand; changes in one market act unpredictably upon the conditions of all other markets; policy changes have their effects, etc. etc. But I can’t think of any reason the ‘neoclassicists’ would have for supposing a constant outward shift of the demand curve over time. On the contrary, I think the ‘textbook’ assumption would have stable demand – a single demand curve intersected by the outward-shifting supply curves. The curve might jump around a bit, but the jumps could be assumed to go in random directions and thus cancel out over a long period. Then you’d get this:

      And this seems to show at least a part of the textbook theory being confirmed in the data. A crucial part of the standard theory is that demand curves slope downwards: as price falls, consumers want to purchase more. Of course here there’s some curve-fitting to make the demand curve match the data. But its basic shape can also be supported on ‘plausible’ assumptions: as markets get saturated, the demand elasticity decreases – thus the flattening out of the curve towards the east.

      The above plotting of supply and demand curves isn’t purely arbitrary; it’s based on standard assumptions. So with those (textbook) assumption in place, we have a confirmation of the textbook theory. Nor are the curves simply plotted to match the data, as Bichler and Nitzan’s are; they are justifiable on standard assumptions.

      It’s odd to me that Bichler and Nitzan present this data against the mainstream case. I must admit that the part of me that wants textbook microeconomics to fail was disappointed by how well this time-series actually bears out the textbook story. I was actually surprised to see that people really do seem, like the consumers in the textbooks, to buy more shoes as technology reduces the price.

      Bichler and Nitzan also cite data showing that the elasticity of demand for different goods varies widely:


      This is another case where, aiming to undermine the textbook story, they manage to find data that confirms it! If we were judging the empirical confirmation of a specific economic model we could look at things like the demand elasticity it assumes and see whether this is confirmed in the data. But Bichler and Nitzan are judging textbook microeconomic theory in general. That theory says nothing at all about the specific slope or shape of demand curves. It states only that they slope downwards, and that is, apparently, confirmed in the data.

      Standard economic theory makes only very generic predictions – more specific ones need specific models. An example of a generic prediction is what appears to be confirmed in Bichler and Nitzan’s Figure 2: as the price falls, people buy more. Of course the data doesn’t confirm that prediction on its own. You need to assume a stable, downward-sloping demand curve. But Bichler and Nitzan inadvertently find empirical support for that also: they have a table that seems to show that, whatever shape the demand curve might have, it’s generally a downward-sloping one.

      To repeat, my reservations about their critique don’t stem from a strong faith in the explanatory power of standard microeconomics. My worry is that the material their critique presents seems to be precisely the sort of thing a textbook might include as a defence of the theory. As a critique of textbook microeconomics, this might be a step backwards.

    • #245416

      What immediately springs to mind here is that the supposed demand curve (played out over 60 years!) doesn’t account for either population growth or economic growth. The fact that both income and population have changed enormously over this time means that the chart says nothing about the instantaneous habits of consumers (something that should hardly need stating).

      In other words Alexander X. Douglas sees something with prices on one axis and quantity on the other, sees that it slopes downward and gets worried that it might support neoclassical economics.

      This is a nice testament to the ideological power of neoclassical economics. Ideologies thrive on vagueness … that way you can constantly look at the world and find proof that your views are ‘correct’. This translates into fear of the ideology among critics. They fear that any evidence that even remotely looks like the (hopelessly vague) theory they are criticizing might reinforce the theory. That is the power of neoclassical thinking — the power of vacuity.

      • #245417

        In my classes, both undergraduate and graduate, I present students with this empirical chart and ask them whether the time series in it represents supply, demand, both, or neither. Many students, like Professor Douglas, think that because the curve slopes downward it must be the demand curve, not realizing that their answer implies that none of the underlying parameters changed (or that they changed in a way that their different impacts exactly offset each other). They also don’t realize that whatever their answer, it can never be verified.

Viewing 1 reply thread
  • You must be logged in to reply to this topic.