Forum Replies Created
-
AuthorReplies
-
Thanks Jonathan. That makes sense.
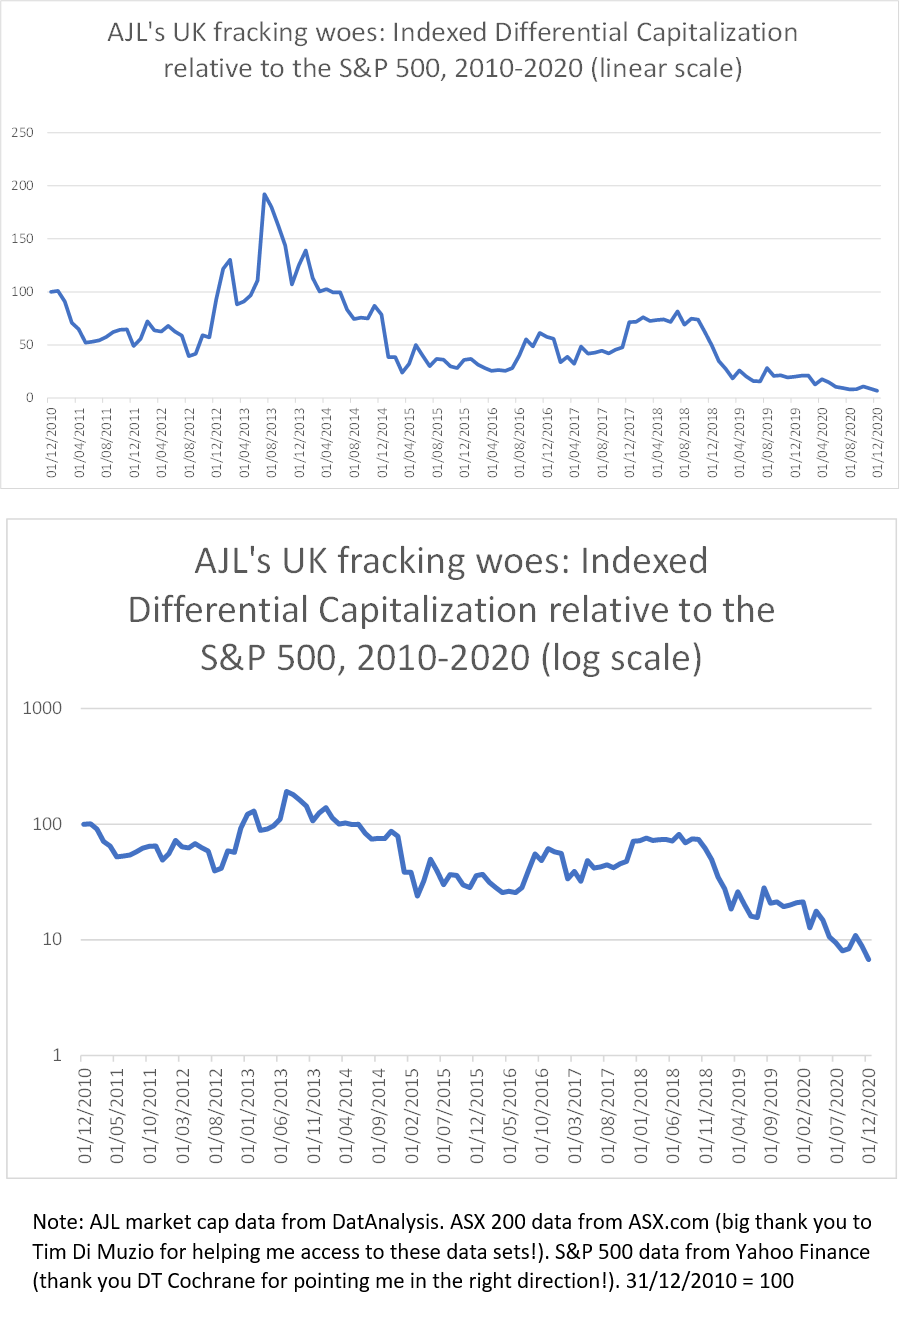
So, I followed Blair’s advice and recreated my AJL charts using log scale.
The top series (see below) is one of the original charts I posted the other day (AJL versus the S&P 500- linear scale). The second series is based on the same data, only this time charted using log scale on the vertical axis (as per Blair’s suggestion). I’m a bit of a novice with log charts, so I’d be interested to hear people’s thoughts on the differences between the two visualisations.
My instinct (in this case) would be to use the linear chart in my analysis as I think it’s easier to interpret (and tell AJL’s story with). But that could just be because I’m a log chart novice!
- This reply was modified 5 years, 5 months ago by Adam Marshall.
Thanks Jonathan! That’s really useful.
I’m just wondering, what made you decide to use linear scale for the top graph and log scale for the bottom?
Cheers,
AdamCheers Blair! I’ll give that a try
Thanks JMC! That’s really helpful
Hi all,
I just wanted to run something by you. As mentioned previously, I’m interested in the differential (de)accumulation of a small cap Australian energy/mining services corporation (AJL).
As indicated in the following two series, AJL (through their investment in shale gas exploration firm Cuadrilla in 2008) placed all their chips on a UK fracking revolution that never materialised. Both series are indexed to 31st December 2010 = 100 and end in December 2020. The top series measures AJL’s differential performance relative to dominant capital (the S&P500), while the bottom series measures their performance relative to the top 200 Australian firms (ASX 200)- a big thank you to Tim Di Muzio for helping me access the AJL/ASX data!
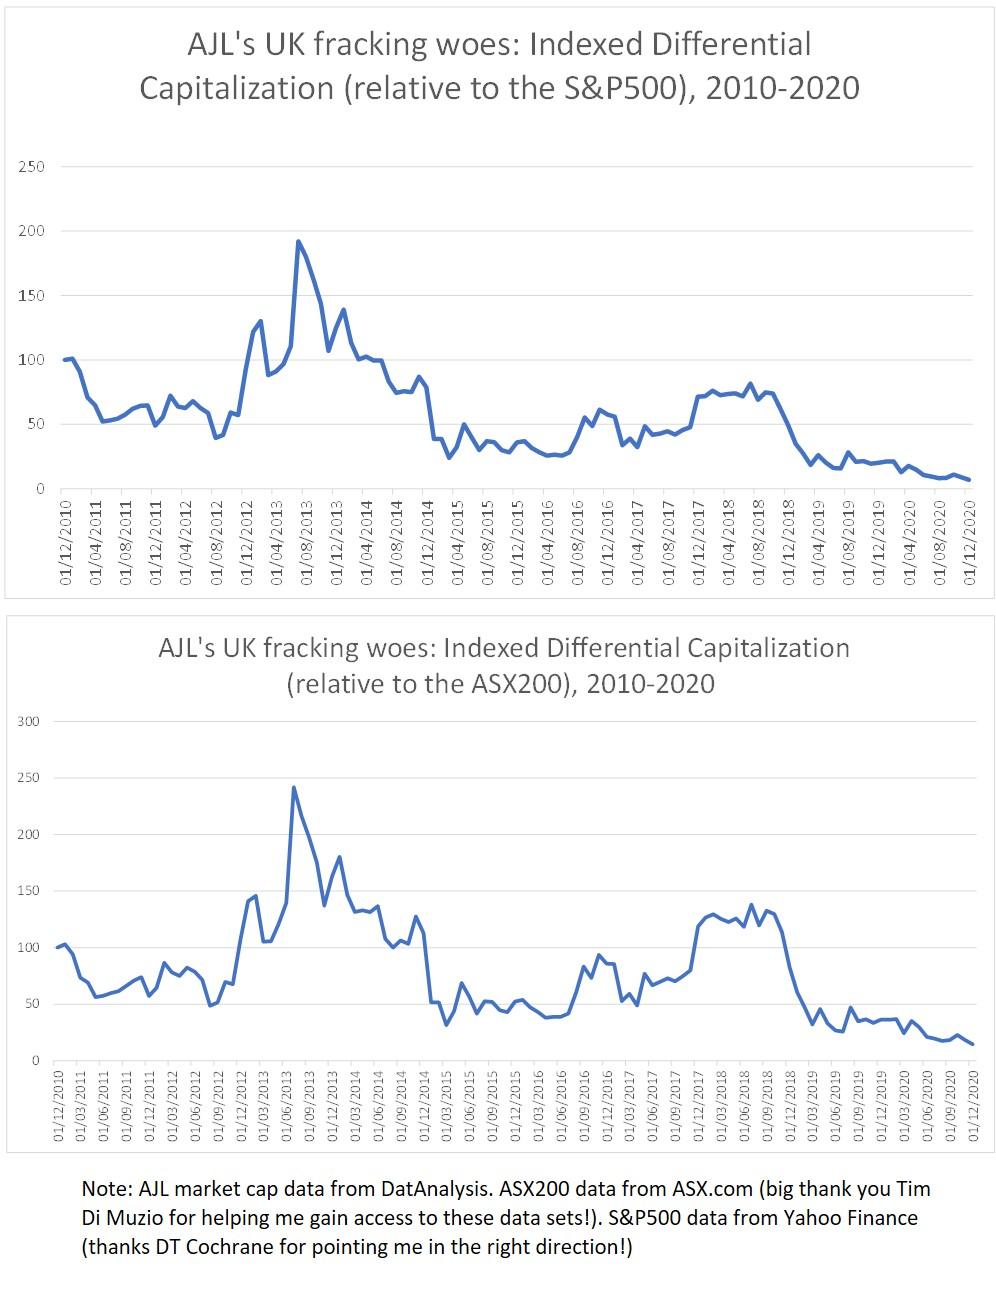
I won’t go into the granular details of their relative performance now, but it’s worth noting that the 2013 spike (and peak) corresponds to a period when there was a lot of hype surrounding the prospects for the UK shale gas industry; much of which was propogated and bolstered by the UK government’s discourse and policy support. At its 2013 peak, the market valued AJL at 411 million (AUD). This and other price spikes seem to correspond to UK government policy announcements/legislation that were supportive of fracking (e.g. when the government announced tax breaks for fracking companies in July 2013, AJL’s capitalization shot up by 81% relative to the S&P 500). Meanwhile, many of the falls correspond to setbacks for UK shale (e.g. AJL’s capitalisation – relative to nthe S&P 500 – plummeted by 40% after local government in Lancashire refused Cuadrilla planning permission for exploratory drilling). AJL has been on a downward spiral since September 2018 when their flagship exploratory fracking at Preston New Road, Lancashire precipitated a series of earthquakes, several of which were felt above ground. This led the UK government to pull its support for shale gas fracking and a moratorium has been in place ever since. AJL’s current market cap is 29 million (AUD).
At the moment, I am unsure as to which comparison makes more sense to use. With this in mind, I’d be interested to hear your thoughts on the following question:
Which benchmark do you think is most appropriate to use for a small-cap Australian firm such as AJL? The S&P 500 or the ASX 200?
If you look at the top series (the S&P 500 comparison), AJL beat the average once (for few months in 2013). However, in the bottom series (the ASX 200 comparison), AJL beats the average twice: in 2013 and for several months during 2017 and 2018. The latter spike corresponds to a period when Cuadrilla began drilling exploratory two wells in Lancashire after the UK government overruled local planners giving them the green light to proceed. As mentioned above, the 2017-2018 rally was cut short after the earthquakes and subsequant moratorium sent AJL’s shares tumbing. My instinct is to benchmark against the ASX 200 (or even the ASX energy index) rather than the S&P 500 as these are the ones that AJL investors would be more likely to use. All thoughts/suggestions are welcome.
Best wishes,
Adamp.s. As a side note. It is worth pointing out that dominant capital is not absent from this story. Although none of the oil/gas majors invested directly in UK shale gas, there is evidence that they were lobbying government to push ahead with the fracking agenda whilst biding their time to see whether it was worth making the plunge themselves. I suppose this is in line with the CasP argument that dominant capital prefers to expand through mergers and acquisitions (rather than greenfield investment):
https://powerbase.info/index.php/All-Party_Parliamentary_Group_on_Unconventional_Oil_and_Gas
https://www.theguardian.com/environment/2018/oct/26/energy-minister-had-private-meeting-with-fracking-firms-in-may-claire-perry
https://www.theguardian.com/business/2014/feb/04/bp-shale-gas-drillingThe majors did not buy into the US shale revolution until relatively late:
https://www.forbes.com/sites/christopherhelman/2018/07/27/bp-pays-10-5-billion-for-a-second-chance-at-the-u-s-shale-game/
https://www.reuters.com/article/us-usa-shale-majors-insight-idUSKCN1R10C3DTC. Thank you for you’re detailed advice on the basics of undertaking quantitative CasP research. They’re really useful and encouraging.
Thank you to you too Blair. You’re comments are very sensible, and I appreciate what you’re saying about not taking on too much at this late stage. That said, I’ve actually started doing some quantitative analysis already. I think I’ve found some interesting things. I’m not going to spend months on it, but I think I’ll do a bit more analysis.
The firm I’m looking at is relatively small, bet the house on UK shale gas and lost. I already knew that before I ran the numbers. However, now I’ve computed its differential performance (relative to two relevant benchmarks), its given me a much clearer picture of how dependent their accumulation strategy was on UK govt policy support. I’ll post the graph once I’ve finished labelling it with my initial analysis. Would be interested to hear your thoughts.
Cheers
Thank you Jonathan. I will read these with great interest.
Best wishes,
Adam
Thank’s a lot JMC! That’s really helpful. If you can get hold of the Australian market cap data, that would be great. Ideally, I’d like to have it going back ten years. However, really, I’m most interested in the last three-five years. Don’t go to too much trouble though. If the data is too difficult to come by, what are your thoughts on using the stock price as a next-best indicator?
Thanks also for linking me to Shiller’s S&P500 historical data. I’ve had a look at it, but I cannot seem to locate the market cap data in this file. Perhaps it’s staring me in the face, and I just don’t know what I’m looking for! That said, I’ve also had a look at BN’s data file for the systemic fear paper. I can see that they have market cap data (for non-financial corporations). However, this only goes as far as 2015, and I’m most interested in 2016 onwards. One thing I noticed is that, in the paper, BN say that they got their market cap data from Global Insight (rather than Shiller). Perhaps that explains why I couldn’t find the data in the Shiller file?
Thanks again for all your help (and apologies for all the questions!).
Best wishes,
AdamHi JMC,
Thanks again for taking the time to answer my questions last week. You made some really important points, which I will certainly take on board. Having pondered my options, I have decided that I will try to incorporate some quantitative analysis into my project. However, given time constraints, this analysis will have to constitute a small portion of my project.
I mentioned previously that, during my fieldwork, I spent several months with activists who were campaigning against a company whose major shareholder (AJ Lucas) is listed on the Australian stock exchange. A key aim of the campaign was to drive down the company’s stock price by delaying construction on the site and driving up costs.
I recently came across a really interesting CasP paper by DT Cochrane that examined the impact of the Deepwater Horizon disaster on BP’s differential accumulation:
https://www.econstor.eu/bitstream/10419/157877/1/wp-cap-2016-05.pdf
I would like to attempt something similar. In my case, to examine how specific events (activist blockades, fracking-induced earthquakes and eventually a moratorium) impacted the parent company’s differential market capitalization over 2-3 year period (relative to the Australian oil and gas industry and the S&P 500).
As far as I can gather, this data is available from the following places:
https://www.spglobal.com/marketintelligence/en/?product=compustat-research-insight
If anyone has a subscription to any of these databases and would be willing to help me gain access to the relevant market cap data, I’d be really grateful. Thanks in advance.
Best wishes,
AdamHi Jonathan,
Apologies for the late reply. It’s been a hectic week! Thank you for answering my questions and sharing the relevant readings. I look forward to working my way through them.
Best wishes,
Adam
Hi JMC,
Thank you for taking the time to answer my questions. I really appreciate it!
You have given me lots tof food for thought, so I think I might need some time to reflect before I respond in full.
One thing I am certain of is that I would love to get my hands on market capitalization data for an Australian mining/infrastructure firm called AJ Lucas (going back 10 years or so):
https://markets.ft.com/data/equities/tearsheet/summary?s=AJL:ASX
I suspect this data is available from Compustat Global, but I do not have access via my institution. If anyone can help me gain access I’d be very grateful 🙂
Thanks again,
AdamThanks for the suggested readings Jonathan. They should keep me busy over the Christmas break! I hope you don’t mind, but I have a few more questions about CasP:
1. Do you know of any papers/books that analyse the crisis of 2007-08 through the lens of CasP? Like many of my generation, my interest in political economy was sparked during this period. However, I’ve only really read Marxist, post-Keynesian and classical analyses of the financial crisis so would be interested to see how different a CasP analysis might be.
2. If I understand correctly, a lot of CasP research focuses on large publicly listed corporations, using their market capitalizations as a proxy for power. How would you go about assessing the power of organisations for which market cap data doesn’t exist (e.g. privately owned corporations, hedge funds, private equity firms etc.). If you have answered this question elsewhere, please could you direct me to the relevant paper/chapter?
3. During the course of my research on the UK fracking conflict, I learned that it is very common for large private equity firms to invest in small oil/gas exploration companies that have yet to make money or be listed on a stock exchange. Sometimes they take equity in a firm that is small/medium-sized and already listed on a stock exchange. I’m thinking aloud here (so aren’t necessarily expecting a solid answer), but I’m just wondering how easy it is to do a CasP analysis when the powerful/controlling interest is a private entity (i.e. a private equity firm) who own a public company that is weak on paper with a low market cap?
Apologies if that last question is a bit rambling. Like I said, I’m thinking aloud and not expecting a definitive answer.
Best wishes,
Adamprivate equity firm has lots of money and political connections
Thanks Jonathan. I thought it was a misrepresentation of your position, but it’s really useful to have you confirm that.
Cheers,
AdamI couldn’t agree more Jonathan!
Like I said earlier, I am very new to the CasP approach and am still trying to decide where I stand on it. Reading the CasP literature has been an unnerving experience. This is because it has caused me to question many ideas and concepts which have been central to my thinking on political economy for a few years now (e.g. financialiation, fractions of capital, rent, capital as value in motion based on expanded production, circulation and distribution). To come to an informed conclusion, I am trying to read arguments both for and against CasP. With this in mind, I would be really grateful to get your thoughts on a particular critique of CasP made in a paper by Mazzen Labban (see link below):
Labban, M., 2010. Oil in parallax: Scarcity, markets, and the financialization of accumulation. Geoforum, 41(4), pp.541-552.
Labban’s paper, which is based on a Marxian understanding of financialization (a concept I know you find problematic), focuses on the role of financialization and production in accumulation in oil markets. While CasP is not the paper’s main focus, Labban dedicates a few paragraphs to explaining and critiquing CasP’s argument that ‘capital is only finance’ (p.549-50). I have copied and pasted the relevant paragraphs below. I have a feeling he may have misrepresented your position on the role of production in accumulation. With this in mind, I’d be really grateful to get your thoughts on Labban’s depiction of your work and the specific arguments he makes viz a viz accumulation in the oil industry. Thank you in advance:
To what extent has capital accumulation in the oil sector superseded the production and realization of value in the production and exchange of oil? Has capital accumulation been completely liberated from production? This seems to be the conclusion drawn from reading Nitzan and Bichler, whose rich work deserves a much closer and extended critique than the space of this article duly allows. For Nitzan and Bichler (2006, p. 18; see also Nitzan and Bichler, 2009), there is no ‘real’ value lurking behind fictitious capital. Fictitious capital is real capital; real value is market value. The value of a corporation on the stock market, its market capitalization, derives from perceptions about its ‘ability to generate profit’ rather than the value of its material assets, which is practically impossible to determine. Accumulation, on this view, is not amassment of material stock for productive purposes, but accumulation of paper assets whose value derives from the stock market. Wealth takes the form of ‘financial claims on expected future earnings’ (Bichler and Nitzan, 2004, p.256). Modern ownership is ‘only financial’—‘capital is finance, and only finance’ (Nitzan and Bichler, 2002, p. 36).
Capital to Nitzan and Bichler is power, not simply an economic process. Dominant capital is the coalition of capitalists that succeeds in achieving differential accumulation, i.e. ensures that its profits and assets (market capitalization) not simply grow in absolute terms, but grow faster than the average. Dominant capital achieves differential accumulation through two primary methods: breadth, increasing the size of the corporation (measured by number of employees); and depth, the measure of dollar earnings (profit and/or interest) relative to the size of the corporation. The first has been carried increasingly through merger and acquisition rather than greenfield investment, while the latter through ‘differential inflation’, or stagflation, raising prices faster than the average rather than increasing production or cost cutting.
There are two contradictions in this argument that prevent it from making the salto mortale out of material production. First, although ownership and wealth are located entirely in the stock market, where the value of a corporation derives entirely from the market perception of its ability to generate profit in the future, this very ability is associated with the corporation’s power over material production and exchange, exercised through corporate amalgamation. Indeed, this is where dominant capital appears as political power and not just an economic process, in its ability to break ‘ownership envelopes’ and expand its control over productive capacity and employment, as well as its ability to induce differential inflation while cutting production (see Nitzan and Bichler, 2009, pp. 327–333). Second, although production is written out from the process of accumulation, oil companies are still construed as buyers of crude oil (traders, to be accurate, according to the analysis above) though not producers (Nitzan and Bichler, 2006, p. 70). This implies that oil has to be produced somewhere at some time and that investment in the production of crude oil and refined products has to take place (mostly by major oil companies in the latter case). Production however is only the first act in the generation of profit, which is only complete in the second act of realization in exchange—the critical moment at which the commodity is sold. Hence, oil companies must also be sellers of oil and refined products. This act is necessary for Nitzan and Bichler’s argument regarding inflation as a strategy of accumulation, for this must imply the sale of the commodity at some time, no matter how much the profits of oil companies have come to depend on high prices rather than volume of sale.
Oil companies continuously invest in upstream and downstream production and reserve expansion, mobilizing placements as finance along with purely financial investments. The relation between finance and investment has changed over time, but so far the one has not replaced the other. To take one example, ExxonMobil’s investments (expenditures on capital and exploration) grew in absolute terms with the surge in oil price in recent years, but have changed only slightly relative to income (Table 1).34 Most remarkably, stock buyback grew in relation to income and to investment in both absolute and relative terms. The greatest increase is in the growth of stock buyback relative to stock sales: less funds are raised from sale of stock relative to borrowing on financial markets (debt in 2008 remained the same as in 2003, around $9.5 billion) at the same time that more income goes to buy back stock and to shareholders as dividends in comparison with investment.35 The general trend towards finance is reflected in the increase in the ratio of financing (debt, dividends and buybacks) to investment expenditures (greenfield and equity), keeping in mind that the boundaries between the two have become increasingly blurred.
Hi Jonathan,
Thank you for your reply. I fully agree with your comments on the importance of empirical research. I also think the Marxist professor’s advice was ridiculous. Perhaps I didn’t make this clear, but My PhD project is based on empirical research. I spent around a year in the field conducting participant observation with anti-fracking campaigners, conducting interviews, attending industry conferences, collecting company documents, newspaper articles, social media posts etc. These sorts of (qualitative) methods produce very different types of data than quantitative methods, but they are equally empirical. Both types of methods have their place. For example, quantitative methods could tell you that Foxconn have a huge problem with workers committing suicide in their factories. Qualitative methods could help you explain what is driving this situation.
I’m not sure what your thoughts are on this, but I am of the view that data rarely speaks for itself. It always has to be interpreted using theory – whether our own or someone else’s. Depending on the results of the empirical work, we can confirm, refine or discard our working theory (or produce a new one like you did with CasP!).
DT Cochrane’s work sounds really interesting. Thanks for recommending it. I’ll be sure to check it out.
Best wishes,
Adamp.s. apologies if I have misinterpreted your point about empirical research 🙂
-
AuthorReplies