Forum Replies Created
-
AuthorReplies
-
Thanks Jonathan. That’s really helpful! Just to give you a clearer picture, I’ve already compared AJ Lucas’ differential earnings (EBIT) to its differential capitalisation (see chart below). As you can see, for most of the decade, the firms’ differential earnings were either negative or very small.
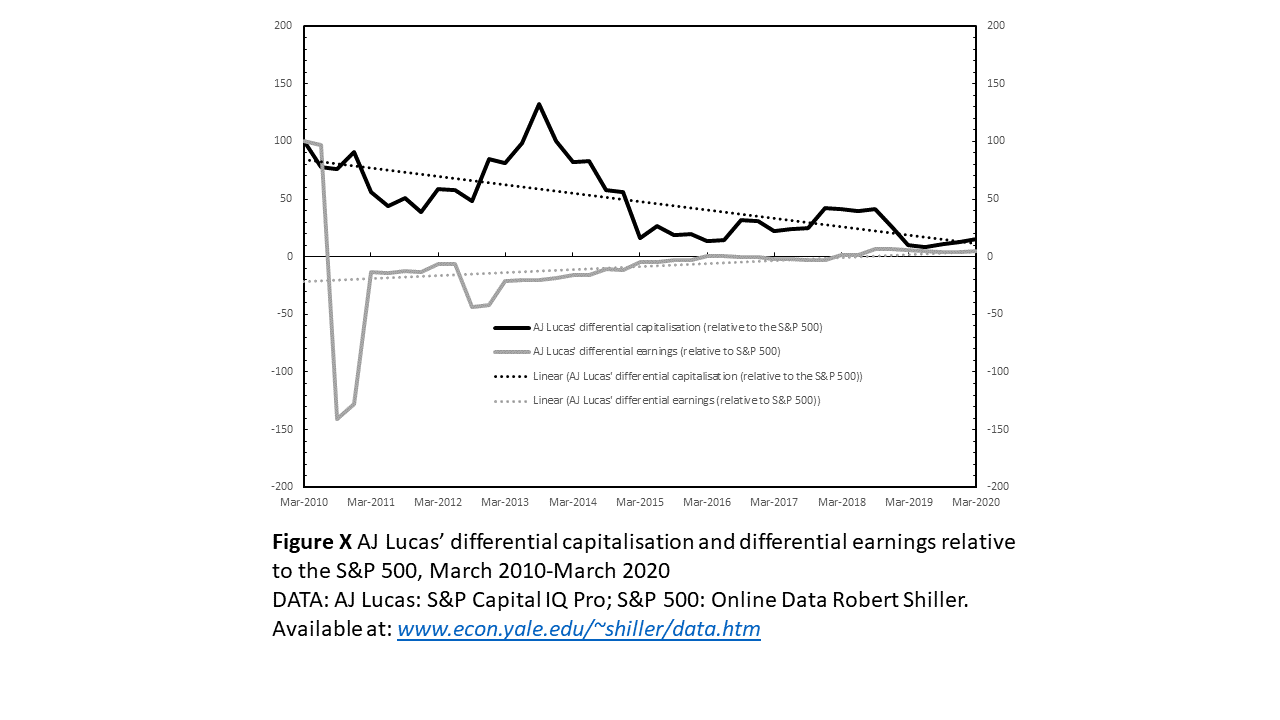
Read in light of my prior knolwedge of UK fracking and the hype that surrounded it (especially in the early 2010s), this chart suggests to me that the periodic spikes in differential accumulation were largely driven by hype. 2013 saw the largest spike in differential accumulation. During this period, the hype surrounding UK shale gas was arguably at its peak and public opposition had yet to become widespread. The other significant, albeit much smaller, spike in differential accumulation came in 2018 when AJ Lucas’ UK fracking firm (Cuadrilla) were, following lengthy planning battles, drilling its first exploratory well in the UK since 2013. As time progressed, and the companies struggled to progress their fracking plans due to planning delays, protests, and geological issues, this hype gave way to investor anxiety that their UK shale gas investments were at (differential) risk and the expected future (differential) earnings would never materialise. In November 2019, when the UK government announced a moratorium on fracking the differential risk associated with these investments increased significantly. The following headlines provide a flavour of this story:
‘AJ Lucas shares surge on UK shale speculation’ (Wen, 2013: Online).
‘AJ Lucas shares slump as green groups laud “stunning victory” on UK fracking’ (Macdonald-Smith, 2015: Online).
‘AJ Lucas shares surge as investors eye UK shale bounty’ (Macdonald-Smith, 2016: Online).
‘Fracking companies’ shares slide following UK government halt’ (Thomas, 2019: Online).
Regarding your helpful suggestion about measuring the differential PE. Unfortunatley, I do not have PE data for these firms and no longer have access to the relevant financial databases. Moreover, because my submission deadline is rapidly approaching, I do not really have the time to conduct any extra analysis. With this in mind, I’d be interested to get your thoughts on the differential earnings data/analysis presented above and whether (and to what extent) you think this data/analysis can substitute for the PE data you suggested I analyse?
Thanks again!
Adam
P.S. Over the weekend, I’m hoping to produce a similar chart to the one above for IGas (the other fracking firm I’m focusing on).
Hi all. I just wanted to get your thoughts on something. The chart below contains the following four time series: AJ Lucas’ differential capitalisation relative to the S&P 500; IGas’ differential capitalisation relative to the S&P 500; support for fracking in the UK; and opposition to fracking in the UK. Each series covers the period December 2013-March 2020. AJ Lucas and IGas have been at the forefront of efforts to frack for shale gas in the UK over the last decade. During my fieldwork, I found that winning over public opinion was a key strategic aim for both the pro-fracking coalition and anti-fracking movement.
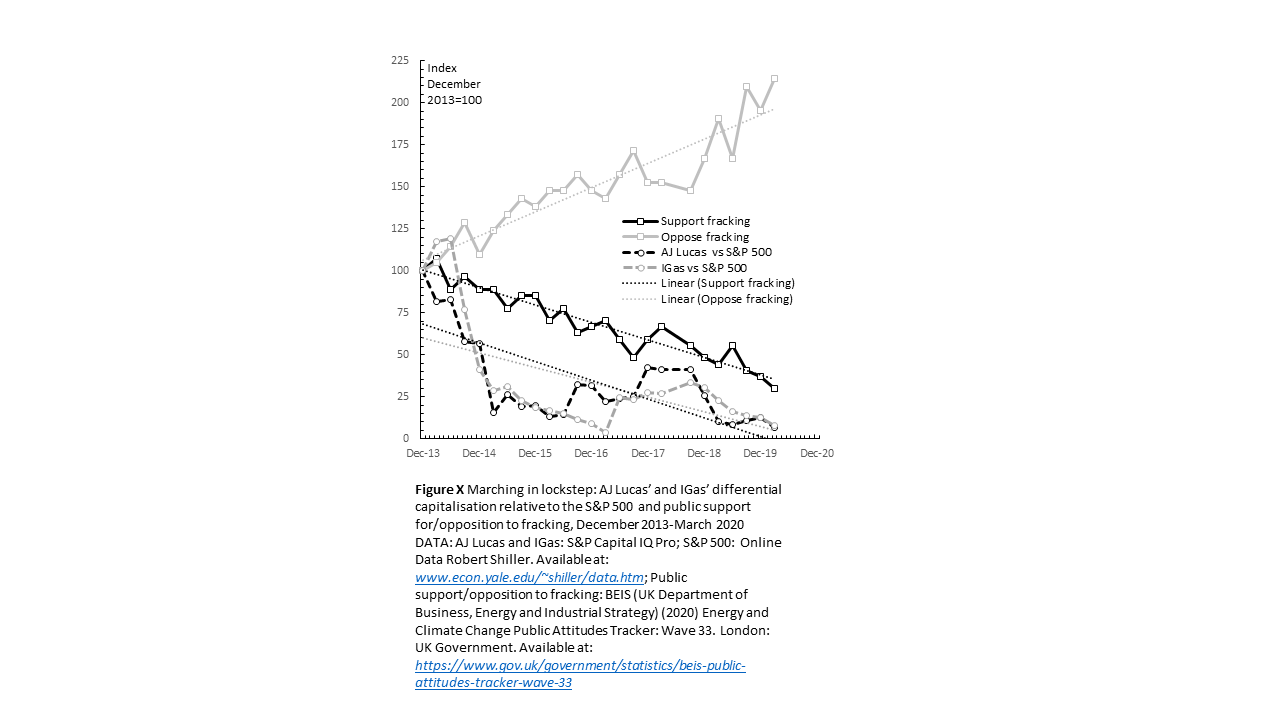
Having created this chart, I ran the following Pearson correlation tests:
AJ Lucas’ differential capitalisation vs IGas’ differential capitalisation (r=0.90). Strong positive correlation
AJ Lucas’ differential capitalisation vs public support for fracking (r=0.67). Strong positive correlation
AJ Lucas’ differential capitalisation vs public opposition to fracking (r=-0.74). Strong negative correlation
IGas’ differential capitalisation vs public support for fracking (r=0.66). Strong positive correlation
IGas’ differential capitalisation vs public opposition to fracking (r=-0.66). Strong negative correlation
Public support for fracking vs public opposition to fracking (r=-0.94). Strong negative correlation
Given the strategic importance of public opinion to both sides of the fracking conflict, intuitively, these results make a lot of sense, and I suspect they are not coincidential. For example, it is hardly surprising that rising opposition to fracking and the increased anti-fracking activism/direct action that came with it, are strongly correlated fracking companies’ differential decumulation. However, it is my understanding that to speak with any certainty about r values, they must be tested for significance. Therefore, having run these Pearson correlation tests (which I have very little experience with), I began looking into the most appropriate way of testing for significance. This led me down an internet stats advice rabbit hole, which has left me with more questions than answers. These questions include whether or not a Pearson correlation test is even appropriate in these circumstances? Or would a regression make more sense? Or a t-Test? As mentioned previously, I don’t have a background in quants so this sort of analysis is all very new to me. Any advice/tips regarding the above would be most welcome 🙂
Cheers,
Adam- This reply was modified 3 years ago by Adam Marshall.
- This reply was modified 3 years ago by Adam Marshall.
I should add that, in addition to Nitzan and Bichler’s work, the above argument builds heavily on DT Cochrane (and also Jeff Monaghan’s) previous writings on CasP and activism. Especially:
- Cochrane, D.T., 2010. Review of Nitzan and Bichler’s” Capital as Power: A Study of Order and Creorder”. Theory in Action, 3(2, April), pp.110-116 https://bnarchives.yorku.ca/284/2/20100400_cochrane_review_of_casp.pdf
- Monaghan, J. and Cochrane, D.T., 2012. Fight to Win! Tools for Confronting Capital. In The Accumulation of Freedom: Writings on Anarchist Economics (pp. 95-116). AK Press https://bnarchives.yorku.ca/667/2/monaghan_cochrane_2012_fight_to_win.pdf
Thanks Blair. Yes, I suspected as much. For the purposes of my research, I’m not necessarily looking to chart the capitalization of these private firms. It’s more about acknowledging their size, the specific investments they’ve made in fracking, and identifying some of the strategies and tactics they’ve used to try and influence social processes in favour of their pro-fracking agenda. That said, I am planning to use the differential capitalization of AJ Lucas – a small-cap firm who put all their eggs in the UK fracking basket – as an (imperfect) proxy indicator for the on-going redistributions of power between the pro- and anti-fracking movements in the context of this conflict.
I would justify this in the following way: Because AJ Lucas is a small-cap firm that bet the house on fracking (through its investment in Cuadrilla Resources), its share price is extremely sensitive to the fortunes of UK shale gas. For example, at various times, its valuation has risen in response to pro-fracking legislation and policy announcements; and moved in the opposite direction when the sector received bad news – often due to the actions/pressure of anti-fracking campaigners. Most notably, when the government announced a fracking moratorium following a series of fracking-induced earthquakes at AJ Lucas/Cuadrilla’s exploration site in Lancashire. Given the above, plus the fact that the UK fracking lobby includes many more actors than AJ Lucas (several of which could be described as dominant capital), I think its justifiable to use AJ Lucas’ differential capitalization as an (imperfect) proxy indicator for the ongoing (re)distribution of power between the pro and anti fracking movments during the course of this conflict.
I’d be interested to hear people’s thoughts on these ideas 🙂
Cheers,
Adam
Hi all,
Long time no speak. I hope you’re holding up okay.
Just wanted to get your thoughts on something. I’m currently writing a section in my thesis regarding the role of dominant capital in the UK fracking conflict. One interesting thing about this empirical case study is that there are relatively few large publicly traded corporations directly invested in the UK’s dash for gas.
Instead, much of this investment has come from privately held corporations. For example, private equity firms such as the Carlyle Group (who manage $376 billion worth of assets globally) and Riverstone Holdings ($41 billion) invested in Cuadrilla’s exploration activities in Lancashire.
The privately owned petrochemicals conglomerate Ineos is another key player (sales in 2017 of $60bn and EBITDA close to $7bn). Ineos are aiming to drill their own wells to secure gas supplies for their petrochemicals business.
Anyway, I’m in the process of arguing that, to varying degrees, these private firms can be categorised as dominant capital owing to their size and ability to (re)shape the terrain of social reproduction. However, I’m aware that most CasP scholarship tends to reserve this label for large publicly listed corporations (e.g. those comprising the S&P 500). I’d be interested to hear people’s thoughts on this.
Cheers,
AdamThanks for this, Scot! Apologies for the late reply. I must have overlooked your message at the time. I just came across it now 🙂
Since I posted this question, I have actually managed to read most of Tim’s work – including the two books you recommended. I’ve found them to be really valuable resources. In my PhD research, I’m drawing quite heavily on Carbon Capitalism.
Your point about capitalists aiming to preserve their wealth by ensuring their return on capital exceeds inflation makes sense. Although would this not generally require them to also beat the average? If Jonathan Nitzan, Shimshon Bichler, and Blair Fix (e.g. https://economicsfromthetopdown.com/2021/11/24/the-truth-about-inflation/) are correct that inflation is driven by power struggles within dominant capital to raise prices faster than their peers, then doesn’t it follow that those whose accumulation exceeds this (average) rate of inflation will also beat the average in terms of differential earnings and capitalization?
Cheers,
AdamThanks Blair! That’s very helpful
Apologies, I uploaded the time series as an attachment rather than an image. Here’s is is:
Hi all,
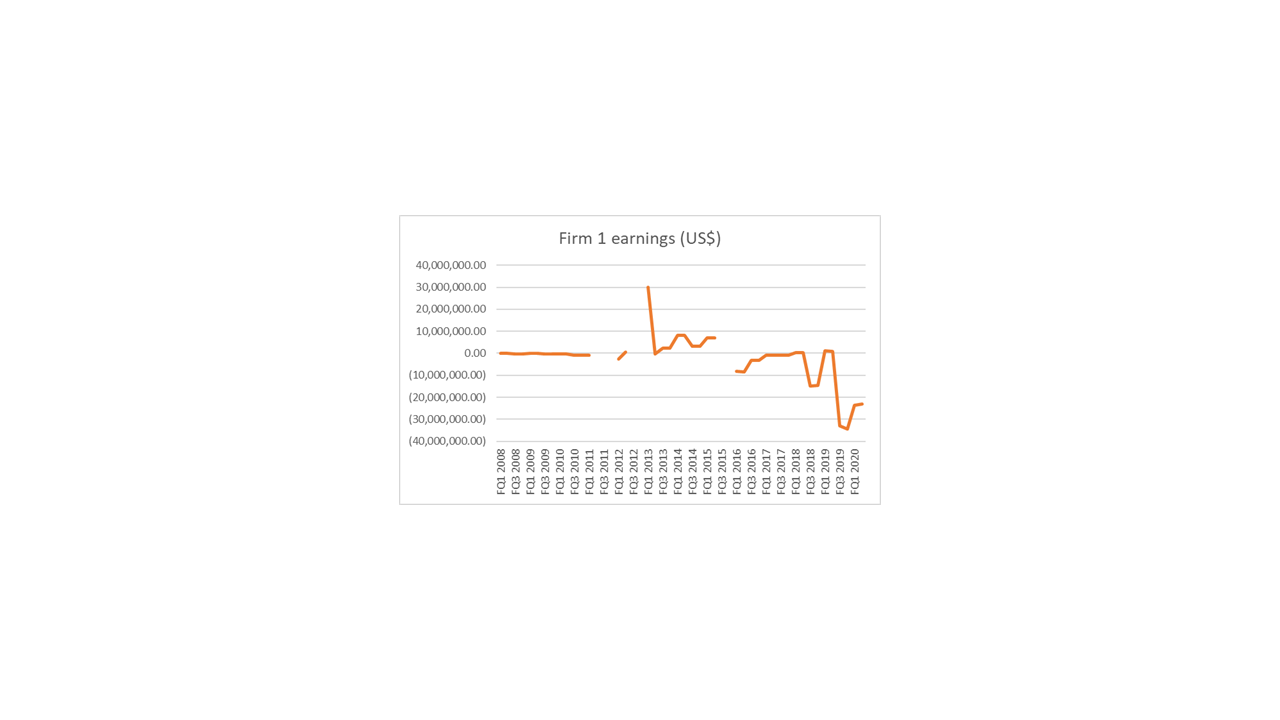
I just wanted to get your advice on something (yet again!). I’m in the process of calculating the differential (quarterly) earnings for several firms over a 13-year period (vs the S&P 500). However, some of the data sets I’m working with have several missing data points. For example, Firm 1 (see time series below) is missing data for Q2 2011, Q3 2011, Q4 2011, Q3 2012, Q4 2012, Q3 2015, and Q4 2015.
I gather that this issue can be dealt with using some form of interpolation. Looking at the time series below, I reckon (based on my rudimentary knowledge of interpolation!) that linear interpolation would be inappropriate in this case. That said, I am still a little unsure as to which form of interpolation would be the most defensible.
If anyone has any thoughts on this, I’d be really grateful for your input.
Cheers,
AdamAttachments:
You must be logged in to view attached files.Please ignore my last question. I’ve found the answer now. Most of you will proabably know this already, but I found the following explanation very helpful:
“(N)ot to be confused with the S&P Composite 1500…(t)he
composite index is just that, a composition that splices the S&P 500, which started in March 1957, with historical data that included the companies in the S&P 90, founded in 1926, the S&P 233 weekly index dating from 1923, and earlier market data painstakingly gathered by Alfred Cowles. Cowles used family money to found the Cowles Foundation and was responsible for collecting comprehensive US stock data from 1871 to 1930. His magnum opus, the 2nd edition of his Common Stock Index was published in 1939 and is now available online in PDF format.The S&P Composite has been popularized by Yale Professor Robert Shiller, and an Excel copy of the data, updated monthly, is maintained at his Yale website.”
Cheers
Hi all,
I just wanted to pick your brains about something. I’m looking for earnings data for the S&P 500 (going back 10-15 years or so). Although I have access to Rober Shiller’s data (www.econ.yale.edu/~shiller/data.htm), I’m a little confused as to what this data represents.
What’s confusing me is that I’ve seen Shiller’s referred to as pertaining to both the “S&P Composite” AND the “S&P 500”. However, according to the S&P website the S&P 500 and the S&P Composite (1500) are separate indexes- the former representing the 500 largest corporations, the latter “combining three leading indices, the S&P 500®, the S&P MidCap 400®, and the S&P SmallCap 600®, to cover approximately 90% of U.S. market capitalization.”
https://www.spglobal.com/spdji/en/indices/equity/sp-500/#overview
https://www.spglobal.com/spdji/en/indices/equity/sp-composite-1500/#overview
So, basically, what I’m asking is whether Shiller’s earnings data (at least that covering the period 2010-2020) represents the S&P 500 (or something else)?
Thanks in advance,
AdamThanks DTC. I’m a little surprised that nobody has tried marrying the two before. But then again, I suppose the CasP approach hasn’t been around that long. I definitley agree with you that ethnography has the potential to be a powerful tool for exploring the stories that lie behind the aggregates. Let’s wait and see!
Thank you DTC. That’s really helpful!
One thing I’ve been meaning to ask: Does anyone know of any CasP research that combines quantitative analysis of differential accumulation with ethnographic methods?
Thanks,
Adam
Thank you Jonathan and Blair! Your explanations/clarifications re the benefits of log scale versus linear scale have been really helpful (and much appreciated!).
And hats off to whoever came up with the idea for this forum! It’s such a fantastic initiative. I doubt my rash forays into CasP land would have ever got this far had it not been for this platform (and its helpful users).
Cheers,
AdamThanks Jonathan. That’s really helpful.
Regarding your point about using linear scale in situations where log would be ‘counterproductive’; can you think of any examples where this would be the case (i.e. where using log scale might be counterproductive)?
Cheers,
Adam
-
AuthorReplies