Why America Won’t Be ‘Great’ Again
May 24, 2021
Originally published on Economics from the Top Down
Blair Fix
They called him the ‘Little Emperor’. Romulus Augustus — better known as Romulus ‘Augustulus’ (‘Little Augustus’) — was the last Western Roman Emperor. He assumed the throne at the age of 16 during a period of unprecedented strife. There had been 8 emperors in the previous 20 years. Like his predecessors, the Little Emperor’s reign was short. It lasted less than a year. In 476 CE, Augustus was deposed and the Western Roman Empire came to an end.1
One wonders what Augustus said to his followers during his reign. As little more than a proxy for his military-general father, Augustus left no monuments and made no decisions. But what might he have said in private? Perhaps he promised to ‘make Rome great again’. …
✹ ✹ ✹
We are perennially fascinated with the rise and fall of the Roman Empire. Why? Likely because its collapse cast such a long shadow on Western Europe. Once the center of civilization, the Roman collapse sent Western Europe into a dark age. It would take a millennia to recover.
Interestingly, the Roman elite seemed to be the last to recognize the empire’s decline. True, during Augustus’ reign the elite probably knew that the empire was a shadow of its former self. But elites were too busy squabbling over power to care much for the long arc of history. In their eyes, a return to Roman ‘greatness’ was probably forever on the horizon.
Perhaps the best characterization of this elite attitude comes not from history, but from science fiction. In his Foundation trilogy, Isaac Asimov imagines a galactic empire that sits on the verge of collapse. Scientist Hari Seldon sees the writing on the wall. But the leaders of the galactic empire do not. They’re too busy squabbling amongst themselves.
This lack of elite awareness, I’d guess, is a general rule. As empires collapse, elites are usually the last to know. Take Donald Trump. As the US empire slowly declines, Trump promises to restore America to its imperial heights. He’ll ‘Make America Great Again’. Like most elites, Trump is too busy gripping power to see the writing on the wall.
What is this writing? And how can we read it?
In Asimov’s Foundation, Hari Seldon uses ‘psychohistory’ to predict the galactic empire’s impending collapse. A kind of statistical mechanics for humans, psychohistory is the social scientist’s dream. It predicts with uncanny accuracy the course of humanity. Sadly, psychohistory doesn’t exist, nor will it likely ever exist. So we’re forced to find a more crude window into empire’s rise and fall. That window will obviously be history. But what is the language?
The history of empire, I argue, isn’t written in the speeches and proclamations of elites. Instead, it’s written in the language of energy. Although the motivations for empire building differ between societies, the end result is always the same. A successful empire centralizes the flow of energy. This means that energy use (per person) in the empire’s core will dwarf energy use in the periphery. The degree that this is true marks the degree that the empire is successful.
Energy use, then, provides a window into the rise and fall of empires. Let’s look through this window and see what we find.
The rise and fall of Western civilization
We’ll look first at the grandest scale of all — the 10,000-year history of civilization. Permanent settlements first arose in the Mediterranean basin in an area that anthropologists call the ‘Levant’. It was here that agriculture started. And it was here that agriculture was first intensified using irrigation. Not surprisingly, the Levant was where the first empires emerged.
The rise and fall of these proto-empires should be written in the language of energy. Unfortunately, the ‘book of energy’ has long since been lost. The first civilizations kept few written records. And most of their physical artifacts have been destroyed. So how can we estimate the energy use of early empires? We make an educated guess.
That’s exactly what Ian Morris does in his book The Measure of Civilization. Morris estimates energy use in antiquity. His results are fascinating, so I’ll present them here. But keep in mind that Morris’ data is less of a measurement and more of a back-of-the-envelope guess. Over the whole of antiquity, Morris estimates energy use in both the ‘West’ and the ‘East’. By ‘West’ Morris means the basin of civilization in the Mediterranean. By ‘East’, he means the basin of civilization in China.
What I do here is simply divide the two series. I compare energy use in the ‘West’ relative to in the ‘East’. This ratio gives us a window into the rise and fall of Western empire. The greater the energy ratio between West and East, the more successful is Western empire. I’ve plotted this ratio in Figure 1. The rise and fall of the West is unmistakable.

I’ll start by acknowledging the scale of history shown in Figure 1. It covers some 15,000 years — a period so long that it’s hard to grasp. To get some perspective, the entirety of industrial society covers just 1% of this time.2
Let’s go back to the beginning of civilization. After a hundred thousand years (or more) of living as hunter gatherers, humans started to farm. This happened first, we think, in the Mediterranean. We can see this Promethean event written in Morris’ energy data. Some 14,000 years ago, energy use in the ‘West’ started to pull away from energy use in the ‘East’. To give you some perspective on this timeline, I’ve marked in Figure 1 some important historical events. Dates are obviously approximate. (Note: I’ve used the ‘common era’ dating system. Negative years indicate ‘BCE’. Positive years indicate ‘CE’.)
Around 9,000 BCE, relative energy use in the ‘West’ peaked and began to slightly decline. While we should treat this peak with appropriate uncertainty (the data behind it are rough guesses), it has a simple explanation. It’s around this time that farming started in the East. So the relative gains of the West, where farming first arose, began to level off.
Then around 5,000 BCE, the West again began to boom. The first city (Uruk) was born, as was the forging of bronze. And for the first time, language was written down. This boom coincides, unsurprisingly, with the dawn of irrigation. Without irrigation, the bounty of agriculture was unpredictable. This made empire-building difficult. If farmers couldn’t reliably feed themselves, they could hardly pay tribute to an imperial power. Irrigation ‘fixed’ this problem by making harvests predictable. As a result, the first empires flourished.
The energy bounty of irrigation, however, was not shared equally. This fact is written in the record of human height. Carles Boix and Frances Rosenbluth find that as civilization arose, average height plummeted. In other words, health and nutrition worsened. But royalty bucked this trend. Kings and queens, Boix and Rosenbluth show, remained tall. This suggests that rulers used the bounty of irrigated agriculture mostly to enrich themselves.
As an example of this inequality, think of ancient Egypt. Rather than share the energy bounty, Egyptian pharaohs built pyramids — colossal monuments to their own vanity. That so much energy could be squandered on something so useless is a testament both to the wealth of these first empires and to the depravity of their rulers.
Back to Figure 1. The pinnacle of Western empire came, interestingly, not with the Romans but far earlier. As written in the language of energy, Western superiority peaked around the time of the Akkadian Empire — roughly 4,000 years ago. This peak has less to do with events in the West and more to do with what was going on in the East. It was around this time that the first Eastern empires emerged. The pinnacle of (relative) Western energy use came as the Xia Dynasty was formed in China. Western empire continued (for instance, with the conquests of Alexander the Great), but the West’s advantage relative to the East slowly declined.
The Roman Empire, which emerged around 2000 years ago, briefly paused this decline. But when the Roman Empire collapsed, Western decline accelerated. It didn’t level off until the depths of the Middle Ages, at which point Europe was a provincial backwater.
With this sprawling history in mind, let’s return to our friend ‘Little Augustus’. As the last Western Roman emperor, what power did Romulus Augustus have to stave off collapse? Likely very little. By the time Augustus assumed the throne, the empire had been in decline for centuries. The exact reasons for this decline are still debated. But the fact that it happened is undeniable. It’s written in the language of energy.
There’s an interesting paradox here. Elites, as a rule, are forward looking.3 Worried about losing their power, elites scheme incessantly about the future. Historians, in contrast, are backward looking. It’s their job to study the past. Yet paradoxically, it’s backward-looking historians who are best equipped to see an empire’s future. The long arc of empire’s rise and fall is evident only when you look at the past. Busy scheming about the immediate future, elites rarely see this long arc of history. And so they rarely anticipate imperial decline.
The rise and fall of the British Empire
A thousand years after the Roman Empire collapsed, Europeans again conquered the world. Millions of words have been spilled trying to understand this return of Western dominance. I won’t add to the noise here. Instead, I’ll be content to watch history happen. Like the rise and fall of the Roman Empire, the rise and fall of European empires is written in the language of energy. Let’s read this ‘energy book’.
In the last 500 years, Europe has had many empires — Portuguese, Spanish, Dutch, French and Russian to name a few. But all of these empires paled in comparison to the British Empire. For most of the 19th century, Britain effectively ruled the world. It created a sprawling, global empire upon which the ‘sun never set’. But, like all empires, the sun eventually did set on the British Empire. In fact, the rise and fall of Britain was more spectacular than the rise and fall of Rome. The British Empire burned more brightly and more briefly.
Figure 2 tells the tale. Here I plot British energy use per capita relative to the average in rest of the world. Britain began, in the 14th century, as an unremarkable nation. When it first colonized North America, Britain consumed roughly the same energy per person as the world average. But that would change.

Not only did Britain conquer the world, it became the world’s first industrial superpower. Britain plundered the resources of the world at the same time that it plundered the coal reserves under its belly. The results were spectacular. From an unremarkable nation in 1600, Britain accumulated so much power that by the late 1800s it was effectively the world’s administrator. This rise is written in the language of energy. At the empire’s peak, the typical Brit consumed about 7 times more energy than the world average. This pinnacle, however, would be short lived.
Before we discuss the fall of the British Empire, I can’t resist framing its rise in terms of the birth of my own discipline, political economy. I’ve marked in Figure 2 the publication of two seminal texts: Adam Smith’s The Wealth of Nations and Karl Marx’s Capital. Both grappled with the changes engulfing British society.
When it comes to empire, Adam Smith is important because he started a long line, in political economy, of imperial apologetics. As empire spread through force and plunder, you could count on the admirers of Adam Smith to see ‘free markets’ everywhere. This worldview was solidified in the ‘marginal revolution’, during which neoclassical economics was born. The timing of this revolution is ominous. Faith in markets was perfected at the height of British imperialism.
Karl Marx, in contrast, saw empire for what it was — a sprawling octopus whose arms sucked resources from the world. A fierce critic of British rule in India, Marx is the father of many anti-imperial schools of thought (like dependency theory and world-systems theory). Marx even recognized the ‘metabolic rift’ in British society that was being driven by industrialization. (Human refuse, for instance, was no longer being returned to the land.) But despite his insight, Marx succeeded in doing the same thing as the neoclassical economists: rather than create a science, he created an ideology. Millions would suffer as a result. (See the discussion of China below.)
Back to Britain’s rise and fall. During its century of dominance, Britain was able to maintain global peace (of a sort). As the unchallenged superpower, Britain acted as the world’s police — a Weberian ‘peacemaker’ that reserved the sole right to use violence. Perhaps paradoxically, this long peace began to unravel as a series of ‘ententes’ were formed.
In hindsight, this is understandable. Strong empires don’t sign peace agreements. They enforce their will unchallenged. So the series of ententes that Britain signed at the turn of the 20th century signaled the weakening of its empire. And this is written in the ‘book of energy’. When Britain signed (with France) the Entente Cordiale in 1904, its energy free-fall had already begun. This fall would continue through two world wars, up to the present. The only interlude was in the 1980s, when Britain briefly exploited a bonanza of oil in the North Sea. But that wouldn’t last. North Sea oil production soon peaked, and the energy free fall continued.
That brings us to Brexit. The Brexit movement is, in many ways, the British equivalent of Donald Trump’s campaign to ‘make America great again’. Brexiters long for a return to British ‘greatness’, recalling a time when Britain was ‘independent’ of Europe. But as many commentators have observed, this return to ‘independence’ is an illusion. Britain was never ‘great’ as an independent nation. It was ‘great’ as an empire. And that empire, it seems, is gone forever.
The Brexit movement won’t bring back the British Empire any more than the ‘Little Emperor’ brought back the Roman Empire. If anything, the Brexit movement is similar to the fracturing of the Roman Empire after Romulus Augustus was deposed. What ensued was not imperial ‘greatness’, but feudal backwardness. Is this what’s in store for Britain? Only time will tell. …
The rise and fall of the American Empire
As the British Empire declined, the American Empire rose. Although unremarkable in many ways, the American Empire is unique in at least one regard. It’s the first empire that denied its own existence. The British celebrated their empire loudly, as did other imperial rulers in history. But Americans bucked the trend. They created an empire, but never called it that. It was merely a ‘sphere of influence’.
Let’s not mince words. Just like the British (and the Romans long before), Americans stationed military garrisons around the world. They created a vast supply chain that brought resources to the United States. And they punished groups that defied American power. That’s empire in everything but name.
Like Britain, the rise and fall of the American Empire is written in the language of energy. But unlike Britain, which declined as rapidly as it rose, the American rise and fall is less spectacular (at least so far).
Before getting to the data, I’ll point out an important difference between Britain and the United States. Britain is an island whose geographic boundaries didn’t change as it conquered the world. That makes estimating energy use per capita fairly straightforward. The US, in contrast, was a colony that expanded its own territory at the same time that it expanded its imperial power. This changing territory makes it more difficult to track energy use per capita. The further back in time we go, the more poorly defined ‘US energy use per capita’ becomes. For that reason, I’m skeptical of some of the energy data that I present here.
Figure 3 shows the rise and fall of the US empire, written in the language of energy. Unlike Britain, the US seems to have risen and fallen twice. The first peak occurred just before the Declaration of Independence — perhaps not coincidentally near the peak of the US slave trade. The second peak happened after World War II.
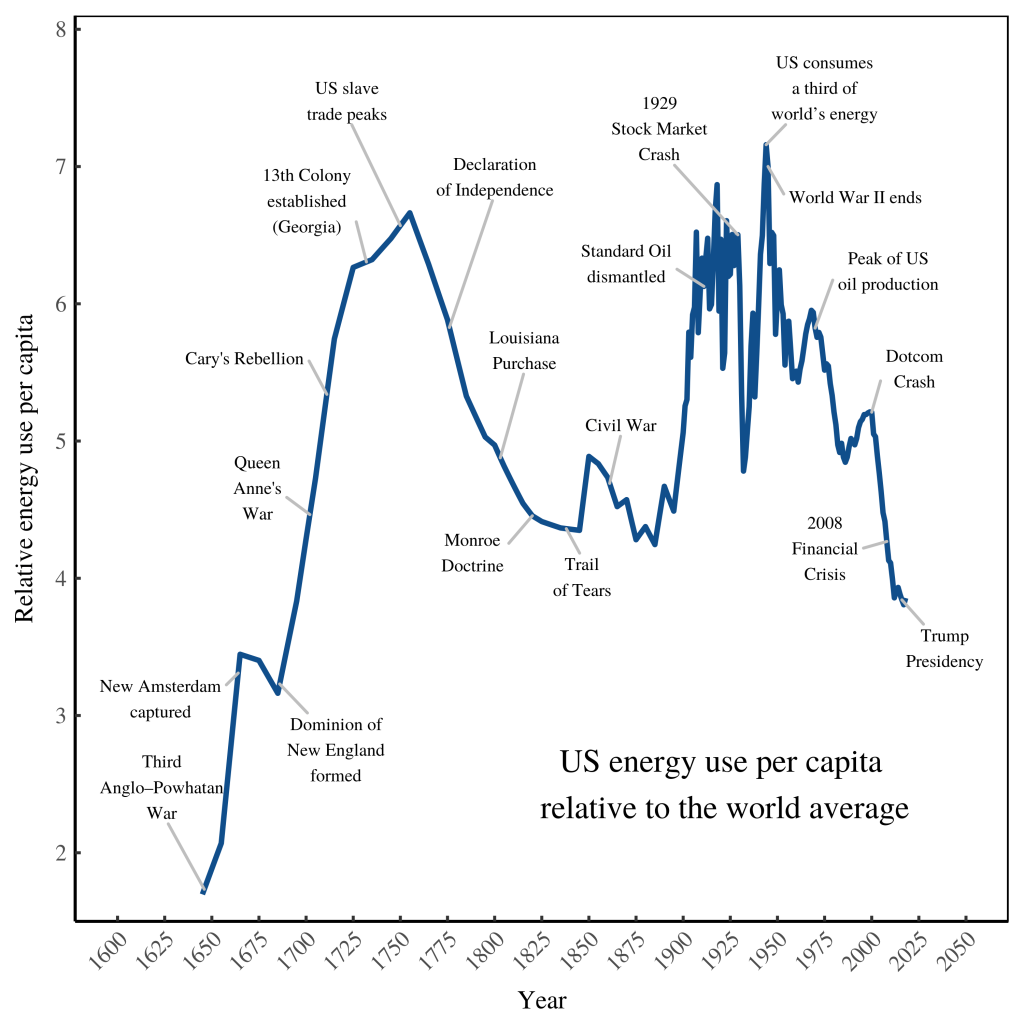
The first peak, I’ll admit, may not have actually happened. Or if it did occur, it may have been less pronounced than shown in Figure 3. The reason I’m skeptical of this first peak is because I don’t have confidence in the underlying data. I estimate energy use per capita by dividing aggregate US energy consumption by US population. The problem is that during colonial times, it’s not clear that the energy data uses the same geographic boundary as the population data. For that reason, I’d mark the first energy peak with an asterisk (* needs independent confirmation).
Data uncertainty aside, let’s look at the energy trends. What seems clear is that from initial colonization, American fortunes rose rapidly, peaking around the time of the Revolutionary War. In other words, at its official birth the United States was already a wealthy society. This is unsurprising. Epoch-making documents like the Declaration of Independence or the US Constitution are rarely forged by impoverished societies. If you’re struggling to feed yourself, you don’t write moral treatises.
The good times of American Independence, however, didn’t last. As Americans conquered the continent, internal tension brewed. This tension is written in the language of energy. From its peak at American independence, relative US energy consumption declined throughout most of the 18th century, reaching a low in the mid-19th century. It’s perhaps not a coincidence that it was then that the Civil War erupted. In his book Ages of Discord, Peter Turchin analyzes the long-waves of American social stability. His waves match (at least roughly) what’s written in the energy data. Turchin finds that social stability peaked after independence, but reached a trough by the Civil War. Stability rose again during the good times after World War II. But today, social stability is on the decline.
Back to the energy data. After the quagmire of civil war, American fortunes rose again. By the turn of the 20th century, the American empire was in full swing. As revealed by energy consumption, the ‘American century’ lasted roughly 70 years (1900–1970). During this time, the typical American consumed about 6 times more energy than the world average. The peak of US supremacy came during World War II. At the height of its war machine, the US consumed roughly one third of the world’s energy. It’s doubtful that any other society has achieved this feat. And given that fossil fuels are being rapidly exhausted, it’s doubtful that this feat will ever be matched. (Let’s hope it’s not. Fossil-fuel-driven empire is ecologically suicidal.)
As with all empires, the US empire eventually declined. Looking at the energy records, the end of US dominance came around 1970. It was then that the US energy supply became unstable. In 1970, US oil production peaked. And geopolitical events made importing oil more difficult. Unhappy with US foreign policy, the oil cartel OPEC decided to limit the taps. As a result of both events, relative US energy use began to fall. This decline was halted, briefly, during the boom of the 1990s. But then the dotcom bubble burst, and the energy slide continued. Today, it shows no signs of stopping.
That brings us to Donald Trump. In hyperbolic fashion, Trump promises a return to American ‘greatness’. But it’s a return that, in all likelihood, will never happen. The pinnacle of US empire has long passed. Like ‘Little Augustus’, Donald Trump commands an empire in decline. He shouts loudly, but on a shrinking American stage. For that reason, it would be fitting to call him the ‘Little Emperor’.
The fall and rise of the Chinese Empire
No story of empire would be complete without discussing the rising power. Today that’s China. Unlike Britain and the US, the story of Chinese empire is not of rise and fall, but of fall and rise.
During the Middle Ages, China was the center of world civilization. But with the European renaissance, that would change. In the 19th century, Europe colonized China (although never as completely as it colonized neighboring India). Colonization eventually ended in the 20th century with the Chinese communist revolution. But this revolution didn’t end Chinese suffering. If anything, it exacerbated it. Still, China eventually emerged as an industrial power. In the last 40 years, its transformation has been remarkable. And the whole story is written in the ‘book of energy’.
Figure 4 tells the tale. We begin in 1700, at the pinnacle of the Qing Empire. At this time, Britain was just starting to industrialize. To guard its domestic industry, Britain banned the import of Asian textiles. (This use of protectionism to industrialize is a repeated feature of history. See Ha-Joon Chang’s Bad Samaritans for details.) By 1800, European dominance was in full swing, and relative energy use in China started to decline. Still, the Qing Empire ruled roughly a third of the world’s population.
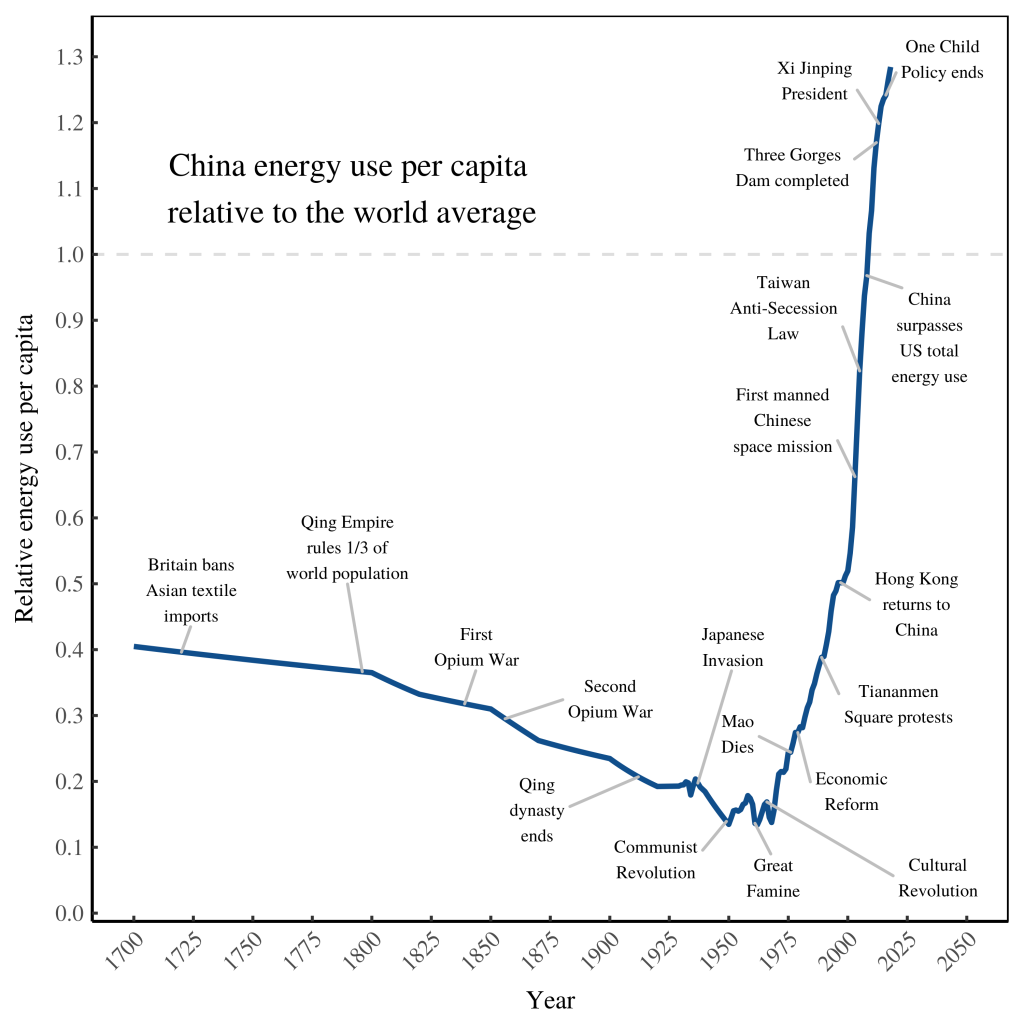
In the mid-19th century, Britain and France sought to colonize China and engaged in a series of Opium wars. By the early 20th century, the Qing dynasty collapsed, and China was sent into political turmoil. It’s relative decline continued.
Interestingly (but perhaps not surprisingly), the Chinese Communist revolution happened as China’s fortunes hit rock bottom. It’s worth pausing here for a theoretical note. In his theory of social transition, Karl Marx predicted that communist revolutions would happen in the most ‘developed’ capitalist societies. He was wrong. All of the communist revolutions in the 20th century happened in relatively peripheral societies. Communist revolutionaries didn’t overthrow industrial capitalists, as Marx foresaw. Instead, they did away with agrarian aristocrats. This put revolutionaries in charge of managing industrialization.
The problem for the revolutionaries was simple. Farmers didn’t share their central-planning ideology. This meant that communist leaders had to force change. And so they did. Like Stalin before him, Mao forced Chinese farmers to collectivize. He proclaimed a ‘Great Leap Forward’. But the result was a perverse type of ‘greatness’ — the ‘Great Chinese Famine’. Mao’s politically induced famine was perhaps the most devastating in human history. As many as 40 million people may have died. It’s worth remembering this fact when we read Marx. When put in action, Marx’s ideology plumbed the depths of depravity.
Although it hardly speaks to the extent of Chinese suffering, the Great Famine is written in the ‘book of energy’. It appears as an energy trough around 1960. After this trough, Mao would proclaim another revolution — the ‘Cultural revolution’. China’s fortunes began to rise. But the greatest changes would come after Mao’s death. When Mao died, the Chinese government abandoned hardline command and control. Instead, it let (big) firms take some of the economic reigns. After this reform, the growth of Chinese energy use was spectacular.
Notice, however, that Chinese energy consumption has only recently surpassed the world average. Today, the typical Chinese citizen consumes about 1.3 times more energy than the world average. While China is on the rise, it has yet to catch up to the fading imperial power, the United States. Today, the typical American consumes about 3.8 times more energy than the world average. Although the US is in relative decline, it’s still a far wealthier nation (on average) than China.
This picture would change, though, if we focused on the center of Chinese power — cities like Shanghai and Beijing. That’s because China is marked by a great urban-rural divide. In 2012, Chinese urbanites earned about 300% more than their rural counterparts. In contrast, American urbanites earn only 36% more than their rural counterparts.4 This divide means that speaking about ‘average Chinese energy use’ is misleading. Some Chinese live much like modern Americans. Others live more like Americans of the 18th century. In the language of world-systems theory, we’d say that China ‘includes its own periphery’.
There’s another caveat to Figure 4 that arise from mathematics. China accounts for roughly a fifth of world population. Mathematically, it’s difficult for the energy use of such a large nation to pull away from the world average. Why? Because as its energy use increases, it pulls the world average up with it.5
Caveats aside, it’s undeniable that Chinese empire is on the rise. When the peak will come is difficult to predict. But the evidence suggests we’re headed for a ‘Chinese century’.
Greatness without empire
The rise and fall of empire is written in the language of energy. But we shouldn’t mistake imperial ‘greatness’ for human well-being. True, well-being is correlated with energy exploitation. But only to an extent. Other social factors also matter — fair access to healthcare and education to name a few.
As empires decline, citizens should be aware of two things. First, their imperial ‘greatness’ is probably gone forever. Second, there are other ways to be ‘great’. A society can be ‘great’ not by conquering the world, but by becoming sustainable and equitable. But unlike imperial power, this alternative type of ‘greatness’ won’t be built by elites. Like always, elites are too busy squabbling over power to see the writing on the wall. But this time the writing signals a warning not just for one empire, but for the whole of humanity: become sustainable or risk collapse. It’s up to us to make the sane choice.
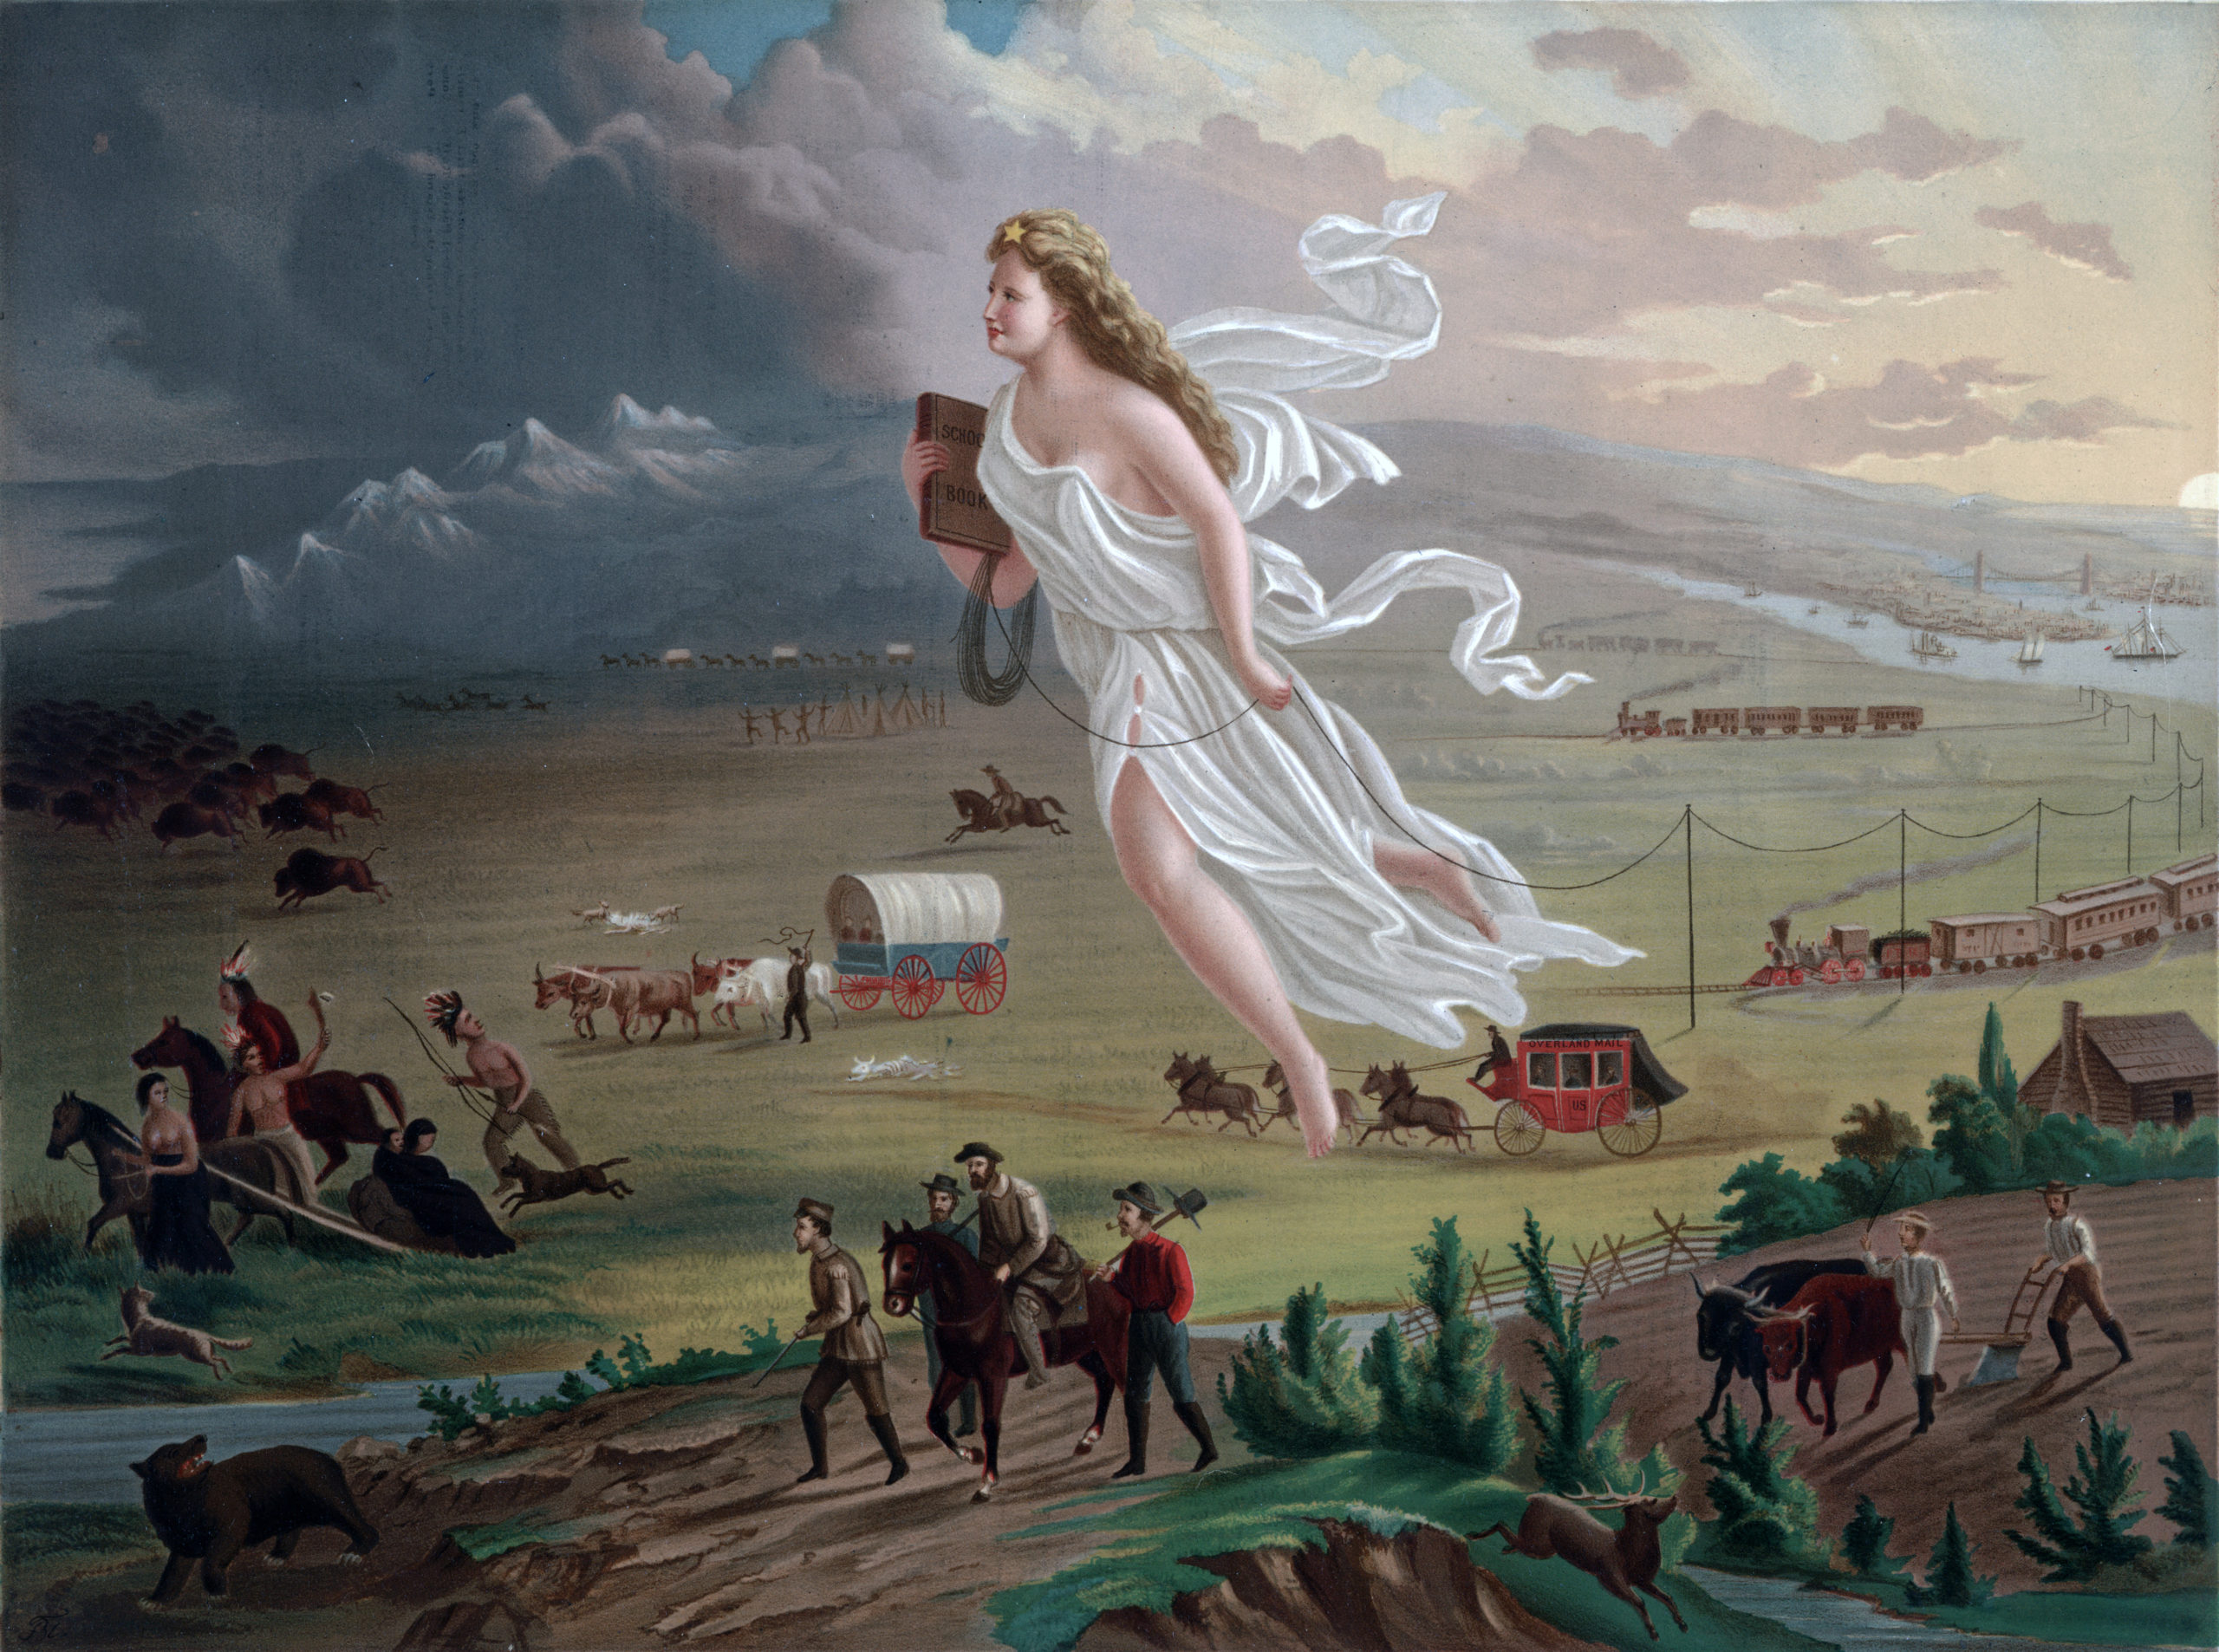
[Cover image: John Gast]
Sources and methods
World
Energy data comes from:
-
1965–2018: BP Statistical Review of World Energy, 2020
-
1820–1960: Appendix in Vaclav Smil’s Energy Transitions: History, Requirements, Prospects
-
15,000 BCE–1800 CE: Ian Morris’ The Measure of Civilization. I calculate world energy use per capita by averaging Morris’ estimates for energy use in the ‘West’ (Table 3.1) and ‘East’ (Table 3.4), weighted by population. I use Angus Maddison’s population estimates (see below). I assume the ‘West’ consists of Maddison’s series for ‘Western Europe’ and the ‘East’ consists of Maddison’s series for China, India and Indonesia.
Population data comes from:
-
1960–2018: World Bank series SP.POP.TOTL
-
1 CE–1960: Angus Maddison’s Statistics on World Population, GDP and Per Capita GDP, 1-2008 AD
To calculate energy use per capita from 1820 CE to 2018 CE, I divide world energy use by world population. Morris’ pre-1800 energy data is already expressed in per capita terms. The various datasets aren’t consistent with one another. To make a continuous series, I splice the data together backwards in time, keeping the BP series at their original values. Then I interpolate linearly within the series to get estimates in each year.
Ancient East and West
Estimates for energy use per capita come from Morris Table 3.1 and Table 3.4.
Britain
Energy data comes from:
-
1965–2018: BP Statistical Review of World Energy, 2020
-
1560–1965: Paul Warde’s Energy Consumption in England & Wales: 1560–2000
Population data comes from:
-
1965–2018: World Bank series SP.POP.TOTL
-
1560–1965: Paul Warde’s Energy Consumption in England & Wales: 1560–2000
I calculate energy use per capita by dividing energy use by population. I splice the data series together by indexing the Ward series to the BP/World Bank series in 1965.
United States
Energy data comes from:
-
1965–2018: BP Statistical Review of World Energy, 2020
-
1949–1964: EIA Annual Energy Review, Table 2.0
-
1900–1948: Benjamin Warr’s REXS database.
-
1635–1900: Appendix E1 in the EIA 2009 Annual Energy Review (see archive here)
Population data comes from:
- 1960–2018: World Bank series SP.POP.TOTL
- 1790–1959: Historical Statistics of the United States, series Aa6–8
- 1630–1780: Historical Statistics of the United States Volume 2, page 1168
I calculate energy use per capita by dividing energy by population. I then splice the resulting per capita series backwards in time, keeping the BP data at their original values.
China
Energy data comes from:
-
1965–2018: BP Statistical Review of World Energy, 2020
-
1 AD–1964: To my knowledge, there’s no good data on China’s energy use prior to 1965. Here’s my solution. I plug my nose and look at the correlation, in the World Bank data, between international energy use and ‘real’ GDP. I regress this relation and then use the equation to estimate China’s energy use from Angus Maddison’s estimates of China’s GDP. Obviously this estimate must be treated with caution.
Population data comes from:
-
1960–2018: World Bank series SP.POP.TOTL
-
1 CE–1960: Angus Maddison’s Statistics on World Population, GDP and Per Capita GDP, 1-2008 AD
I splice the Maddison/World Bank estimates to the BP series.
Notes
-
By convention, Romulus Augustus is treated as the last Western Roman Emperor. The Eastern Roman Empire continued long after Augustus. And there were a few people who, after Augustus, proclaimed themselves ‘emperor’ of the West. But none were widely recognized.↩
-
I assume here that the industrial era covers roughly 200 years, which is roughly 1% of the 15,000-years period shown in Figure 1.↩
-
On the ‘forward-looking’ worldview of elites, Shimshon Bichler and Jonathan Nitzan note another paradox. It’s impossible to ‘look’ into the future (it hasn’t happened yet). This means that the ‘forward-looking’ worldview of elites is, in reality, backward looking. But unlike historians who are concerned with the long arc of history, elites look ‘forward’ by analyzing the recent past. For modern elites, the most important element of the recent past is the motion of the stock market. For more details, read Bichler and Nitzan’s A CasP Model of the Stock Market.↩
-
According to 2018 census data, US urban dwellers (those in ‘Metropolitan Statistical Areas’) had an average income of $52,245. Rural dwellers had an average income of $38,338.↩
-
We could solve this mathematical problem by comparing China to the rest of the world (excluding China). But since I haven’t done this for the US or Britain, I won’t do it for China.↩
Further reading
Bichler, S., & Nitzan, J. (2016). A CasP model of the stock market. Real-World Economics Review, (77), 119–154.
Boix, C., & Rosenbluth, F. (2014). Bones of contention: The political economy of height inequality. American Political Science Review, 1–22.
Chang, H. (2008). Bad samaritans: The myth of free trade and the secret history of capitalism. Bloomsbury Pub Plc USA.
Morris, I. (2013). The measure of civilization: How social development decides the fate of nations. Princeton: Princeton University Press.
Smil, V. (2010). Energy transitions: History, requirements, prospects. Santa Barbara: Praeger.
Turchin, P. (2016). Ages of discord: A structural demographic analysis of American history. Chaplin, CT: Beresta Books.
Warde, P. (2007). Energy consumption in England & Wales, 1560-2000. Consiglio nazionale delle ricerche, Istituto di studi sulle societa del Mediterraneo.