The Ritual of Capitalization
June 16, 2022
Originally published at Economics from the Top Down
Blair Fix
There’s something mysterious about finance. The symbols are arcane. The math is complex. The practitioners are impressively educated. And the stakes are high. All of this gives finance the veneer of higher truth — as if quants are uncovering a reality not accessible to the rest of us. In a sense they are. But the ‘reality’ is not what you think.
When you look at stock-market numbers, they do point to a truth about the world. But it is a truth not about natural law or of human nature. It is a truth about human ideology. The reality is that finance is a quantitative belief system. At its center is a universal ritual — the ritual of capitalization. It is this ritual that underlies all stock-market numbers.
In this post, we’ll look at the regularities that stem from the ritual of capitalization. They are astonishing in scope — a breathtaking consistency to human behavior. They beg the mind to look for some material basis for their existence. But that is a mistake. The reality is that the regularities of capitalization are an artifact of ideas — a manifestation of capitalist ideology itself. A regularity from ritual.
Giving property a number
The ritual of capitalization starts with the institutional act of exclusion — namely property.1 Property, of course, has a deep history that long predates capitalism. I won’t wade into this history here. Instead, I’ll defer to Jean-Jacques Rousseau’s succinct (but apocryphal) telling of property’s emergence. Property arose when
[t]he first person who, having enclosed a plot of land, took it into his head to say ‘this is mine’ and found people simple enough to believe him …
Putting a fence around something and calling it ‘property’ is step 1 of capitalization. But property alone is not enough. Romans had property. So did most feudal kingdoms. But these societies did not have capitalization. To capitalize property, there is a second step. You must mix property with finance.
The word ‘finance’ evokes a sense of awe — a sense of other-worldly complexity. But at its heart, finance is simple. It is the act of reducing property to a number — a price. Merge property and finance, and you have capitalization. How this merger happened historically is complicated. But let’s again reduce history to an apocryphal story. To paraphrase Rousseau:
Having enclosed a plot of land, the first capitalist took it into his head to put a number on his property and found people simple enough to believe him.
This act of giving property a number, political economists Jonathan Nitzan and Shimshon Bichler observe, is the central ritual of capitalism. It is the ritual of capitalization … and it comes with a problem.
Because ‘capitalization’ is literally just slapping numbers onto property, any number is as good as the next one. My property can be a 23. It could also be a 1023. In other words, property can have any conceivable price. But which price is ‘correct’? Ever since our apocryphal capitalist put a number on his property, capitalists have agonized over this question. ‘What is the true value of my property?’
Like so many human-created enigmas, the scientific answer is that the question has no meaning. Determining the ‘true’ value of property is like discovering the ‘true’ nature of the Holy Trinity. It cannot be done because there is no objective ‘truth’ to uncover — there are only subjective human beliefs. The ‘true nature’ of the Holy Trinity is whatever church clergy define it to be. The same holds for capitalization. The ‘true value’ of property is whatever capitalists define it to be.
This arbitrariness is why capitalists need a ritual.
If you’re going to answer unanswerable questions, there is no better way than through ritual. Think of a ritual as a mystified habit — a repetitive behavior that you reify with significance. As an example, take the ritual of gesturing the cross. It is a reified habit that Catholics use to symbolize both their faith in the Holy Trinity, and to remind them of how the Trinity has been defined (the Father, Son, and Holy Spirit).
Rituals are surprisingly powerful, especially when ingrained during youth. I’ll use myself as an example. During my childhood, my family went to a Catholic church, and I attended Catechism (Sunday school) weekly. I learned all the rituals that are part of Mass. After being ‘confirmed’ as a Catholic at age 13, however, I stopped going to church. The truth is, I’d always been an atheist … I just didn’t know it until adulthood.2 And yet, atheist that I am today, if I hear the words ‘in the name of the Father, Son, and Holy Spirit’, I have the near-irresistible urge to gesture a cross. That’s the power of ritual.
Capitalists have invented a similar ritual, but it is not physical. It is mathematical. Faced with the desire to know the ‘true value’ of their property, capitalists have invented a formula that defines it. A property’s capitalized value is the discounted value of its future income:
In textbooks, this equation is put more succinctly as:
Looking at this equation, Jonathan Nitzan and Shimshon Bichler note something interesting. The formula ostensibly capitalizes property — the stuff that capitalists own. And yet the capitalization equation makes no mention of this stuff. There are no symbols for factories, machines, or infrastructure. Instead, there is only income (E). And that, Nitzan and Bichler observe, is precisely the point. The capitalization ritual tells us how capitalists see the world. Capitalists care not for the things they own. They care about their property rights — their right to earn income by putting up an (institutional) fence.
Because it reflects an ideology, the capitalization formula is delightfully circular. It defines one monetary sum in terms of another. Nothing in science says that the equation should hold. It holds only because we’ve convinced ourselves that it should.
As Nitzan and Bichler see it, the spread of capitalism boils down to the spread of the capitalization ritual. It allows anything and everything to have a capitalized value. Take music. In 2020, Bob Dylan sold his entire song catalogue to Universal for some $300 million. The truth, though, is that Universal didn’t buy songs. It bought income. The copyright on Dylan’s songs ensured a sizable annual income — by some accounts about $4 million per year. Assuming this sum is accurate, Universal capitalized Dylan’s royalties by assuming a discount rate of 1%:
Bob Dylan traded future income (from his property rights) for a lump sum. And Universal traded a lump sum for future income. That’s capitalization in action.
Regularity from ritual
Unsurprisingly, rituals give rise to astonishing regularity. Every Sunday, Catholics gesture the cross. Five times a day, Muslims bow towards Mecca. Regularity from ritual. Like these religious rituals, the secular ritual of capitalization gives rise to astonishing regularities. Let’s have a look at them.
We’ll start by noting that capitalization is defined only when property changes hands. Put another way, capitalized value is contested until property is sold. Take, as an example, Donald Trump. He proclaims daily that his property is worth billions. Critics counter that Trump’s empire is worth far less. Neither side is correct. Capitalized value is undefined until the property is sold. If tomorrow, Trump sold his business for $1 billion, that would be its capitalized value.
In the past, capitalization was poorly defined because property changed hands rarely. An aristocratic family, for instance, might run a merchant business for many generations without ever knowing its capitalized value. Today things are different. That’s because in modern capitalism, partial ownership has become the norm. Portions of firms are bought and sold every second, which means we know capitalized value with exquisite detail.
Take Amazon as an example. The business is preposterously large, employing about 1.2 million people. And yet the unit of ownership — the Amazon share — is minuscule. One Amazon share buys you about 2 billionths of the company. Because the unit of ownership is tiny, it is trivial to buy and sell. The result is that unlike aristocratic businesses that changed hands once a century, Amazon shares change hands every second. As such, Amazon’s capitalized value is known exactly. As of May 28, 2021, it was:
That’s nice. But why is Amazon capitalized at $1.6 trillion? The answer is that the company has a massive income stream — its profits in 2020 were $21 billion. Discount that income at 1.3% and you get Amazon’s capitalized value:
Next question. Where did the discount rate of 1.3% come from? The answer: out of thin air. Like the capitalization ritual itself, the discount rate is whatever we define it to be. Capitalists employ the capitalization ritual by ritualistic choosing a discount rate that they deem ‘proper’. Ritual within ritual.
Yes, the whole endeavour smacks of arbitrariness. But that is the nature of ritual. What is important is the regularity to which the ritual gives rise. This regularity is not visible when looking at a single firm. It’s only by looking at thousands of firms that you can see it. On that front, let’s turn to Figure 1.
I’ve plotted here data for the profit and capitalization of US public firms dating back to 1950. Each point is a firm in a given year. (There are about 200,000 observations in total.) From this sea of firms, the regularity of capitalization is unmistakable. Capitalization is proportional to profit discounted at a rate of 7%.
Regularity from ritual.

The discount rate
Is there something special about the discount rate of 7%? The answer is yes and no. That rate is special in the sense that it’s what US capitalists have deemed to be ‘proper’. But this rate is banal in the sense that it has no deeper meaning. US capitalists discount at 7% because that is the norm they have accepted. Gesture the cross. Discount at 7%. Regularity from ritual.
How does this regularity come to exist? In the past, it was by decree. Much like how church clergy decreed the nature of the Holy Trinity, they decreed the ‘proper’ rate of discount:
Until the emergence of capitalization in the fourteenth century, [the ‘proper’ discount rate was] seen as a matter of state decree, sanctioned by religion and tradition, and modified by necessity. The nobility and clergy set the just lending rates as well as the tolerated zone of private divergence, and they often kept them fixed for very long periods of time.
Today, the ‘proper’ discount rate still has an element of decree. Governments (via central banks) set the benchmark interest rate, which in turn affects the benchmark discount rate on equity.
If you’re a finance outsider, you may be wondering what the interest rate has to do with discounting. The two rates are related because the principle of capitalization is the reverse of the principle of interest. Here’s an example. Suppose you put $100 in your savings account at 5% interest. In a year, you’d have $105. Now ask yourself — how much would you pay now to receive $105 in a year? The answer, if you’re a ‘rational’ capitalist, is $100. That’s the sum that would earn $5 when put in a savings account for a year. So by thinking about interest, you’ve capitalized a $5 future income at $100.
Although the principle of discounting stems from the principle of interest, the two rates (benchmark discount and interest) are not the same. This we can see from history. But before we get to the data, let’s think a bit more about the discount rate. Here’s some simple math. Start with the capitalization equation:
Now rearrange for the discount rate r:
The second equation defines the ‘effective’ discount rate at which investors capitalize income. I call it the ‘effective’ rate because the capitalization ritual is technically about future income, which is unknown. In practice, capitalists pin down earnings E by looking at the recent past (i.e. the last quarterly income report). Assuming this habit, the effective discount rate is the ratio of present income and present capitalization.
For an example calculation, let’s return to Amazon. Last year, the company raked in $21 billion in profits. And today, its market cap is about $1.6 trillion. So Amazon is currently capitalized at an effective discount rate of 1.3%:
This effective discount rate varies between firms. And it varies within firms over time. Let’s have a look at this variation.
The benchmark discount rate
We’ll start with the benchmark discount rate. I define this benchmark as the average of the effective discount rate across all firms.
The math: to calculate the benchmark discount rate, we first take every public firm (with available data) and divide income by capitalization. That gives the effective discount rate for each firm in a given year. The benchmark rate is then the average across all firms in that year. (Because we’re dealing with growth rates, I calculate the average using the geometric mean.)
Figure 2 shows how the US benchmark discount rate varied over the last 70 years. It oscillated around the average rate of 7%. But there are conspicuous departures from this average. In the mid 1970s, for instance, the benchmark rate soared to a high of 20%. What happened then?
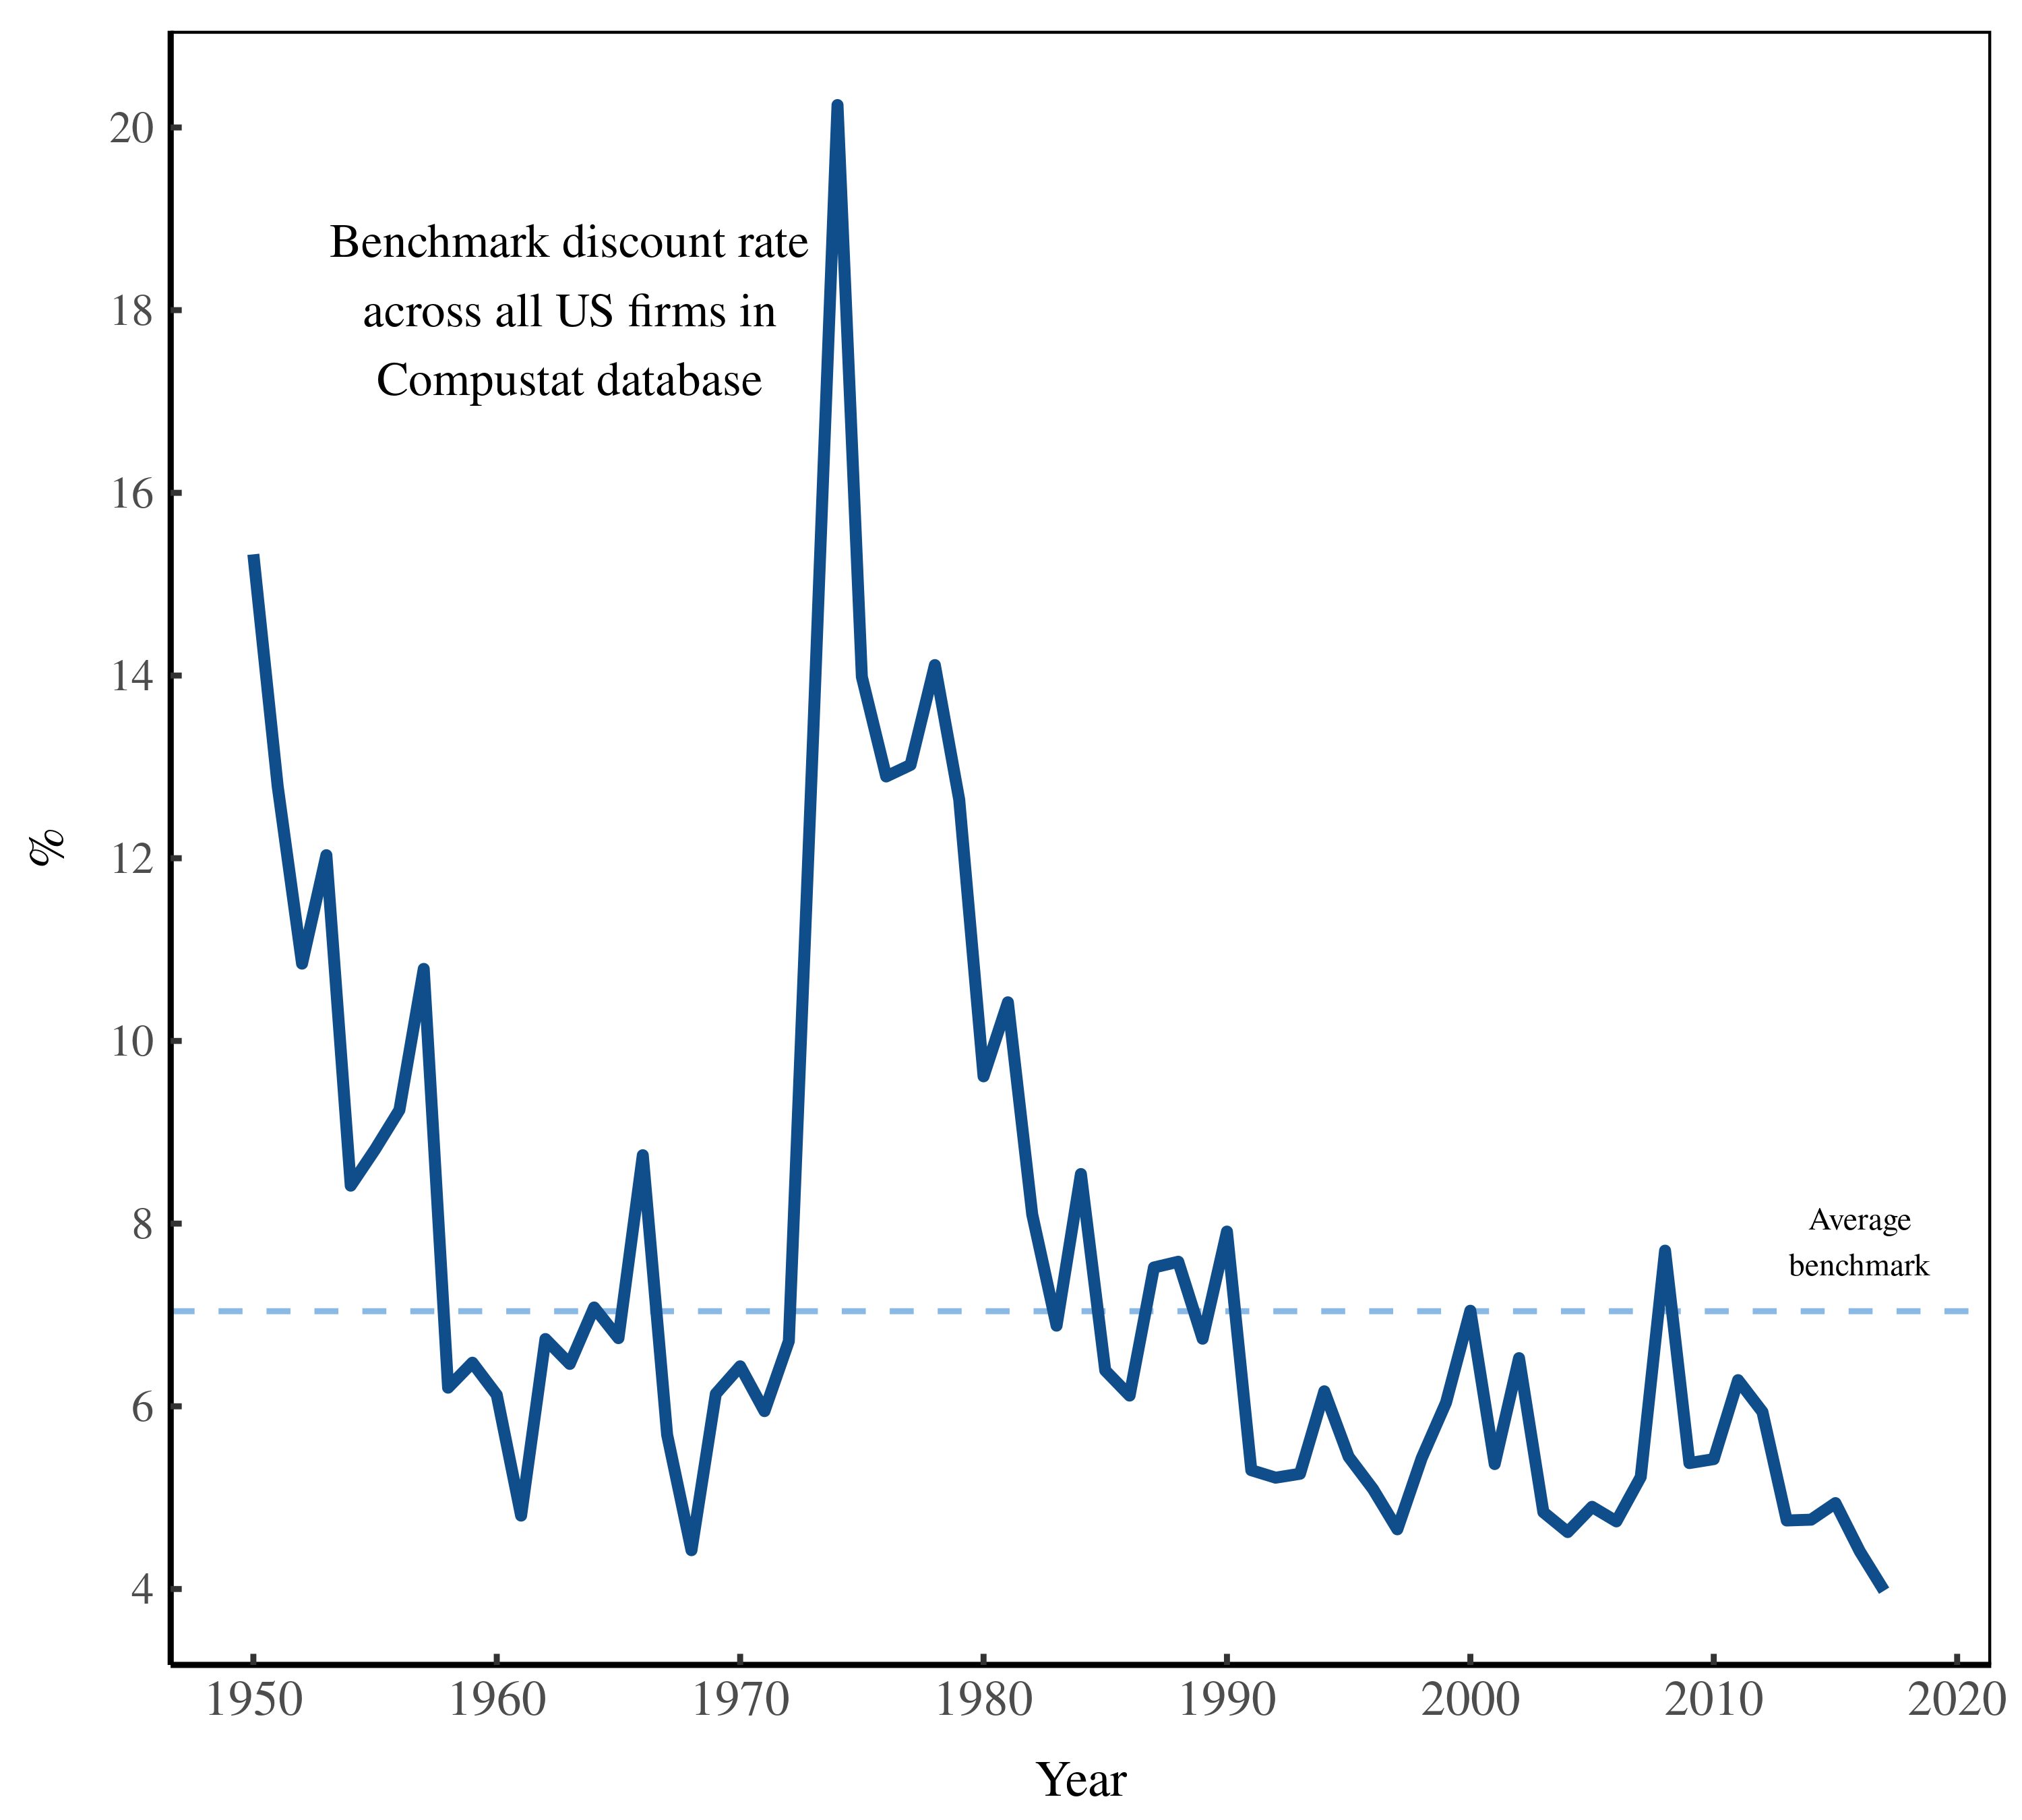
Given that the principle of capitalization works by reversing the principle of interest, one might think that the benchmark discount rate is a simple reflection of the rate of interest. If so, the discount-rate spike in the 1970s should correspond with an interest-rate hike.
While reasonable, it turns out that this expectation is wrong. Figure 3 tells the story. Here I compare the benchmark discount rate to US interest rates. (I’ve used the US Federal Reserve interest rate — the so-called ‘effective federal funds rate’. This is the interest rate at which banks trade money with the Federal government. It sets the benchmark for all other interest rates.)
We can in see in Figure 3 that interest rates did spike in the past. But the hike came about 7 years after the spike in the discount rate. Clearly, then, interest rates are not driving how US capitalists discount income. To understand capitalists’ herd behavior, we must look elsewhere.

While only loosely related to the rate of interest, it turns out that the benchmark discount rate is related to another rate: the rate of inflation (Fig. 4). The inflation rate is a measure of how rapidly prices tend to rise. Because price change varies by commodity, there is no such thing as ‘the’ rate of inflation. Instead, think of inflation like discounting: it has an average rate surrounded by a sea of deviation.
The most comprehensive measure of the average rate of inflation is called the ‘GDP deflator’. (It measures the average price change of all the commodities included in the calculation of GDP.) In Figure 4, I compare this inflation rate to the benchmark discount rate. The two rates are clearly connected. When the benchmark discount rate spiked in the 1970s, so did the rate of inflation.

Why is the discounting benchmark related to inflation? In a word, uncertainty. Remember that capitalization is the ritual of putting a price on (unknown) future income. Capitalists make this leap of faith by assuming that present income will continue in perpetuity. But that’s a risky assumption, especially when the social order is in turmoil.
Back to inflation. Milton Friedman proclaimed that inflation as ‘always and everywhere a monetary phenomenon’. His slogan is a nice tautology, since anything to do with prices automatically has to do with money. The actual science lies in what Friedman omitted. The reality is that inflation is always differential — some companies raise prices faster than others. That means inflation is always and everywhere a restructuring of the social order. It’s a boon for some firms, a bust for others. This is the inescapable conclusion reached by Jonathan Nitzan after an exhaustive look at the US data.
Far more than just a ‘monetary phenomenon’, then, the inflation rate signals instability in the social order. That instability, it seems, translates into capitalists’ fears about the future. When the price system is more unstable, capitalists discount present income more steeply.
Discount deviation
Let’s back up now and look at the other component to discounting — deviation from the benchmark.
Over the last 70 years, the average (effective) discount rate for US public firms was about 7%. But although the aggregate data shouts this value to us, few individual firms were capitalized at exactly this rate. That’s because like all averages, the benchmark discount rate is a herd behavior that is visible only in aggregate. The effective discount rate for any single firm can vary widely. Let’s have a look at this variation.
Figure 5 plots the distribution of (effective) discount rates for every firm observation in my US dataset. The benchmark rate of 7% jumps out as big central lump in the histogram. But don’t be confused by the tidy bell curve. The horizontal axis here uses a logarithmic scale, which compresses variation. The reality is that some firms are discounted at rates up to 1000%. And other firms are discounted at rates below 0.1%. That’s variation over 4 orders of magnitude. Still, the vast majority of firms — about 90% — are discounted at rates between 1.3% and 25%.

Whenever we have variation, the next step is to look for its source. Why do some firms have a high (effective) discount rate and others a low one? It’s here that things get interesting. Ostensibly, the capitalization ritual has a causal direction that flows from discounted earnings to capitalized value. Investors look at a revenue stream E, pick a discount rate r, divide the two, and poof … get a capitalized value:
There are instances where capitalization works in this simple way — but these instances are the exception, not the norm. The only time capitalization is so simple is when a firm is capitalized for the first time: during its initial public offering (IPO). Before an IPO, the firm opens up its books to let would-be investors see the income stream. Using the capitalization ritual, the firm picks a share price for the launch. From the IPO onward, the stock price floats on the market.
Other than during an IPO, then, the capitalization ritual has an element of circularity. The ritual is ostensibly about capitalizing an income stream. Yet the most known quantity in the ritual is not income, but capitalized value itself. You can know a company’s market cap down to the second. In contrast, the firm’s earnings get reported 4 times a year. So what happens in practice is that investors capitalize income by keeping one eye on capitalization itself. The result is that the discount rate is circularly related to capitalization.
Figure 6 shows the trend. Among US firms, the effective discount rate declines with capitalization. (Note that because I’m comparing capitalization across years, I’ve normalized the data within each year so that the median capitalization in my firm sample is 1.) Around the median market cap, the discount rate is the same as the global benchmark of 7%. But as relative capitalization gets smaller than the median, the discount rate grows. And as relative capitalization gets larger than the median, the discount rate declines.

The same pattern emerges when we look at different time periods separately. In Figure 7, I’ve animated 5-year snapshots of the discount-rate-vs-capitalization data. The trend shifts with time, but the overall pattern is consistent. The effective discount rate declines with capitalization. It seems that US capitalists agree that small-cap investments are riskier than large-cap investments. Hence they discount small-cap firms more heavily.

Earnings risk
I’ve so far portrayed the discount rate as a number that capitalists pull out of thin air. But this portrayal is only partially true. The absolute value of the discount rate is arbitrary, just as is the absolute value of capitalization. I can capitalize my property at 23 or 1023. In isolation, the difference is meaningless. Capitalization, however, does not happen in isolation. And that, observe Nitzan and Bichler, is the whole point. The only reason to have prices is to compare them to other prices. Hence capitalization is meaningful only in relative terms. The same is true of the discount rate.
The relative value of the discount rate quantifies capitalists’ perception of risk. The rationale again has to do with the capitalization ritual itself. The ritual is ostensibly about quantifying the present value of future income. But the way capitalists calculate this value is to assume that present income continues indefinitely. That assumption is risky. And so capitalists try to bake future risk into their ritual. The more risk they perceive, the steeper they discount.
How, then, do capitalists assess future risk? Like all elements of the capitalization ritual, capitalists look to the past. They assess future risk by looking at past risk. On that front, we can see that the decline in the discount rate with capitalization is not arbitrary. It’s firmly grounded in the variability of past income.
Figure 8 shows the trend. It’s a bit complicated to interpret, so let me break down what I’ve done. I start with a firm — say General Motors. I then pick a year (say 1990) and observe GM’s market cap. Then I look at the preceding decade and measure the variability of GM’s profit over that period (1981-1990). I calculate the coefficient of variation of this profit (the standard deviation divided by the mean). Then I do the same operation in every year for which there is a preceding decade’s worth of data for GM. When that’s done, I repeat the whole process for every firm in the dataset. Finally, I analyze the aggregate trend by relative market cap.

Now that you (hopefully) understand the analysis, let’s interpret the results. According to Figure 8, the variability of past profit declines with relative capitalization. In other words, small-cap firms have more past risk than large-cap firms. If capitalists know this fact, then it is sensible to discount small firms more heavily than large firms.
It’s debatable, however, that individual capitalists know much about the aggregate trend plotted in Figure 8. Instead, it’s more likely that they rely on rules of thumb — something like ‘venture capital is more risky than blue-chip capital’. This rule then gets baked into the capitalization ritual as a sub-ritual: discount small firms more heavily than large firms.
Capitalizing markup
Continuing the theme of rituals within rituals, let’s look at another aspect of capitalization: the markup. We start with the capitalization formula:
Here, E is the firm’s net earnings — what the non-corporate laity call ‘profit’. Now ask yourself, how can you earn a profit? To think about this question, consider the following equation:
According to this equation, there are two routes to more profit:
- increase sales (gross income)
- increase profit as a portion of sales (the markup)
The two routes to profit are very different. When you increase sales alone, everyone gets more income in the same proportion. Wages and profits increase at the same rate, so their share of the pie remains constant. This is not true, however, when you increase profit using the markup. When you fatten the markup, a greater portion of gross income goes to the firm’s owners, leaving less for workers (and for other firms).
Looking at our basic capitalization equation, we can see that it says nothing about how profits are earned. All that matters is their size (net earnings, E). But when investors apply the capitalization ritual, it turns out that they do have a profit preference. Investors prefer to capitalize a high markup.
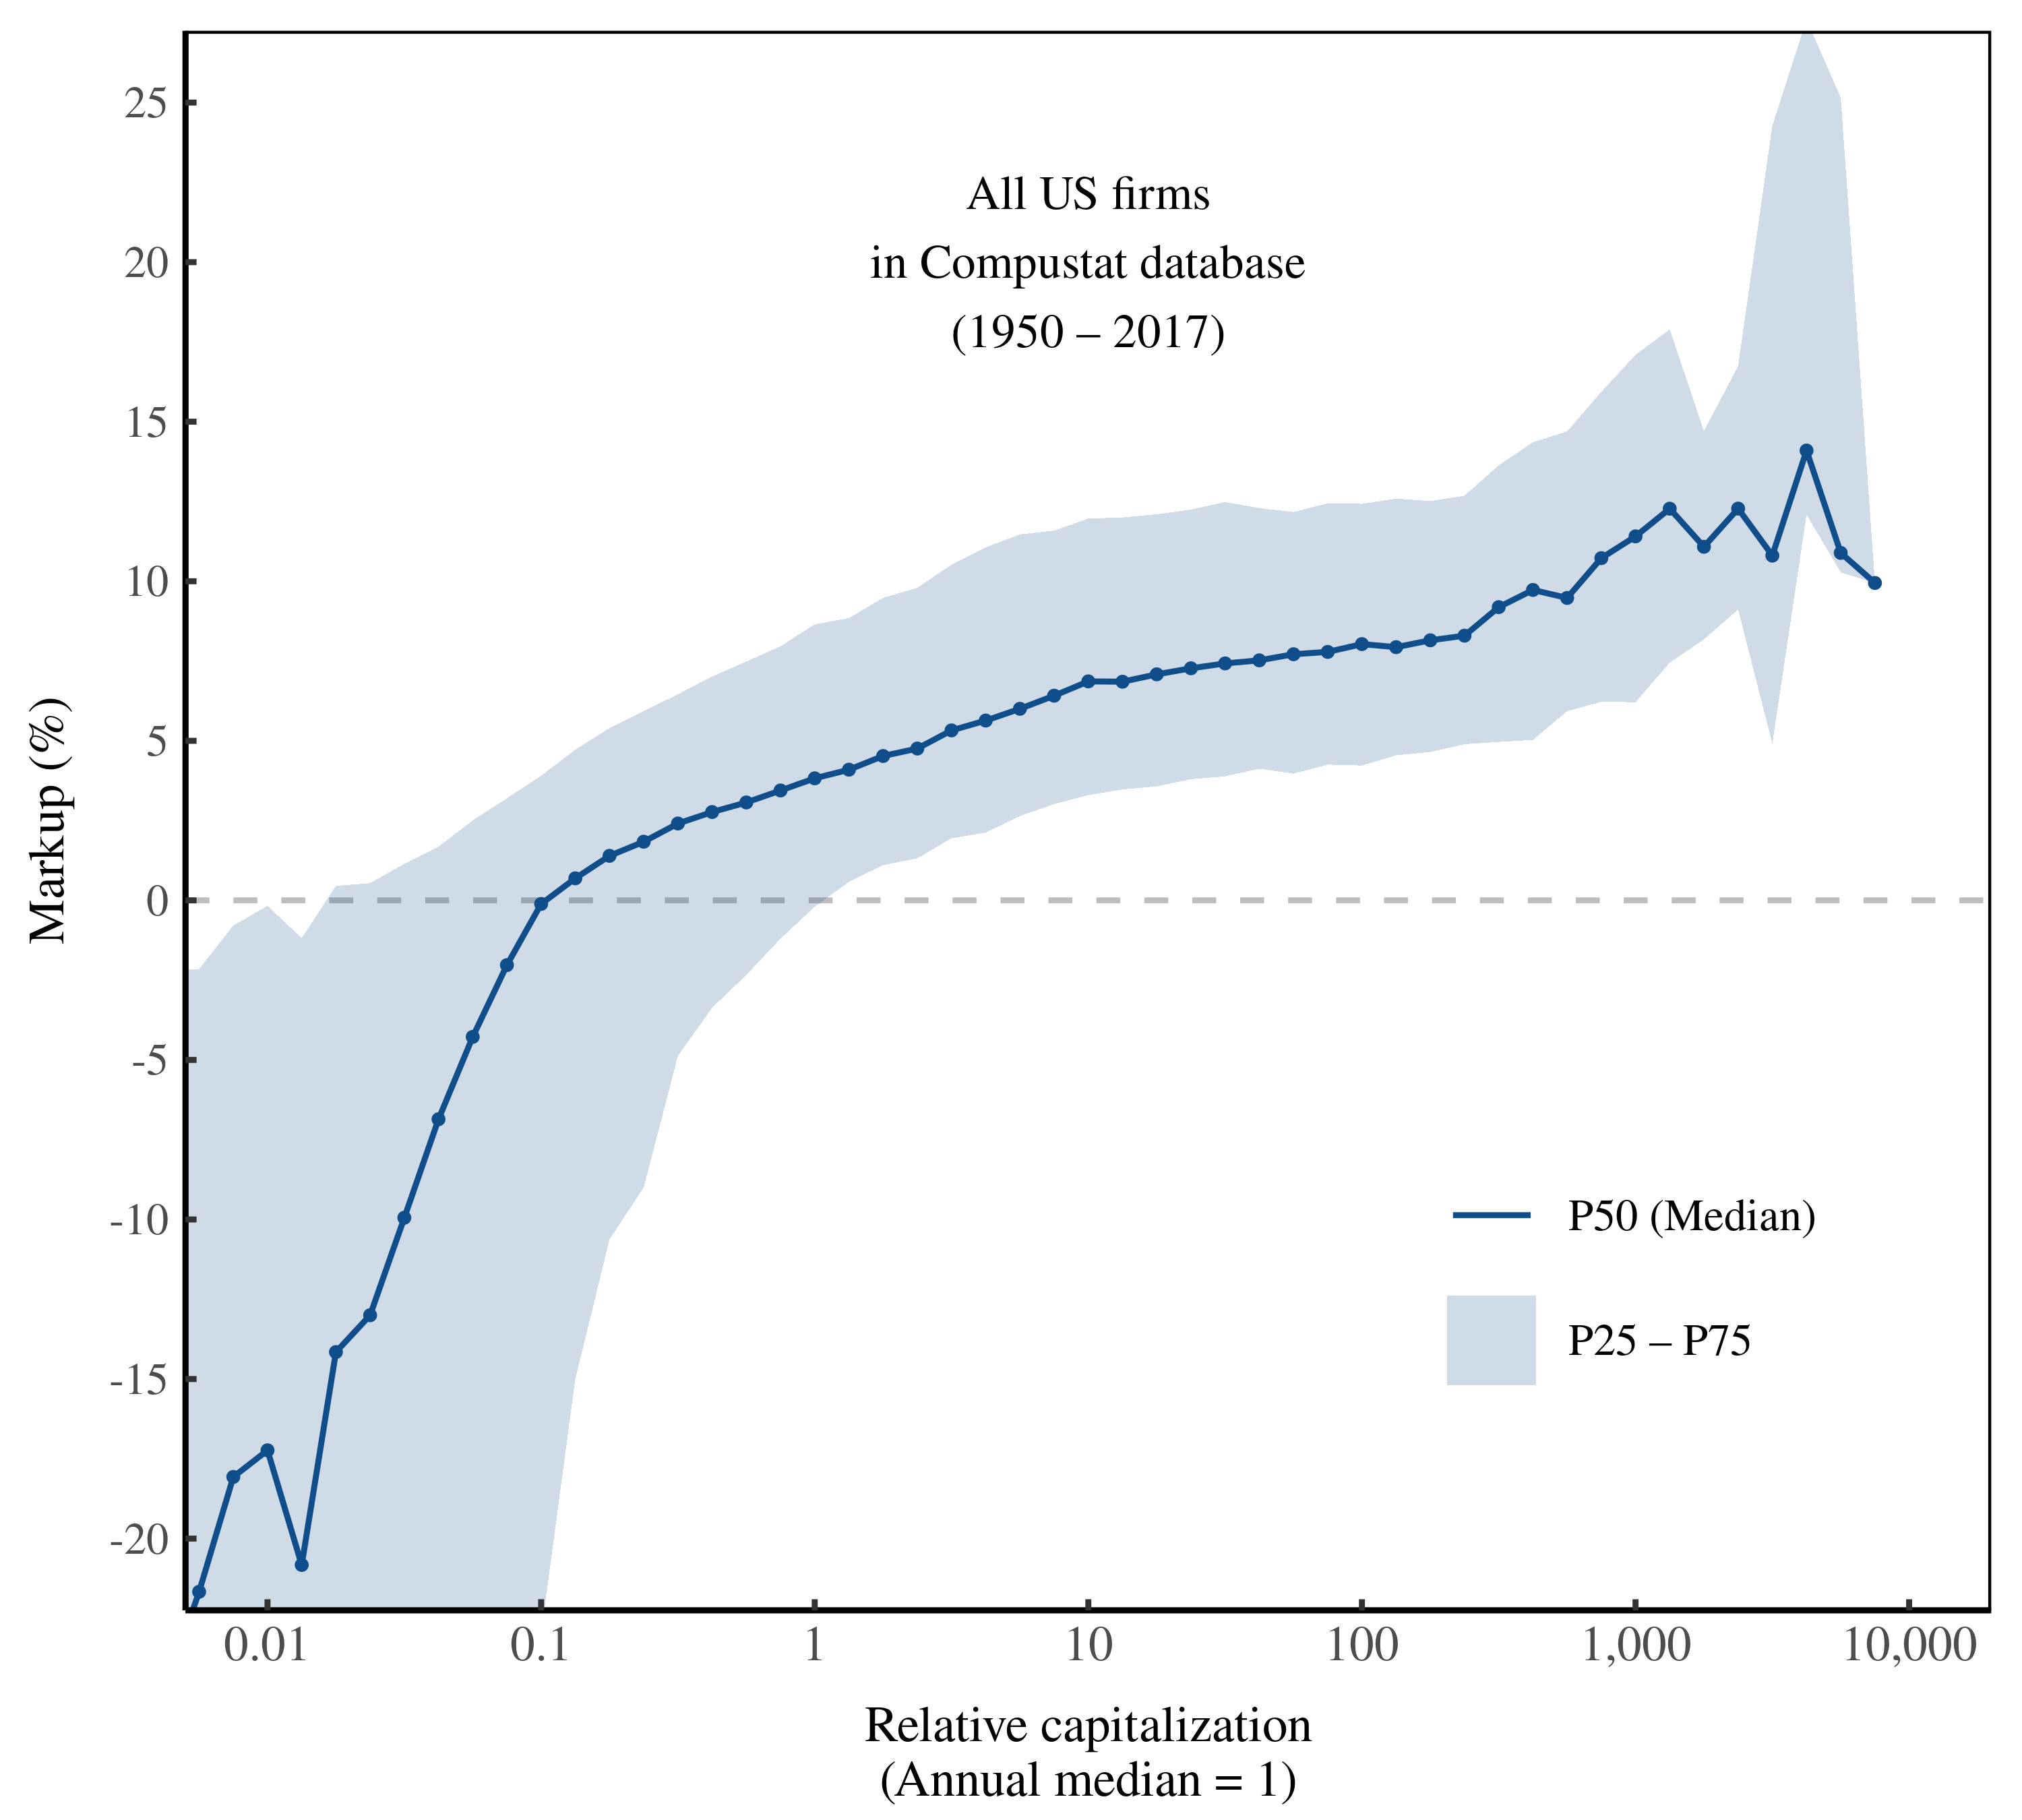
Figure 9 shows the trend. I’ve plotted here the markup as a function of relative capitalization among all US public firms (since 1950). Each point indicates the median markup when firms are grouped by relative market cap. (I’ve normalized capitalization so that the median cap in each year is 1). It’s easy to spot the trend. The markup grows reliably with capitalization.

We can see the same pattern when we look at different time periods. In Figure 10, I’ve animated 5-year snapshots of the markup-vs-capitalization data. The trend shifts with time, but the overall pattern is consistent. The markup grows with relative capitalization. When US investors capitalize profit, it seems they prefer it be reaped on a fat margin.
Why do investors award greater capitalization to firms with a higher markup? Perhaps it again comes down to perceptions of risk. Consider two companies with similar-sized profits. One company has mammoth sales but a razor thin markup. The other company has smaller sales, but a fat markup. Which one do investors deem more ‘risky’, and so discount more steeply?
We need not leave this question hypothetical. It’s easy to find two real-world firms that match the criteria. Consider the difference between Walmart and Apple, summarized in Table 1. In order-of-magnitude terms, the two firms have similar-sized profits. But they take different routes to this windfall. Walmart has enormous sales and a thin markup. Apple has smaller sales and a fat markup.
| Walmart | Apple | |
|---|---|---|
| Profit (billions $) | 21 | 57 |
| Sales (billions $) | 520 | 275 |
| Markup | 4.0% | 20.9% |
| Capitalization (billions $) | 400 | 2127 |
| Effective discount rate | 5.1% | 2.7% |
Source: Walmart 2020 Annual Report, Apple 2020 Annual Report
Investors, it seems, prefer the Apple route to profit. Even though Apple’s profit is of similar size to Walmart’s, investors reward Apple with far more capitalization. The difference? Walmart has a thin markup, Apple a fat one.
Framed in terms of the capitalization ritual, investors discount Walmart more steeply than Apple. They obviously have reasons for doing so, but these reasons need not be object. That’s because we’re dealing with an ideological Russian doll — rituals within rituals within rituals.
The finance ethos
It’s time to wrap up our dive into the capitalization ritual. We’ll end where we started — with the mystique that surrounds high finance. This mystique is reinforced by textbooks, which make hefty use of complicated math, giving the appearance of profound ‘scientific truth’. Heck, you often need a PhD in physics to understand the equations. Does that mean that like physics, finance is a ‘hard science’?
The answer is a hard no.
Finance does not describe our social world. Finance defines it. Finance outlines the rituals whereby capitalists impose order onto society, turning the qualities of ownership into a single quantity. Finance, Jonathan Nitzan and Shimshon Bichler observe, is the ideology of our time:
The ‘science of finance’ is first and foremost a collective ethos. Its real achievement is not objective discovery but ethical articulation. Taken together, the models of finance constitute the architecture of the capitalist nomos. In a shifting world of nominal mirrors and pecuniary fiction, this nomos provides capitalists with a clear, moral anchor. It fixes the underlying terrain, it shows them the proper path to follow, and it compels them to stay on track. Without this anchor, all capitalists — whether they are small, anonymous day traders, legendary investors such as Warren Buffet, or professional fund managers like Bill Gross — would be utterly lost.
Finance theory establishes the elementary particles of capitalization and the boundaries of accumulation. It gives capitalists the basic building blocks of investment; it tells them how to quantify these entities as numerical ‘variables’; and it provides them with a universal algorithm that reduces these variables into the single magnitude of present value. Although individual capitalists differ in how they interpret and apply these principles, few if any can transcend their logic. And since they all end up obeying the same general rules, the rules themselves seem ‘objective’ and therefore amenable to ‘scientific discovery’.
Make no mistake, the regularities of corporate finance are majestic in scope. But these regularities stem not from any laws of nature. They are regularities from ritual. Gesture the cross. Discount present income.
Perhaps the most important question is where this ritual is headed. Does capitalization have a long-term future? Neoclassical economists like William Nordhaus think so. They’re happy to apply the capitalization ritual to existential crises like climate change. And the net present value of their calculations tells them (surprise surprise) that we should do essentially nothing. But of course, by applying a heavy discount rate to future income, that is what they assumed in the first place. It’s ritualized apathy.3
Back to the present. The ritual of capitalization is surrounded by a mystique of ‘higher truth’. Whenever you encounter such a mystique, it’s a good bet that you’re dealing with ideology. The point of the ‘mystique’ is to stop you from looking under the ideology’s hood. When you do, you see that the whole thing is a house of cards. The ‘higher truth’ of the Holy Trinity is that it is an ideological invention of church clergy. So too with finance. The only difference is that with finance, the clergy aren’t priests … they’re economists.
Sources and methods
All firm financial data comes from Compustat. Data series are as follows:
- capitalization: number of shares outstanding (series
CSHO) × annual closing share price (seriesPRCC_C) - profit (net income): series
NI - sales: series
SALE - markup (profit as a portion of sales):
NI/SALE
Interest rates (Fig. 3) are from FRED series DFF. The GDP deflator (Fig. 4) is from FRED series A191RI1Q225SBEA
The effective discount rate
For each firm f , I define the firm’s effective discount rate r_f as
where E_f is the firm’s profits and K_f is the firm’s capitalization (in a given year). I define the average discount rate for all firms, \overline{r} , as the geometric mean of r_f over all firms:
When calculating the effective discount rate, I exclude firm observations with negative profit.
Notes
- Here’s how Nitzan and Bichler describe the exclusionary act of property:
The most important feature of private ownership is not that it enables those who own, but that it disables those who do not. Technically, anyone can get into someone else’s car and drive away, or give an order to sell all of Warren Buffet’s shares in Berkshire Hathaway. The sole purpose of private ownership is to prevent us from doing so. In this sense, private ownership is wholly and only an institution of exclusion, and institutional exclusion is a matter of organized power.
- One of my only memories from Sunday school was my incredulity at hearing the story of Jonah and the whale. “You’ve got to be joking,” I remember saying to the church teacher. “This is a myth, right?” The teacher assured me it was not. This interaction cemented in my mind that I wanted nothing to do with religion.↩︎
- If you’re interested in the economics of climate change, Steve Keen’s debunking of Nordhaus’ work is a must read. See his paper ‘The appallingly bad neoclassical economics of climate change’. For a discussion of how Nordhaus uses the capitalization ritual to discount future income, see Bichler and Nitzan’s research note ‘The Nordhaus Racket’.↩︎
Further reading
Nitzan, J. (1992). Inflation as restructuring. a theoretical and empirical account of the US experience (PhD thesis). McGill University.
Nitzan, J., & Bichler, S. (2009). Capital as power: A study of order and creorder. New York: Routledge.