
America’s Real ‘Debt Dilemma’

SANDY BRIAN HAGER
July 2013
Abstract
In the wake of the current crisis there has been an explosive rise in the level of the US public debt. These massive levels of public indebtedness are expected to keep growing unless there are drastic changes to existing budgetary policies. According to a recent series in the Financial Times, the US now faces a ‘debt dilemma’ over whether the country should bring its fiscal house in order through tax hikes on the rich or cuts to entitlement programs. This apparent dilemma has sparked a debate over which groups should bear the burden of debt repayment and fiscal adjustment. However, one crucial question remains unasked: whose powerful interests are served by the public debt? Mapping the share of federal bonds holdings of and interest to the top 1%, my research uncovers a staggering trend towards concentration over the past three decades and shows that federal income taxes and transfer payments have done little to offset this regressive distribution. Increases to the public debt without progressive redistributive policies are likely to aggravate an already explosive situation characterized by inequality, while decreases to the privately held portion of the public debt are likely to encounter resistance from the top 1%. This is America’s real debt dilemma.
Keywords
distribution, inequality, power, public debt, the 1%
Citation
Sandy Brian Hager (2013), ‘America’s Real ‘Debt Dilemma’’, Review of Capital as Power, Vol. 1, No. 1, pp. 41-62.
America’s Real ‘Debt Dilemma’1
‘Every man and woman who owned a Government Bond, we believed, would serve as a bulwark against the constant threats to Uncle Sam’s pocketbook from pressure blocs and special-interest groups. In short, we wanted the ownership of America to be in the hands of the American people’
— Henry Morgenthau Jr.2
In the wake of the current financial crisis the debt of the US federal government has increased from 64 percent of GDP in 2007 to 103 percent in 2012. And due to soaring costs associated with an ageing population, some expect the federal debt to balloon further without drastic changes to existing budget policies. According to a recent series in the Financial Times, America now finds itself in the middle of a ‘debt dilemma’ over what policies it should pursue to bring its fiscal house into order (Harding 2013).
As the recent political gridlock over the debt ceiling, the fiscal cliff and sequestration demonstrate, there has been little consensus over how to resolve this supposed ‘debt dilemma’. The positions within the debate are diverse but generally fall between two poles of thought.
On the one side, there are those, including the corporate-led ‘Fix the Debt’ campaign, which argue that the US should reduce its public debt immediately, lest the government find itself in a Greek-style bankruptcy (Cote 2012; Ferguson 2009, 2010). The preferred method for reducing the debt is austerity that will cut spending to America’s ‘bloated’ social programs (Kotlikoff 2010).
On the other side, there are those, including the ‘Flip the Debt’ campaign associated with the Occupy movement, which urge caution and argue that the public debt has been a necessary component of the federal government’s crisis-management policies (Krugman 2012a; Wolf 2013; Summers 2013). With stubbornly high unemployment and increasing income and wealth inequality, the preferred method of gradually reducing the debt is tax hikes on the ‘super-rich’ that have gained the most from the political economic regime in place since the early 1980s (Buffett 2011, 2012; Sachs 2012).
Thanks to the efforts of the ‘Flip the Debt’ and other progressive movements, issues of power and inequality have been forced into the current debate over the ‘debt dilemma’. Their slogan – ‘Hey 1%! Pay your damn taxes!’ – places the responsibility for debt reduction squarely on the shoulders of the large corporations and the top 1% that have ‘stolen’ an estimated $2.3 trillion using tax loopholes, offshore tax havens and tax cuts. ‘Flip the Debt’ sees the explosive increase in the public debt as an outcome of growing inequality and calls on those at the top of this increasingly unequal society to pay their ‘fair share’ to help reduce it.
Yet what is most interesting about this often-vicious debate is not the questions that get answered, but the ones that are overlooked. One such question is why must the public debt be repaid? Whether mainstream or critical, all participants in this debate assume that, sooner or later, either through spending cuts or tax hikes, the public debt will have to be reduced from its current levels. The refusal even to contemplate alternatives to debt reduction points to the unquestioned sanctity of creditworthiness and ‘sound finance’ within contemporary capitalist society (Graeber 2011, p. 3).3
Most importantly, the current debate also overlooks the question of whose interests are served by the public debt. What if questions of power are not only central to the issue of public debt repayment, but also to the very existence of the public debt in the first place? What if the public debt is not simply an outcome of inequality but also part of its cause? What if the top 1% is the major ‘winner’ of the recent public debt explosion, dominating the ownership of federal bonds and the interest paid on them? How would our understanding of the ‘debt dilemma’ change if we started to ask these questions?
My purpose in this article is to go beyond the current debate over America’s ‘debt dilemma’ and explore these questions. To this end, I present long-term historical research that empirically maps the share of the public debt owned by the top 1% of US households. This research demonstrates that, over the past century, inequality in the ownership of federal bonds and in the interest that is paid on them runs closely to the U-shaped pattern that characterizes the overall distribution of wealth and income. Over the past three decades, and especially in the context of the current crisis, the top 1% share of federal debt and interest has increased at a stunning rate and is now approaching the historic highs of the 1920s. This concentrated pattern of ownership suggests that since the early 1980s the public debt has come to serve more and more as an institution of power that works in the interests of the top 1%.
I then go on to explore two potential counter-arguments that downplay the significance of this increasingly concentrated pattern of public debt ownership. The first concerns the role of federal income taxation in progressively redistributing the concentrated federal interest income received by the top 1%. According to this counter-argument, the rich do indeed receive the bulk of federal interest income, but they also pay the bulk of federal income taxes (Eisner 1986). Thus the progressive system of federal taxation is said to neutralize the regressive distribution of federal interest income. My research, however, suggests that this argument is completely misleading. Though federal income taxes remain marginally progressive it has done little to offset the increasingly regressive distribution of federal interest income.
The second potential counter-argument has to do with the role of intra-governmental debt, the portion of the public debt held by the federal government, in offsetting the regressive pattern of privately held public debt. Intra-governmental debt, which stood at $4.6 trillion or 31 percent of GDP in 2011, represents the accumulated surpluses in government trust fund accounts such as social security and Medicare. These intra-governmental holdings have been celebrated by Keynesians as a progressive redistributive force working in the interests of middle class Americans (Cavanaugh 1996; Heilbroner and Bernstein 1989). The outstanding level of intra-governmental debt tells us nothing about the social interests that are served by it. But technically speaking, when the federal government spends via transfer payments it cashes in some of the Treasury securities held in its trust fund accounts. It is therefore possible to examine the distribution of transfer payments to indirectly measure the interests served by intra-governmental debt.
Analyzing Congressional Budget Office data on the distribution of transfer payments since 1979, my research indicates that the top 1% has never received a significant amount of government transfer payments and that its share has actually fallen during the current crisis. Yet this is no reason to celebrate intra-governmental debt as a progressive force. Once we start to dig deeper and dissect the distribution of transfer payments within the bottom 99% – a diverse category with its own social hierarchy – it is clear that over the past three decades intra-government debt has, if anything, intensified social inequality and polarization.
Overall, my research indicates that the public debt has, especially over the past three decades or so, served as an institution that directly augments and reinforces the power of those at the very top of the social hierarchy. America does indeed have a ‘debt dilemma’, but that this dilemma is of a very different nature than that suggested within the current debate.
On the one hand, when it comes to possible debt reduction, the top 1% is likely to resist any attempts to cut the privately held portion of the public debt that they have come to dominate. This is especially the case in the context of the current crisis in which ‘risk-free’ federal bonds have provided a modicum of security in financial markets plagued by ‘systemic fear’ (Bichler and Nitzan 2011). Debt reduction is therefore likely to target the intra-governmental portion of the public debt, which, although increasingly regressive, is still broadly an institution that works in favour of the bottom 99%. On the other hand, further increases to the public debt are likely, given the state of wealth and income inequality in US, to be purchased by the top 1%. Adding to the outstanding public debt is therefore liable to further skew the concentration of federal bond ownership and the federal interest that is paid on them.
Without progressive redistributive spending and/or tax policies, both of these actions are liable to aggravate an already explosive situation characterized by deepening inequality. This is America’s real debt dilemma.
In developing these arguments, the rest of this article will be organized as follows. The first section sketches an alternative power-centered class framework that maps the distribution of federal bonds and federal interest held by the top 1%. The next two sections engage empirically with the two potential counter arguments mentioned above. A concluding section then fleshes out my arguments about America’s real debt dilemma.
Public Debt and the Distribution of Power
In an interview with Tim Di Muzio in the Review of Capital as Power, Shimshon Bichler and Jonathan Nitzan (2012) offer some ideas on how the division between the top 1% and the bottom 99% can be employed for more than catchy sloganeering and serve as the foundation for theoretical-empirical explorations of capitalist power. Bichler and Nitzan (ibid, p. 5) suggest that a novel understanding of the power of the top 1% must be driven by new methods and accounting techniques that map the quantitative manifestation of this power: namely, the ‘differential income streams and asset holdings’ of the top 1%. A focus on the wealth and income shares of the top 1%, they caution, cannot tell us everything about the capitalist ruling class, but it does constitute an ‘indirect proxy’ for the power of the dominant capital groups at the center of accumulation (ibid, p. 5).
So if we want to move beyond the current debate over the ‘debt dilemma’ and look at the power underpinnings of the public debt, then an examination of the top percentile’s share of federal bonds and interest income is a good place to start. Figure 1 traces my efforts to map the long-term historical share of the public debt owned by the top 1% of US households (ranked by net worth). The figure comprises two series: the thick dotted series measures the top 1% share of federal bonds while the thin series measures its share of wealth in general.4
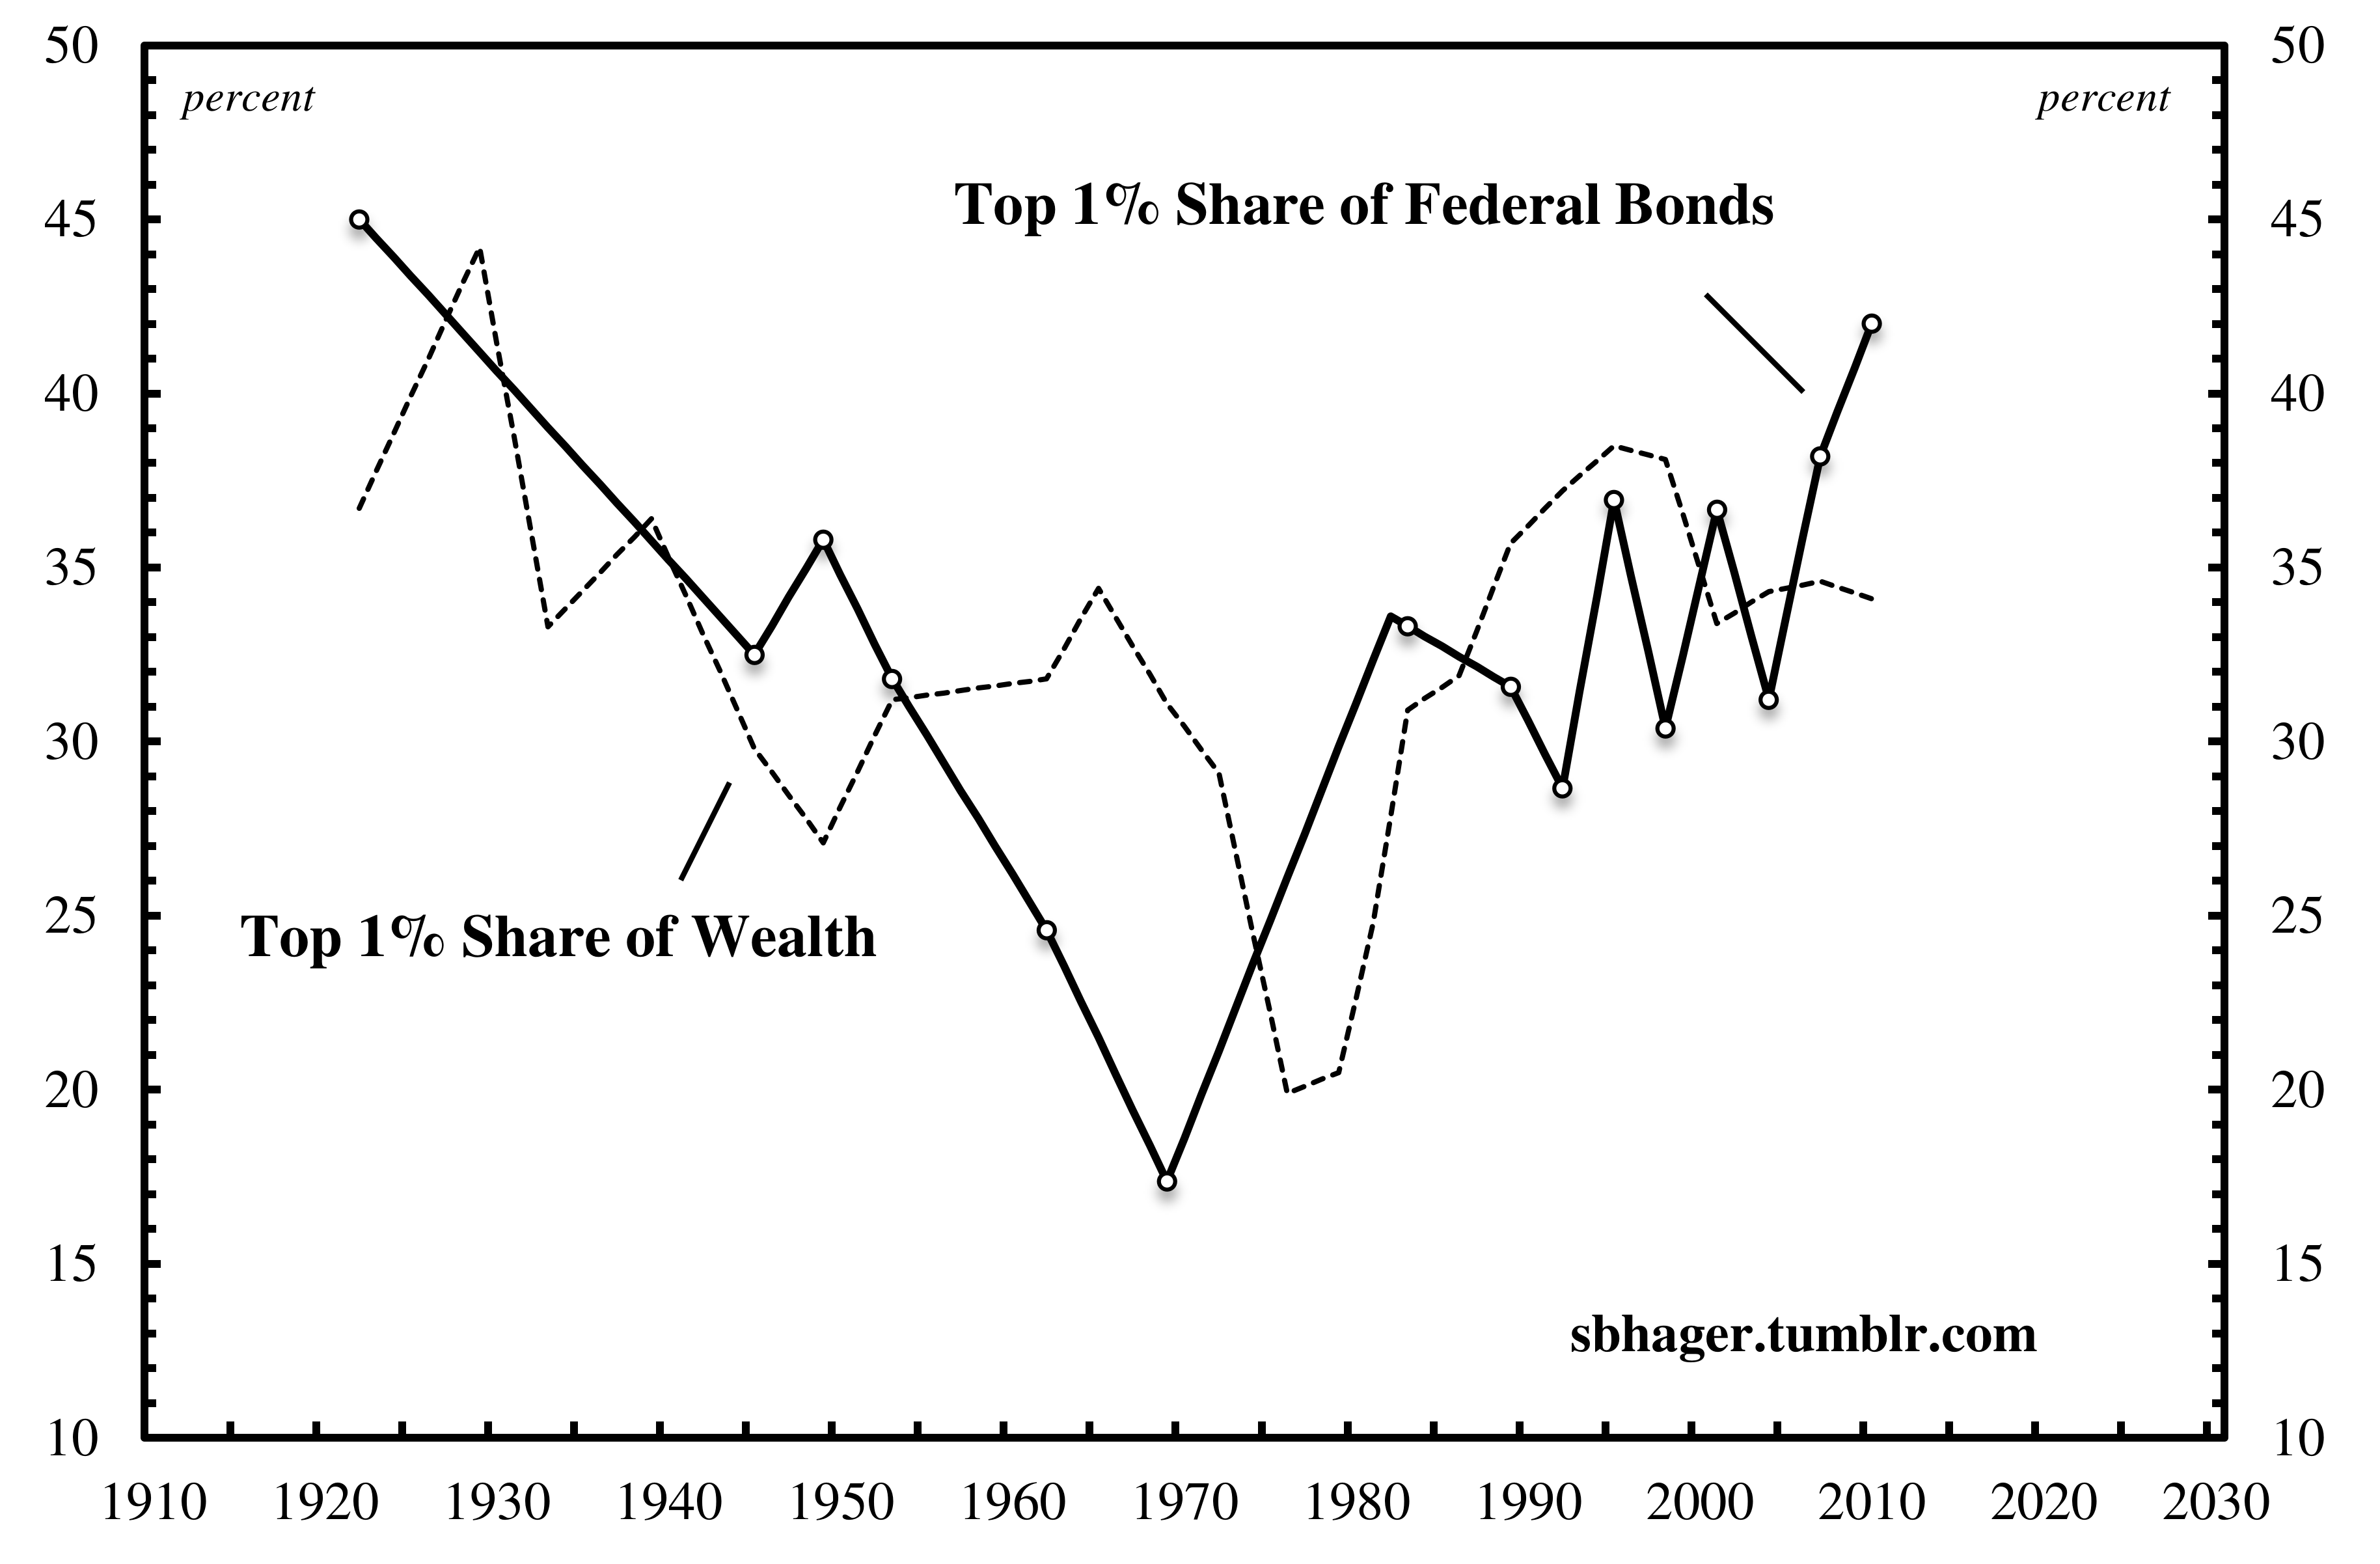
Figure 1: The Top 1% Share of Federal Bonds and Net Wealth.
Note: Missing data are interpolated linearlly by connecting adjacent observations. The dots in the thick series denote the years for which data is available.
Source: For public debt, Lampman (1962) for 1922-1961; the Federal Reserve’s Survey of Consumer Finances for 1962-1968, 1970-2010; the IRS’s Personal Wealth Report for the 1% share of the public debt in 1969: http://www.irs.gov/pub/irs-soi/69inpwar.pdf. Smith (1974) for individual ownership of the public debt in 1969. For net wealth, Wolff (1996, 2010) cited in Domhoff (2012). The observation for 2010 is based on my own calculation from the Federal Reserve’s 2010 Survey of Consumer Finance.
Both series follow the same general pattern. During the 1920s, the top percentile’s share of the public debt and wealth were both over 40%. Over the next half-century both of these shares fell gradually before beginning an upward ascent around the 1970s.5 By 2010, while the top 1% share of wealth had tapered off and declined slightly, the share of the public debt owned by the top 1% breached the 40% mark for the first time since the 1920s.
Figure 2 maps the distribution of federal interest income that flows from the ownership of federal bonds. This figure also comprises two series: the thin dotted series measures the share of federal interest income received by the top 1%, while the thick series measures its share of general or total income. Once again we see that both series follow the same long-term U-shaped pattern, with high concentration in the 1920s and 1930s gradually giving way to more equitable distribution through the post-World War II period. Over the past three decades or so, the top percentile’s shares of both federal interest and general income have increased rapidly, returning recently to the historic highs of the pre-WWII era.
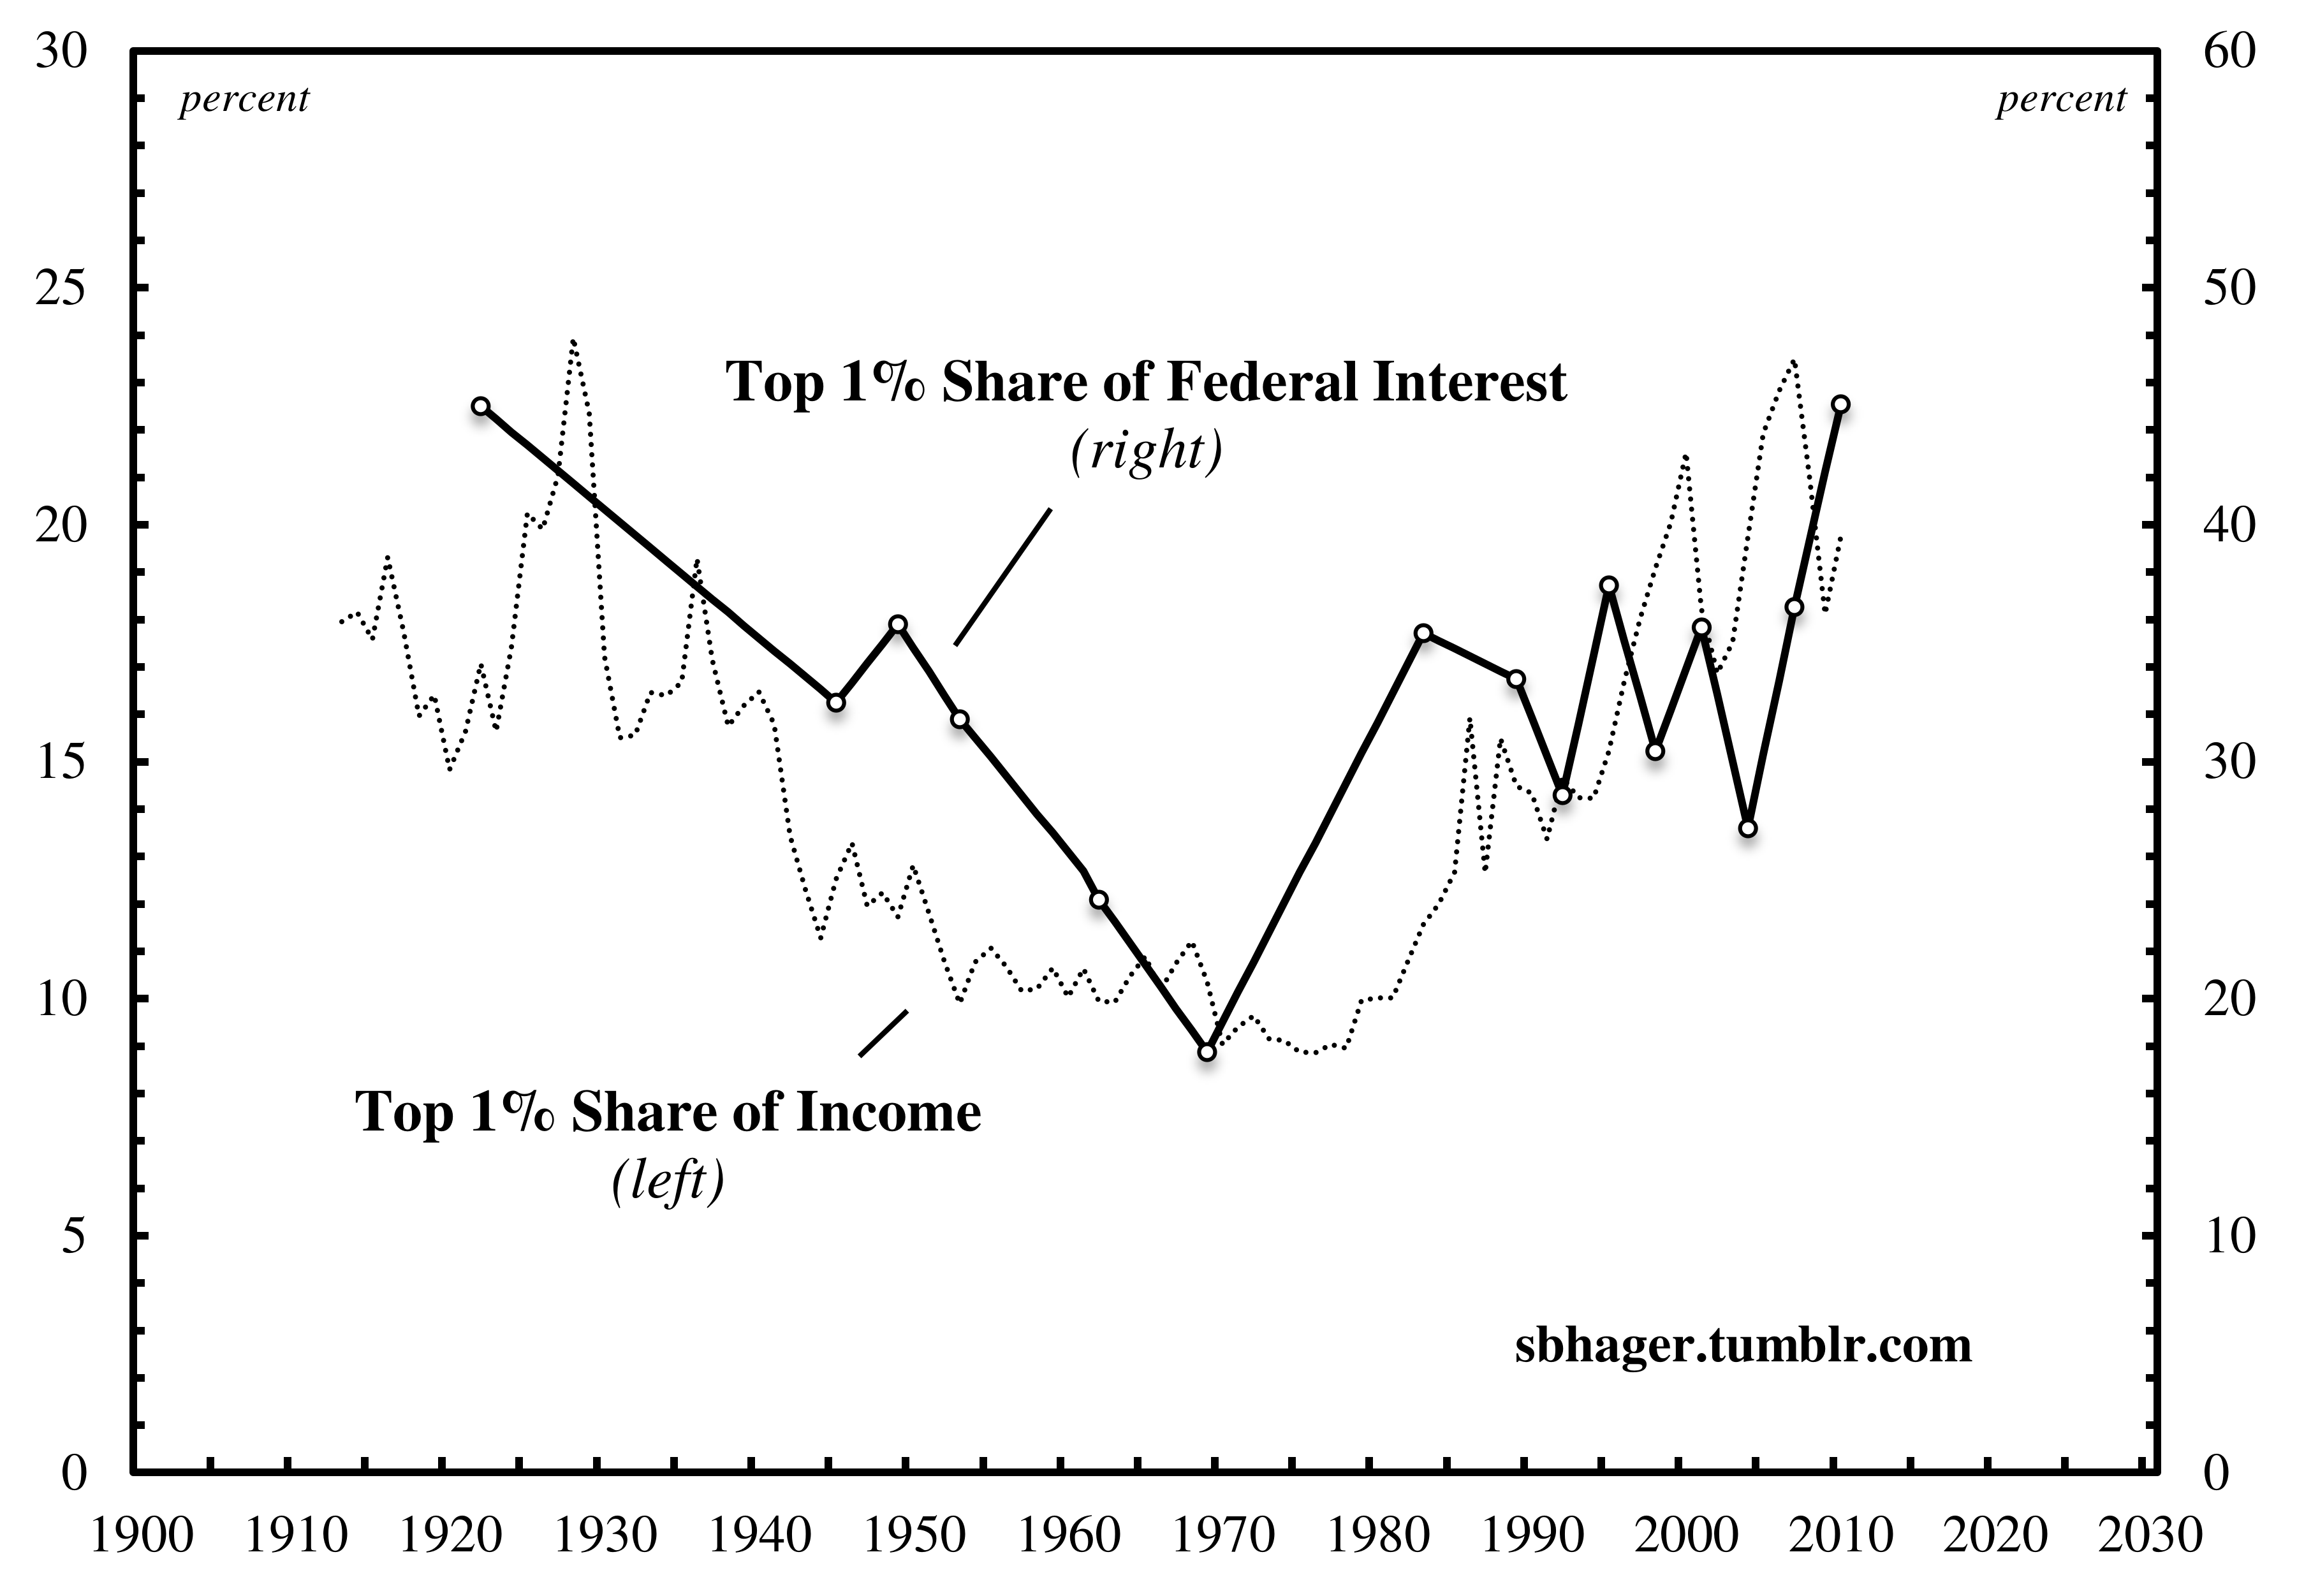
Figure 2: The Top 1% Share of Income and Federal Interest Income.
Note: Missing data are interpolated linearlly by connecting adjacent observations. The dots in the thick series denote the years for which data is available. From 1922-1961, the top 1% share of federal interest is assumed to be equal to the top 1% share of the public debt. From 1962-2010, interest payments for both the top 1% and all debt holders are imputed by multiplying the dollar value of different types of Treasury securities held by the group (savings bonds, ‘other’ federal others and ‘bond funds’) by their corresponding year-end interest rate, and then adding the sum of these products.
Source: For ownership of the public debt, see Figure 1. For interest rates, the US Treasury’s Monthly Statement of the Public Debt reports. For the top 1% share of income, The World Top Incomes Database.
Researchers of the US experience have raised concerns over the increasingly ‘top heavy’ distribution of wealth and income since the early 1980s (Wolff 1996; Piketty and Saez 2003; Wilkinson and Pickett 2010). As Figures 2 and 3 demonstrate, the public debt is invariably bound up with this increasingly ‘top heavy’ pattern of distribution.
Over the past three decades, and especially in light of the current crisis and the most recent public debt explosion, the top 1% has rapidly increased its shares of federal bonds and federal interest income. If we take the distribution of ownership and income as the ‘quantitative manifestation’ of power, then the conclusion we draw from this empirical research is clear: the public debt is an institution of power that increasingly works in the interests of the top 1%.
Taxation and Redistribution
Not so fast, skeptics will undoubtedly proclaim. Sure, the rich own most of the public debt, but they also pay most of the taxes (see Eisner 1986, p. 42). Thanks to the progressive nature of the US federal income tax system, the vast sums of federal interest that federal government pays to the top 1% in the form of interest simply flow back to the federal government in the form of income taxes levied on the top 1%.
The problem with this argument, however, is that it is confidently asserted without ever being subjected to systematic historical and empirical scrutiny. In order to explore the validity of this argument, we need to somehow measure the effects of the federal income tax system on the distribution of federal interest income. An effective way of doing this is to estimate and compare the share of the top 1% in gross (before-tax) federal interest payments to this group’s share in net (after-tax) share federal interest payments (Piketty and Saez 2007, p. 5). This empirical technique gives us a sense of the role that the federal income tax system plays in redistributing the interest income received by the top 1%.6
A progressive federal income tax system will make the net interest share of the top 1% smaller than its gross interest share (the difference between the gross and net shares will be positive). A regressive federal income tax system will make the net interest share of the top 1% greater than its gross share (the difference between the gross and net shares will be negative). A neutral federal income tax system will keep the gross and net interest share of the top 1% the same. In other words, the more progressive the tax system, the greater the gap will be between the gross and net share of federal interest received by the top 1% (and vice versa).
Figure 3 adopts this empirical technique to measure the effects of the federal tax system on the distribution of federal interest income. The top two series measure the gross and net share of federal interest received by the top 1%, while the bottom series is a ratio of the gross and net shares. The closer the ratio is to 1, the less substantial the impact of the federal income tax system on the distribution of federal interest income. Fluctuations in the ratio at the bottom of Figure 3 give us an indication of the changing effects of the federal income tax system on the distribution of federal interest income: when the ratio is rising/falling, the tax system becomes more/less progressive.
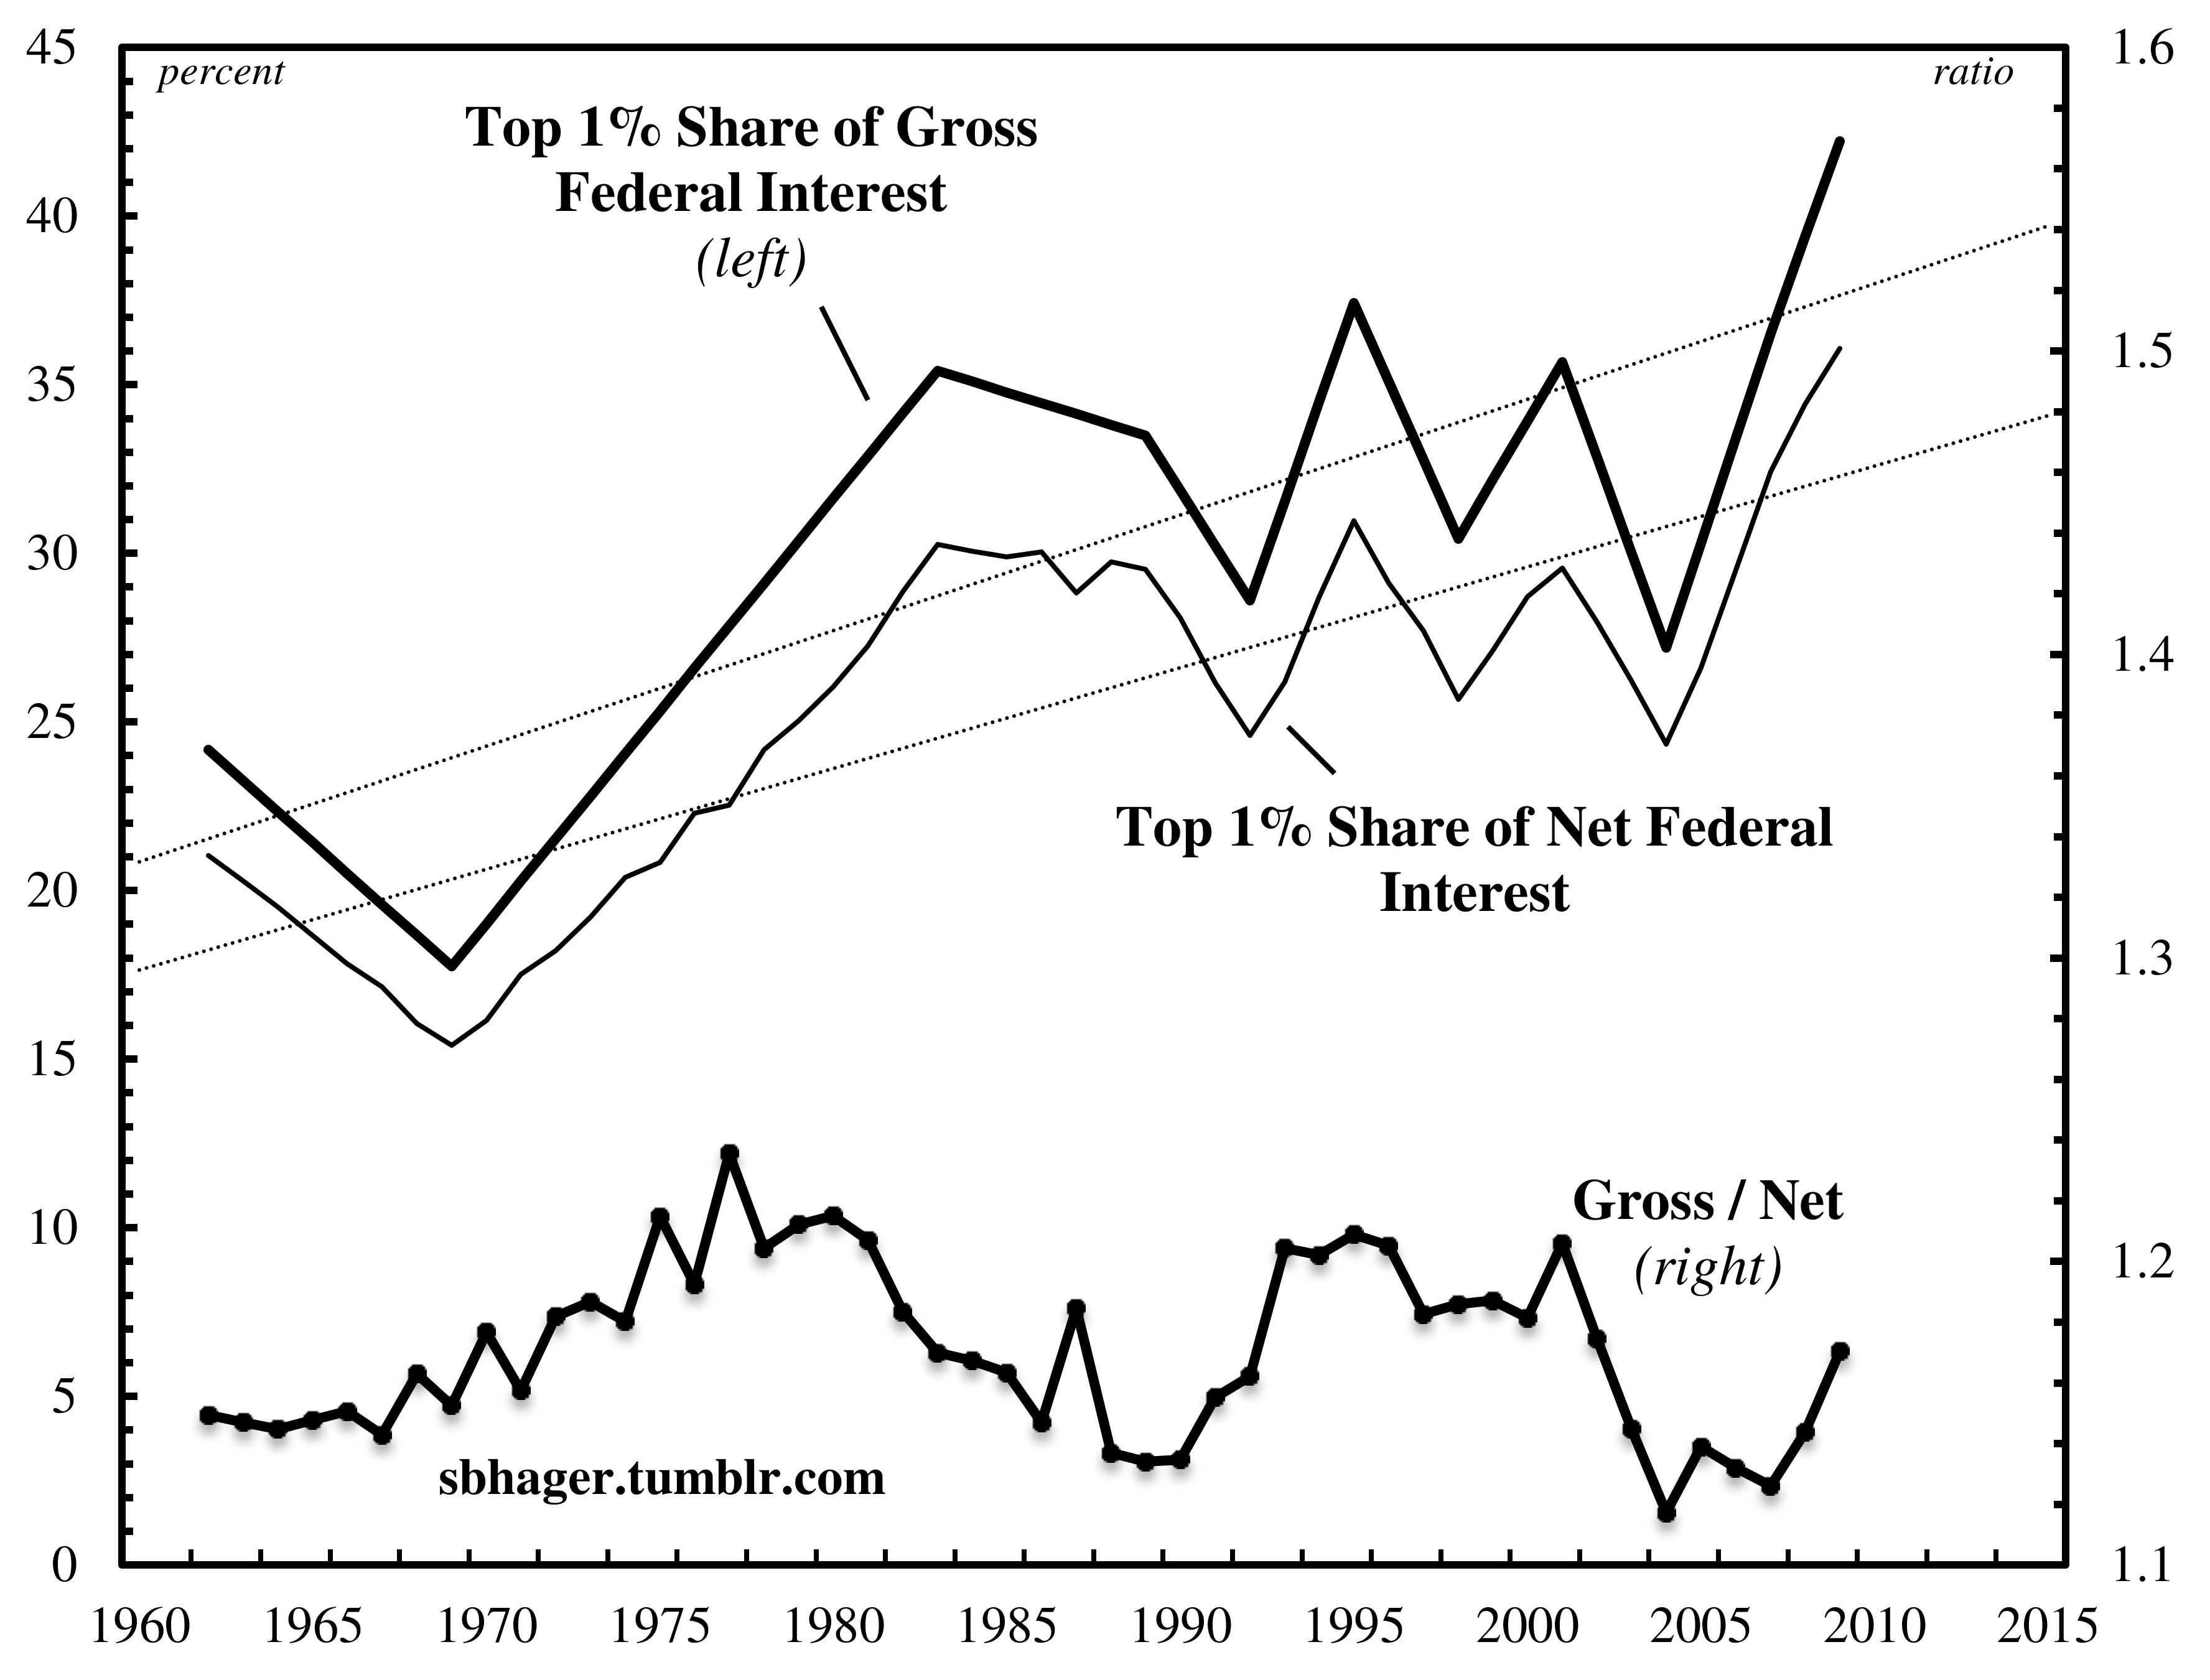
Figure 3: Giving and Receiving: Gross versus Net Federal Interest Income.
Note: Missing data are interpolated from the trend growth rate. The net share of interest is calculated by multiplying the top 1% share of total gross interest by the differential complements of the income tax rate (see footnote 5).
Source: For the top 1% share of federal interest, see Figure 2. For the effective tax rate from 1962-2004, Piketty and Saez (2007): (http://elsa.berkeley.edu/~saez/). From 2005-2009, the IRS Statistics of Income: (http://www.irs.gov/pub/irs-soi/12inwinbulratesshare.pdf).
According to the ratio series in Figure 3, the effect of the federal income tax system on the distribution of federal interest income has fluctuated historically. Over the long term, however, the effect of federal income tax on the distribution of federal interest income has been fairly constant. The gap between the gross and net series has gradually widened over the past five decades, but only very slightly. Meanwhile the distribution of federal interest has become rapidly concentrated in favour of the top 1%.
In short, Figure 3 indicates that the federal income tax system has done little to offset the growing inequity in the distribution of federal interest payments. What the top 1% gives to the federal government in income taxes as a percentage of its income has, at least since the early 1980s, failed to keep pace with what it receives in federal interest payments. As a result, it is, to put it mildly, highly misleading to claim that a progressive federal income tax system offsets the increasingly regressive distribution of federal interest income.
Transfer Payments: The Great Equalizer?
There is still one more argument that skeptics could invoke to downplay the regressive distribution of federal bonds and federal interest. This argument has to do with the role of intra-governmental debt, the portion of the public debt held by the federal government, in offsetting the regressive pattern of privately held public debt.
Intra-governmental debt is a peculiar outcome of the government budget accounting process, representing the accumulated surpluses in the federal government trust fund accounts. Unlike general government revenues and expenses where there is no one-to-one correspondence between revenues and the expenses they fund, government trust funds are budget accounting devices that ‘earmark’ certain types of taxes to corresponding expenditures (see Wray 2004).
For example, federal payroll taxes are earmarked specifically for the Social Security Trust Fund account. When payroll taxes exceed social security benefits, the Social Security Trust Fund account accumulates a surplus, which the federal government is required by law to invest in special interest-bearing Treasury securities. Intra-governmental holdings of the public debt are significant. In 2012, they stood at $4.8 trillion, equivalent to nearly half the $11 trillion of the public debt held by private investors.
Keynesians celebrate the holdings of the public debt in federal government trust fund accounts such as Social Security, Medicare and Medicaid as a progressive force that serves the interests of ‘average’ Americans (Cavanaugh 1996, p. 68), while neoliberals vilify intra-governmental debt, claiming that it represents the ‘bloated’ entitlements of an unsustainable welfare state (Pakko 2009, p. 9). Despite fundamental disagreements, both Keynesians and neoliberals accept the notion that intra-governmental holdings work to offset the ‘top heavy’ distribution of the privately held portion of the public debt.
Once again, the problem is that these claims are rarely subjected to historical and empirical scrutiny. How, then, do we go about exploring empirically the assertion that these substantial intra-governmental holdings somehow represent the interests of ‘average’ Americans and offset the regressive distribution of privately held public debt?
In and of itself, the overall level of intra-governmental debt tells us nothing about the interests that are served by it. But technically when the federal government pays out social security benefits and other forms of transfer payments, it cashes in some of the Treasury securities from its trust fund accounts to pay out transfer payments to individuals and families in dollars and cents. We can therefore examine the distribution of transfer payments in order to determine indirectly whose interests are served by intra-governmental holdings of the public debt.
A recent study by the Congressional Budget Office (2012) on household income inequality offers insights into the distribution of government transfer payments over the past three decades. The CBO data indicate that the share of transfer payments received by the top 1% of households has changed little over the past three decades. Since 1979, the top 1% has received on average a paltry 0.89 per cent of transfer payments, and this share fell even further to 0.68 per cent in 2009. As a result, there is really no question that over the past three decades intra-governmental debt has been an institution that serves the interests of the bottom 99%.
But the fact that the bulk of transfer payments flow to the bottom 99% of households should not lead us to overstate the role of intra-governmental debt as a progressive redistributive force. The reason for this can be seen once we start to break down the distribution of transfer payments within the bottom 99%.
Though the 99% has in recent years become a catchall category used to distinguish the majority from the wealthy elite, it is, in reality, a very diverse group with its own hierarchical structure. The bottom 99% includes social groups ranging from the ‘power belt’ of professionals in the 90th to 99th percentiles of income distribution that ‘surrounds, serves and protects’ the top 1% (Bichler et al. 2012, p. 5), all the way down to the 46 million Americans that live below the poverty line (Denavas-Walt et al. 2012, p. 13). Once we take into account the hierarchical structure within the bottom 99% into our analysis of the distribution of transfer payments, we see that sweeping transformations have taken place over the past three decades.
Figure 4 breaks down the CBO data on the distribution of transfer payments within the bottom 99% of households. The figure is divided into two broad categories: the thin line shows the share of transfer payments received by households in the 60th to the 99th percentiles of income distribution (that is, the top 40% minus the top 1%), while the thick line shows the share of transfer payments received by households in the bottom 40%.
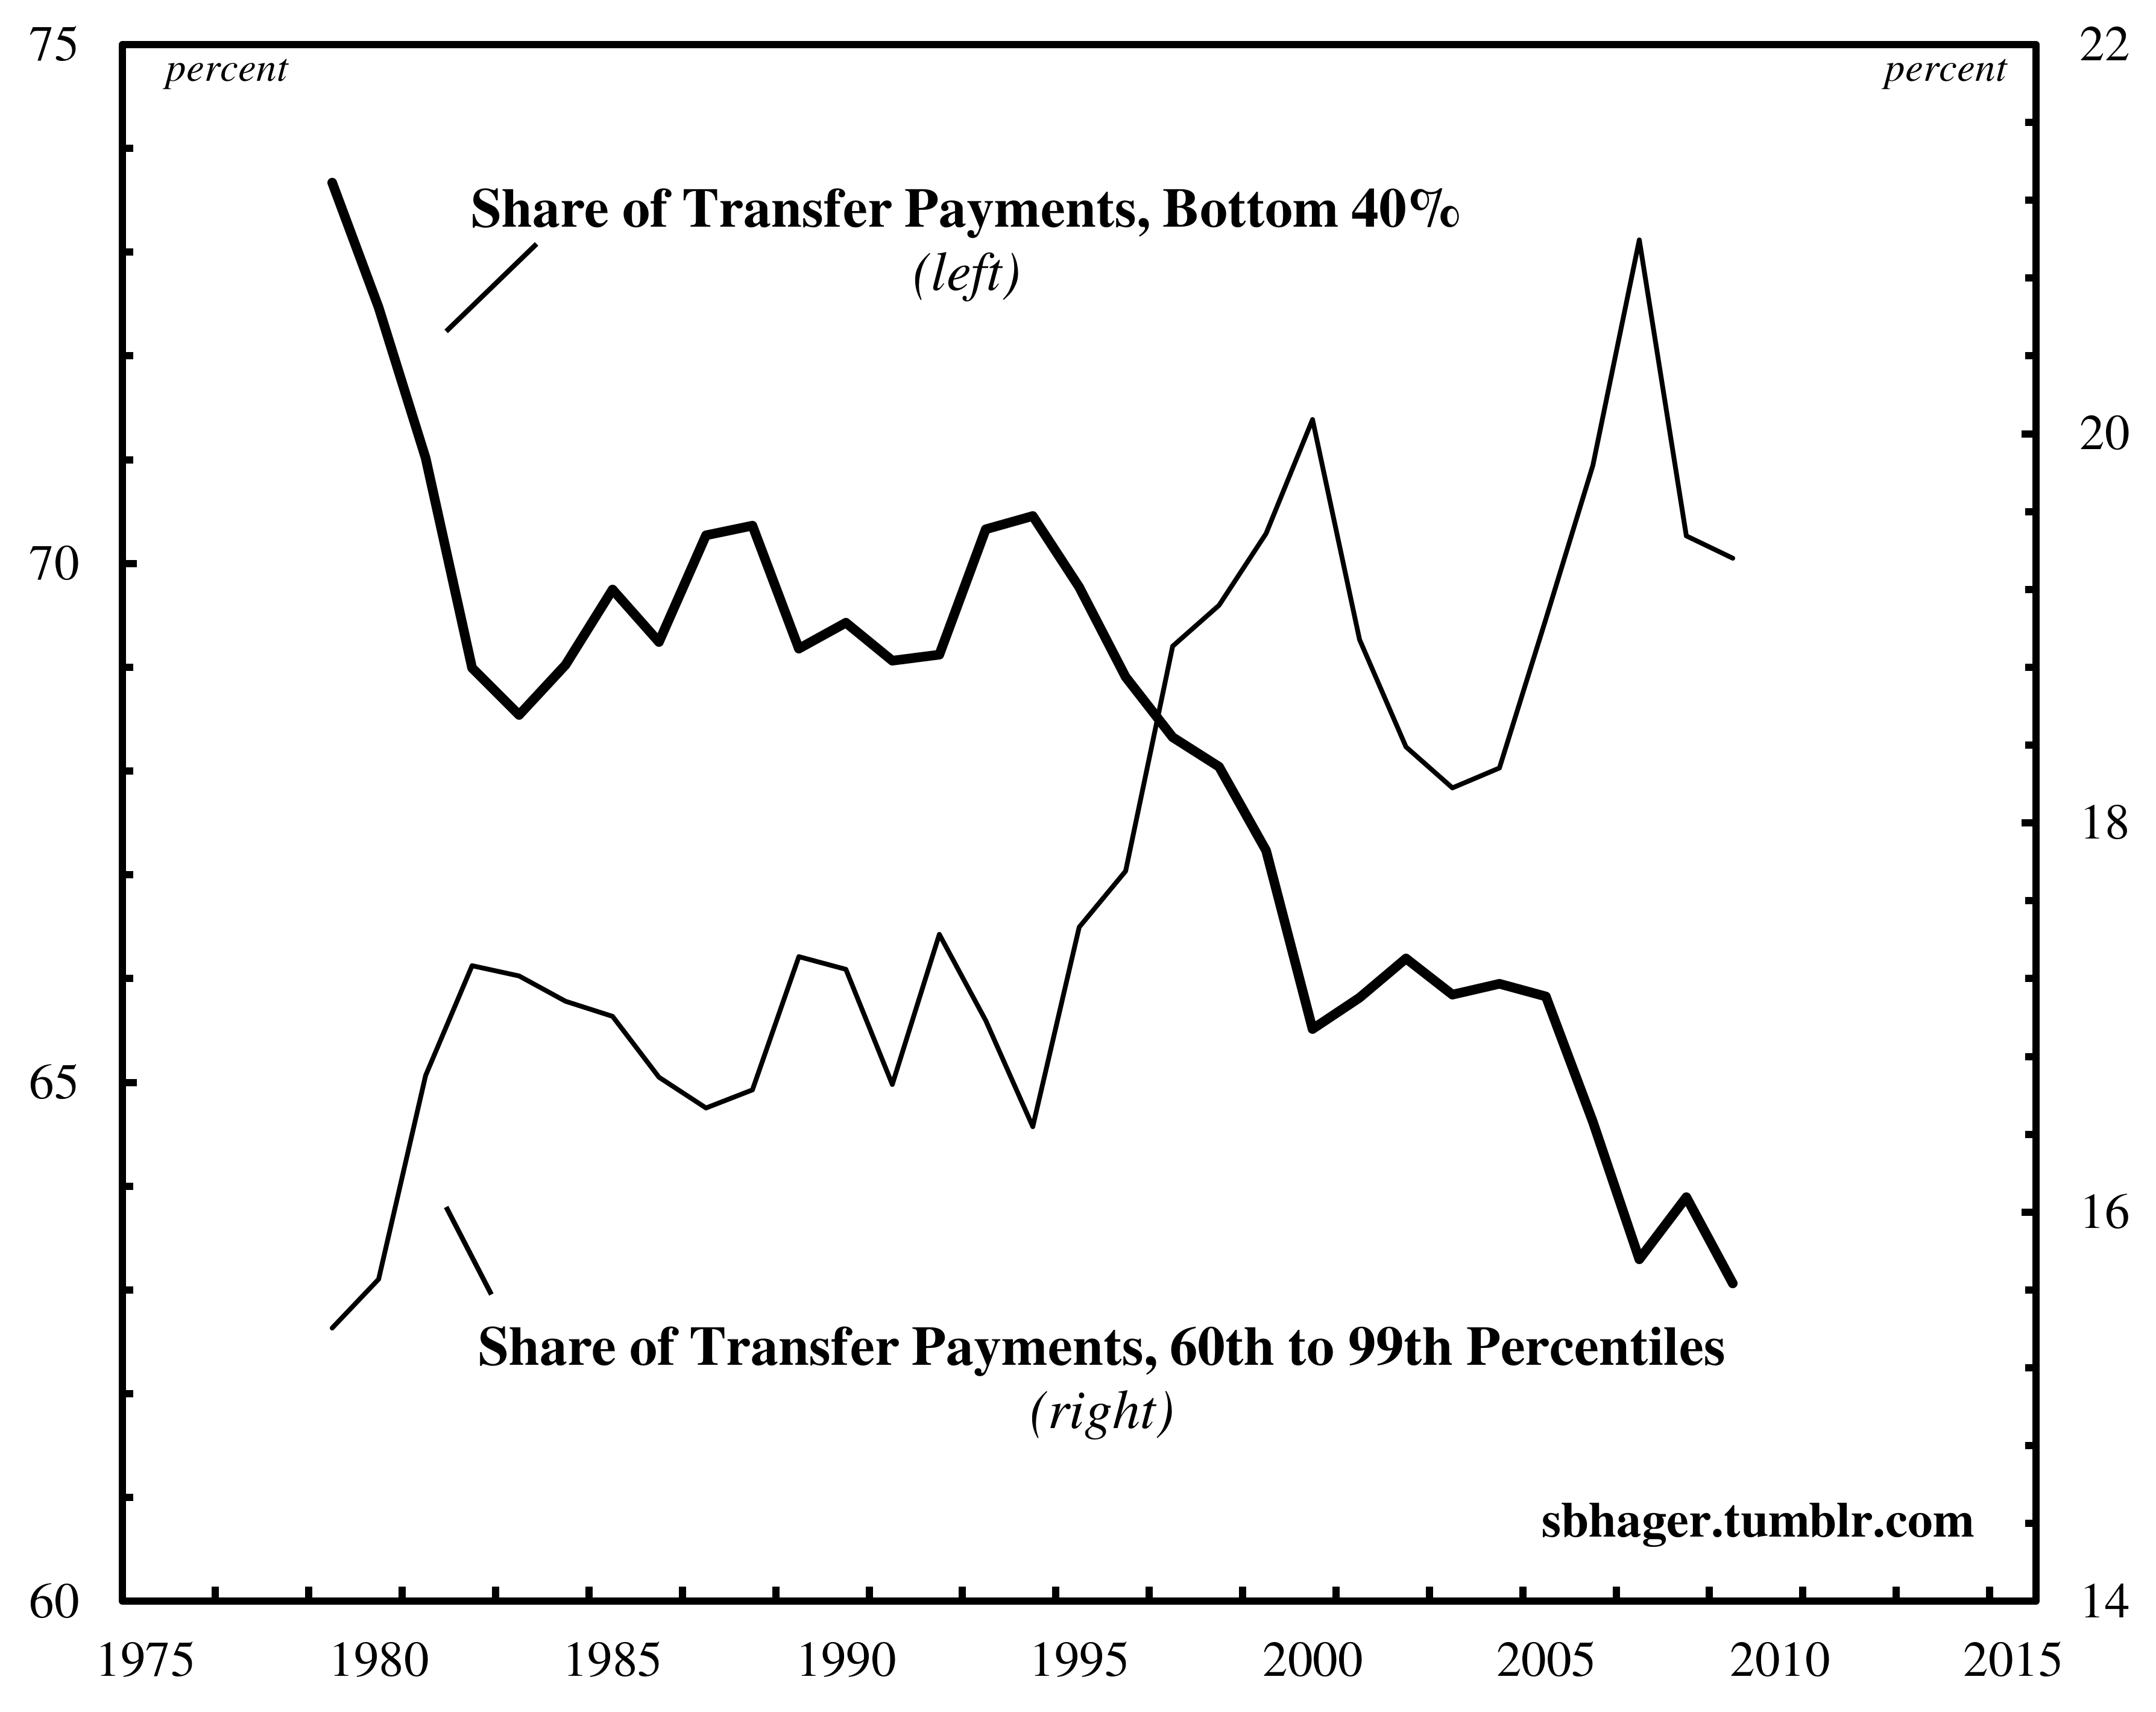
Figure 4: Transfer Payments and the Bottom 99%.
Note: Transfers include federal, state and local government cash (e.g. social security) payments and in-kind (e.g. voucher) payments.
Source: The Congressional Budget Office (2012): (http://www.cbo.gov/publication/43373).
The CBO data indicates that the share of government transfer payments received by the upper stratum of US households has increased modestly over the past three decades from 15% in 1979 to 20% in 2009. Meanwhile, households in the bottom 40% saw their share of transfer payments fall from 73% to 63% over the same period. The fall has been particularly dramatic for households that are most likely to rely on government transfers for survival, with the share of transfer payments received by households in the bottom 20% falling markedly from 54 to 40% from 1979 to 2009.
Intra-governmental debt, like the income tax system, plays a limited role in offsetting ‘top heavy’ distribution of the privately held public debt. Undoubtedly the top 1% of households has never claimed much of a stake in the transfer payments that flow from the inter-government debt held in government trust fund accounts. And thus in broad terms, intra-governmental debt does indeed represent the interests of the bottom 99%. Yet once we dig deeper and break down the distribution of transfer payments within the bottom 99%, we see that over the past three decades intra-governmental debt has intensified social inequality and polarization.
Conclusion: The Real Debt Dilemma
The current debate over the ‘debt dilemma’ draws linkages between the growing public debt and issues of distribution and inequality. Those who advocate spending cuts blame the public debt explosion on the bottom 99%; a group that they argue receives too much from the federal government.7 Meanwhile those who advocate tax hikes and the closing of tax loopholes, blame the public debt explosion on the top 1% that has failed to pay its ‘fair share’ to government coffers.
Using power-centered accounting techniques and methods, the empirical analysis presented in this article suggests that the current debate is missing a big part of the overall picture. The public debt is not, as the current debate would have us believe, simply an outcome of inequality. Rather the public debt, through the power dynamics of ownership distribution, directly contributes to income and wealth inequality in America. Much like its share of total wealth and income, the top 1% has greatly increased its share of federal bonds and federal interest over the past three decades or so. Over this period, and especially in the context of the current crisis, the public debt has served more and more to augment and reinforce the power of the top 1%.
Once these power relations underpinning public indebtedness are brought to the fore, we gain a totally different understanding of America’s ‘debt dilemma’.
On the one hand, the federal government faces a dilemma in trying to reduce the public debt. Attempts to reduce the privately held portion of the public debt are likely to encounter resistance from the top 1%. During the current crisis, federal bonds have served as a ‘safe haven’ for investors, and as we saw in Figure 1, the top 1% has greatly increased its ownership share in the past few years. Without any signs of recovery, the top 1% is unlikely to want to relinquish these ‘risk-free’ assets. Efforts to reduce the debt are therefore likely to target the intra-governmental debt, which, although increasingly regressive, still works broadly in the interests of the bottom 99%. Reducing intra-governmental debt held in government trust fund accounts is tantamount to gutting social programs. Given the state of wealth and income inequality in America, it is worth questioning whether an austerity drive of this type can occur without causing major social upheaval.
On the other hand, the federal government faces a dilemma in trying to increase the public debt. Again taking into consideration the current state of wealth and income inequality, any further increases to the privately held portion of the public debt are likely to be purchased by the top 1%. Adding to the outstanding public debt is therefore likely to further skew the concentration of federal bonds and federal interest and contribute directly to growing income and wealth inequality. And this potential dynamic brings with it its own questions about whether any policy actions that further increase wealth and income inequality can be implemented without encountering further resistance from the bottom 99%.
Without progressive redistributive spending and/or tax policies, actions to decrease and increase the public debt are both liable to aggravate an already explosive situation characterized by deepening social inequality. This is America’s real debt dilemma. And this dilemma only makes sense once we investigate the power relations that underpin the public debt.
For some, these conclusions may seem somewhat counter-intuitive if not completely contradictory: isn’t the ruling class adverse to big government and public debt? How can the public debt serve as an institution of power when the most powerful seem so opposed to it? Just look at the high profile ‘Fix the Debt’ campaign that is led by billionaire fiscal conservative Pete Peterson and supported by CEOs from dominant corporations such as Bank of America, Boeing, Citigroup, General Electric, Goldman Sachs, Honeywell, Microsoft, Time Warner and Verizon (see Confessore 2013).8
‘Fix the Debt’ does indeed advocate debt reduction. But the ‘fix’ that the campaign prescribes focuses almost solely on cuts to social security, Medicare and Medicaid programs, along with a ‘pro-growth’ tax regime that would introduce unspecified measures to broaden the tax revenue base and at the same time reduce tax rates (Krugman 2012). Fear mongering about the public debt and budget deficits is just a means for ‘Fix the Debt’ to push through an austerity agenda, one that, in the words of a recent editorial in The Nation (2013), is bent on ‘…making the 99% pay to make the wealthiest 1% a whole lot wealthier’.
To understand how the ruling class really views debt reduction, we can look back at a rare but recent instance in US history when there was a serious prospect for public debt elimination. During the second administration of Bill Clinton the federal government ran budget surpluses and significantly reduced the public debt. And by the turn of the millennium, many were forecasting that the public debt would soon be eliminated altogether.
Of course these forecasts now appear farcical with the public debt nearing 100 percent of GDP. But what is interesting is the lukewarm response to the prospect of debt elimination from powerful financial interests. Rather than celebrate the Clinton-era surpluses, financial groups started to worry about the implications of the rapid disappearance of federal bonds, which provide not only a massive and liquid financial market, but which are also the benchmark asset used to price all other types of assets (Reiner 2001). And in a telling 2001 speech to the Bond Market Association, Federal Reserve Chairman Alan Greenspan spent a great deal of effort trying to justify budget surpluses by placating fears about the negative effects of debt retirement on financial markets.9 If the ruling class response to debt reduction in periods of confidence is lukewarm, then how seriously should we take its calls for debt reduction in a period of global crisis? How can we treat the current calls for debt reduction as anything but fear mongering that serves some ulterior motive?
Of course there is nothing particularly novel in suggesting that the ‘Fix the Debt’ campaign is mostly a ploy to broaden support for an austerity agenda. This argument has been made not only by Occupy-inspired the ‘Flip the Debt’ movement but also by mainstream economists such as Paul Krugman (2012b, 2013).
What is novel about the approach taken here is that it moves beyond the narrow debate over the ‘debt dilemma’ and looks at the power underpinnings of the public debt through an examination of the top percentile’s share of federal bonds and interest income. By mapping the distributive shares of the public debt we come to a more nuanced understanding of the complex ways in which the ruling class wields power through the institution of public debt. And it is only by mapping these distributive shares that we come to understand the limits, contradictions and dilemmas that emerge out of the power relations of public indebtedness.
Rather than debate with the top 1% on its own terms, those that oppose the austerity agenda would do well to think seriously about these power relations and articulate an alternative view of America’s ‘debt dilemma’.
Notes
-
An earlier version of this paper was presented at the Policy Studies Conference: Policy Research in Times of Austerity and Uncertainty at Ryerson University, Toronto, 8–10 May 2013. I would like to thank the conference participants, and especially Chris Faricy, Bryan Evans and Stephen McBride for their insightful feedback and questions. I would like to thank Joseph Baines, Tim Di Muzio, Jeremy Green, Jeffrey Harrod, Jonathan Nitzan and Mark Peacock for help on earlier drafts of this paper. Funding from the SSHRC Joseph-Armand Bombardier Canada Graduate Scholarship and the Ontario Graduate Scholarship are gratefully acknowledged. I am responsible for any remaining errors or shortcomings.↩
-
Cited in Tufano and Schneider (2005, p. 11).↩
-
By accepting the ‘sound finance’ doctrine, even progressive voices often fall into the trap of thinking about the government budget as if it were the budget of a household or a corporation. Yet as proponents of Post Keynesian Modern Monetary Theory (MMT) explain, a monetarily sovereign (i.e. fiat currency-issuing) entity like the US federal government is never revenue constrained like a household or corporation and technically can never go bankrupt (see Wray 2012). This simple observation suggests that there are no inherent limits on government borrowing. These limits must necessarily be political.↩
-
Figure 1 splices together data from two sources: the Federal Reserve’s Survey of Consumer Finances and the Internal Revenue Service’s Estate Tax Database. Though there are important differences in the design and purpose of these two data sets, statisticians have suggested that they ‘compare quite favourably’ and can be treated ‘as complimentary sources on both wealth and income’ (Johnson and Moore 2005, pp. 87–96).↩
-
My imprecise use of language here is intentional. I use words like ‘around’ and ‘or so’ in reference to these data because of missing observations (see the notes for Figure 1). In particular the 1970s present an empirical blind spot, as no data is available for this decade.↩
-
The net share of the top 1% in federal interest is calculated as follows:
\frac{ \text{top 1\% federal gross interest received}}{\text{total federal gross interest received}} \times \frac{1 - \text{ top 1\% effective federal income tax rate}}{1 - \text{average effective federal income tax rate}} ↩
-
During the 2012 Presidential election campaign, Republican candidate Mitt Romney adopted a similar line of argument, focusing specifically on the bottom 47% of Americans who he argued ‘…are dependent upon government, who believe that they are victims, who believe the government has a responsibility to care for them, who believe that they are entitled to health care, to food, to housing, to you name it. These are people who pay no income tax’ (quoted in Rucker 2012).↩
-
A recent study by Page, Bartels and Seawright (2013: 55–6) lends credence to this view. In their survey, these researchers surveyed a sample of wealth individuals within the top 1% and asked them to identify ‘very important problems’ currently faced by the US. 87 percent of the individuals sampled identified ‘budget deficits’ as one of these problems. In fact, the top 1% cited budget as a ‘very important problem’ more than any other issue, including unemployment (84 percent), education (79 percent) and international terrorism (74 percent). In contrast, a survey of general public opinion by CBS found that only 7 percent of people identified budget deficits and public debt as the most important problem facing the country.↩
-
Economist Bill Mitchell (2010) notes how in 2002 the Australian experience may have ‘given the game away’ in regards to ruling class sentiments about the public debt. That year the Australian government was running massive and growing budget surpluses yet continued to issue significant sums of government bonds. The reason? Powerful financial institutions started to protest against the ‘thinning’ of the bond market.↩
References
Anonymous. 2013. Stacking the Debt: The Phony ‘Fix the Debt’ Campaign. The Nation (20, February), accessed March 16, http://www.thenation.com/article/173022/stacking-deck-phony-fix-debt-campaign
Bichler, Shimshon and Jonathan Nitzan. 2011. Kliman on Systemic Fear: A Rejoinder. Journal of Critical Globalization Studies 4 (April): 93–118.
Bichler, Shimshon, Jonathan Nitzan and Tim di Muzio. 2012. The 1%, Exploitation and Wealth: Tim di Muzio Interviews Shimshon Bichler and Jonathan Nitzan. Review of Capital as Power 1(1): 1–22.
Buffett, Warren. 2011. Stop coddling the super rich. New York Times (15, August): A21.
Buffett, Warren. 2012. A minimum tax for the wealthy. New York Times (27, November): A32.
Cavanaugh, Francis X. 1996. The Truth About the National Debt: Five Myths and One Reality. Boston: Harvard Business School Press.
Confessore, Nicholas. 2013. Public goals, private interests in debt campaign. New York Times (10, January): A1.
Congressional Budget Office. 2012. The Distribution of Household Income and Federal Taxes, 2008 and 2009. Washington: Congressional Budget Office.
Cote, David. 2012. No more CEO silence – it’s time to speak out about the debt. Financial Times (13, July): 15.
Denavas-Walt, Carmen, Bernadette D. Proctor and Jessica C. Smith. 2012. Income, Poverty and Health Insurance Coverage in the United States: 2011. Current Population Reports P60–243. Washington: Government Printing Office.
Domhoff, G. William. 2013. Wealth, Income, and Power, accessed 16 March 2013, http://www2.ucsc.edu/whorulesamerica/power/wealth.html
Eisner, Robert. 1986. How Real Is the Federal Deficit? New York: Free Press.
Ferguson, Niall. 2009. A history lesson for economists in thrall to Keynes. Financial Times (30, May): 7.
Ferguson, Niall. 2010. A Greek crisis is coming to America. Financial Times (11, February): 9.
Graeber, David. 2011. Debt: The First 5,000 Years. Brooklyn: Melville House.
Greenspan, Alan. 2001. The paydown of federal debt. Remarks before the Bond Market Association, White Sulphur Springs, West Virginia (27, April), accessed 16 March 2013, http://www.federalreserve.gov/boarddocs/speeches/2001/20010427/default.htm
Harding, Robin. 2013. A looming crisis. An opportunity for reform. Financial Times (22, January): 9.
Heilbroner, Robert and Peter Bernstein. 1989. The Debt and the Deficit: False Alarms/Real Possibilities. New York: W.W. Norton and Company.
Internal Revenue Service. 1973. Personal Wealth Estimated from Estate Tax Returns, 1969. Washington: Internal Revenue Service.
Johnson, Barry and Kevin Moore. 2005. Consider the Source: Differences in Estimates of Income and Wealth from Survey and Tax Data. Special Studies in Federal Tax Statistics (January): 77–99.
Kotlikoff, Laurence. 2010. Uncle Sam has worse woes than Greece. Financial Times (26, July): 7.
Krugman, Paul. 2012a. Nobody understands debt. New York Times (2, January): A21.
Krugman, Paul. 2012b. Brewing up confusion. New York Times (31, December): A19.
Krugman, Paul. 2013. Deficit hawks down. New York Times (25, January): A27.
Lampman, Robert J. 1962. The Share of Top Wealth-Holders in National Wealth, 1922–1956. Cambridge, MA: The National Bureau of Economic Research.
Mitchell, Bill. 2010. Market participants need public debt. Billy Blog, accessed 16 March 2013, http://bilbo.economicoutlook.net/blog/?p=10404
Page, Benjamin I., Larry M. Bartels and Jason Seawright. 2013. ‘Democracy and the Policy Preferences of Wealth Americans’, Perspectives on Politics, 11(1): 51–73.
Pakko, Michael. 2009. Deficits, Debt and Looming Disaster: Reform of Entitlement Programs May be the Only Hope. The Regional Economist (January): 4–9.
Piketty, Thomas and Emmanuel Saez. 2003. Income Inequality in the United States, 1913–1998. Quarterly Journal of Economics 118(1): 1–39.
Piketty, Thomas and Emmanual Saez. 2007. How Progressive is the US Federal Tax System? A Historical and International Perspective. Journal of Economic Perspectives 21(1): 3–24.
Reiner, Eric. 2001. The Incredible Shrinking Bond Market. Financial Advisor (1, June), accessed 16 March 2013, http://www.fa-mag.com/news/article-343.html
Rucker, Phillip. 2012. In leaked video, Romney disdains a ‘dependent’ 47%. Washington Post (18, September): A04.
Sachs, Jeffrey. 2012. An American budget for the rich and powerful. Financial Times (14, February): 9.
Smith, James D.1974. The Concentration of Personal Wealth In America, 1969. Review of Income and Wealth 20(2): 143–80.
Summers, Lawrence. 2013. End the damaging obsession with the budget deficit. Financial Times (22, January): 11.
Tufano, P. and Schneider, D. 2005. Reinventing Savings Bonds. Tax Notes (31, October): 1–20.
Wilkinson, Richard and Kate Pickett. 2010. The Spirit Level: Why Equality is Better for Everyone. London: Penguin.
Wolf, Martin. 2013. America’s fiscal policy is not in crisis. Financial Times (23, January): 9.
Wolff, Edward. 1996. Top Heavy: A Study of the Increasing Inequality of Wealth in America. New York: Twentieth Century Fund Press.
Wolff, Edward. 2010. Recent Trends in Household Wealth in the United States: Rising Debt and the Middle Class Squeeze – An Update to 2007. The Levy Economic Institute Working Papers (no. 589): 1–58.
Wray, L. Randall. 2004. Social Security: Truth or Useful Fictions? Center for Full Employment and Price Stability Policy Note (02/04): 1–7.
Wray, L. Randall. 2012. Modern Money Theory: A Primer on Macroeconomics for Sovereign Monetary Systems. Basingstoke: Palgrave Macmillan.