The Geopolitical Economy of the Ethanol Boom
June 26, 2014
Joseph Baines
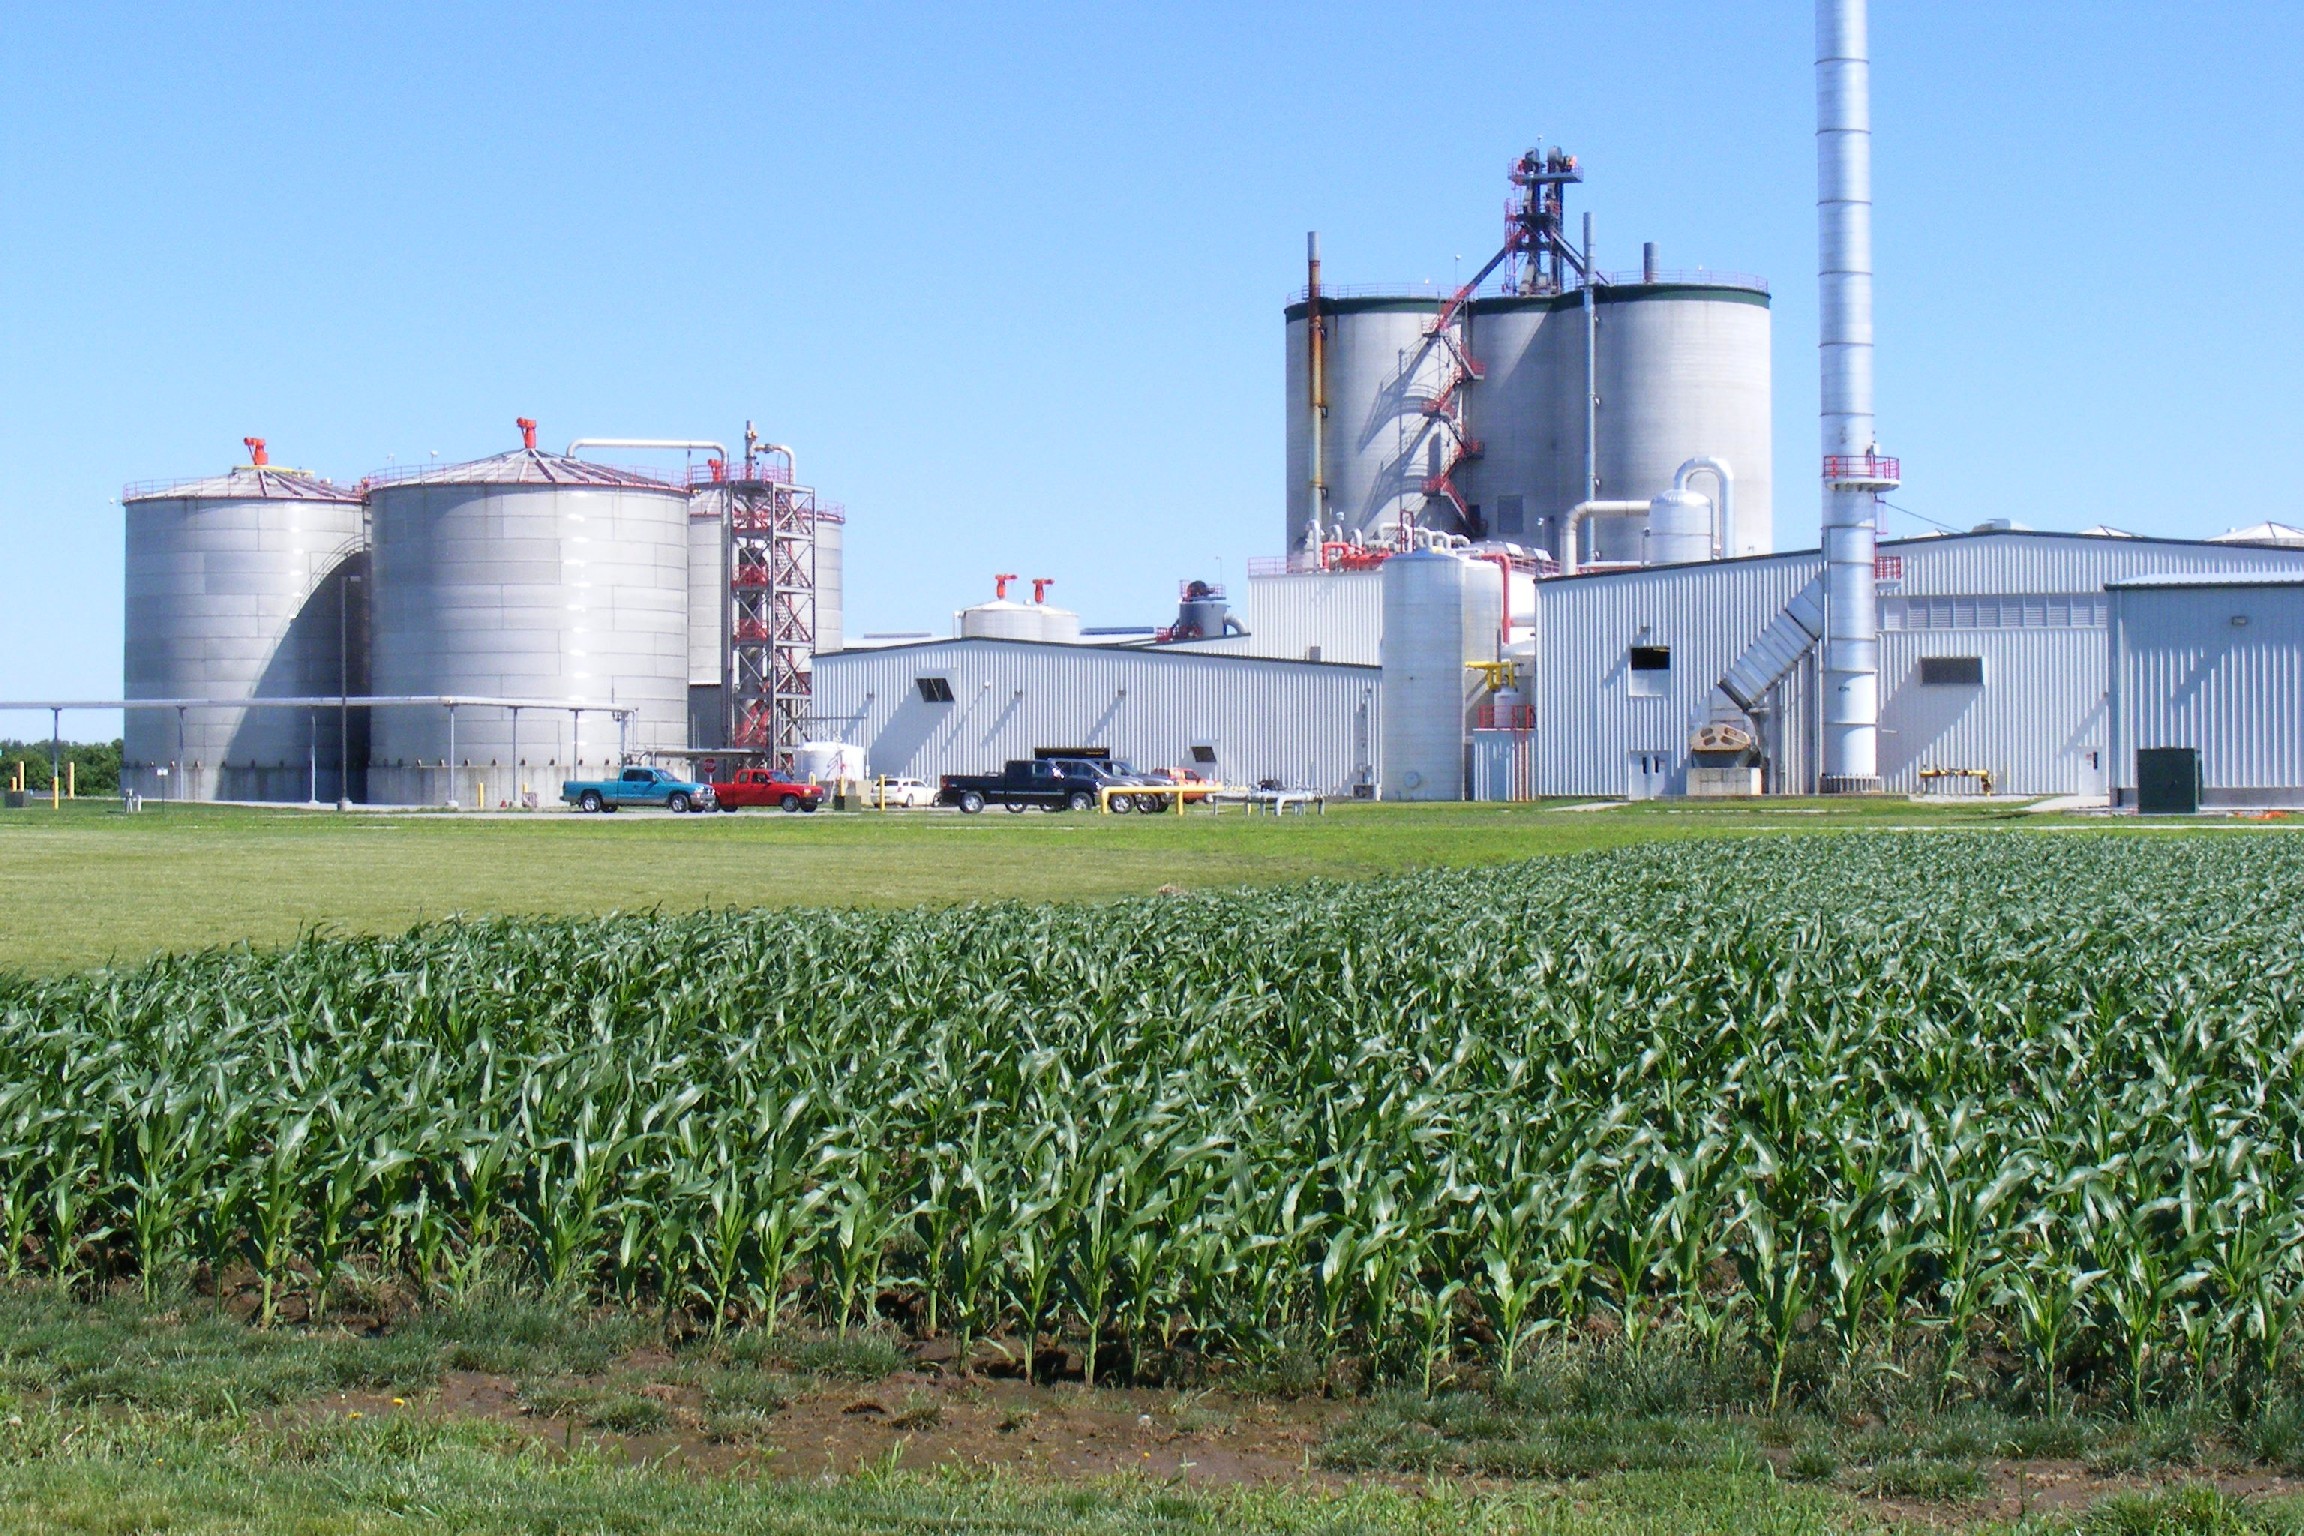
The corn-ethanol boom represents one of the most dramatic changes in the world food system in recent decades. The ethanol sector now absorbs around 40% of the corn produced in the US. Surging biofuels production (of which US corn-ethanol production accounts for about half) is widely considered to have played a key role in driving up food prices over the last 10 years. As a result, corn-ethanol, and biofuels more generally, has been on the receiving end of a lot of moral opprobrium, not only from the left but also from mainstream international governance institutions such as the IMF, the World Bank and the UN. When Dominic Strauss Kahn headed the IMF he proclaimed that biofuels ‘pose a real moral problem’. Kahn is, by all accounts, not an authority on moral issues, but his words were affirmed in 2013 by Jean Ziegler, former UN Special Rapporteur on the right to food, who stated that biofuels in fact are ‘a crime against humanity’.
In past work, I’ve examined the distributional consequences of the US ethanol boom on a global scale. My conclusion was that the process of diverting corn into ethanol feedstocks has been encouraged by a powerful nexus of agricultural input and trading firms that stood to profit from ethanol production, at the grievous expense of those food insecure populations across the world that are most vulnerable to food price spikes. The ethanol-fueled food price inflation of the early twenty-first century is in this respect a mechanism of redistribution: enhancing the earnings of a small group of agro-food corporations, while at the same time increasing the living costs for people around the world.
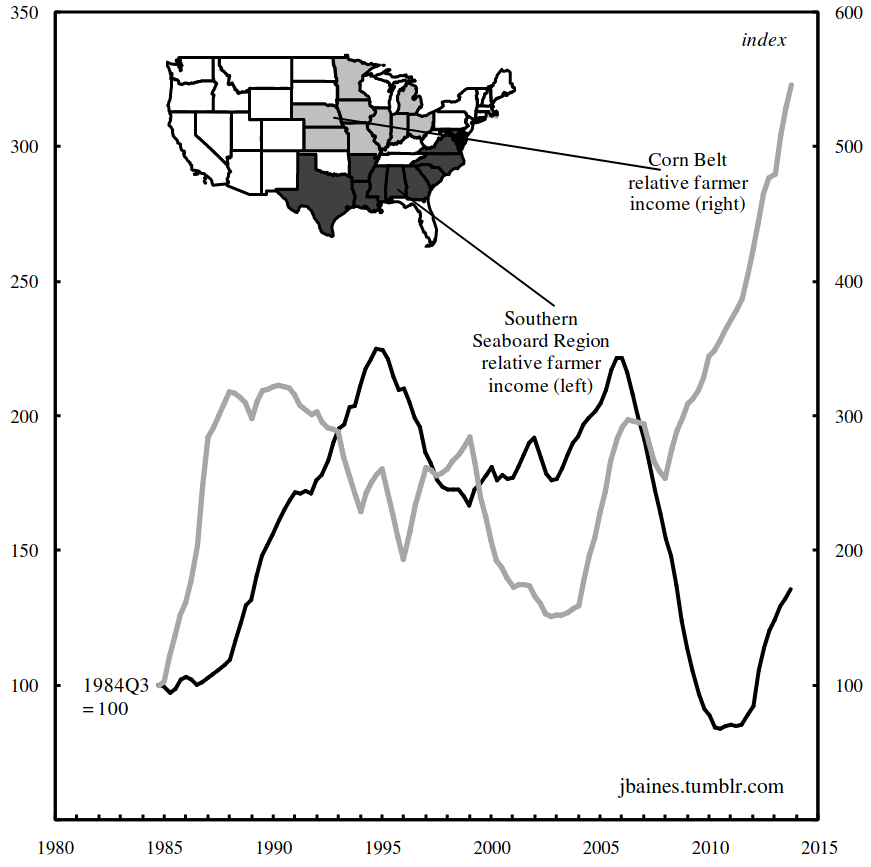
More recently, I have examined the distributional consequences of the ethanol bonanza within the US agricultural sector. Here is a chart that I drew up that did not make the cut for a paper that will hopefully soon be published. It depicts the average income of farmers in two major agricultural regions – the Corn Belt and the Southern Seaboard – relative to the average income of non-farm workers in the US. As its name suggest the Corn Belt is the central area for corn production in the US, and for commodity-crop production more generally. In contradistinction, the Southern Seaboard region grows very little grain. Instead, it is the region where much of the animals are raised for meat processing in the US. It contains the largest beef producing state (Texas), the three largest chicken producing states (Alabama, Arkansas and Georgia), and the heartland of industrialized pork production (North Carolina).

Figure 6: The Relative Income of Farmers in the Corn Belt and the Southern Seaboard Region
Note: The Corn Belt comprises Iowa, Illinois, Ohio, Kansas, North Dakota, Michigan, Kansas, Nebraska and Minnesota. The Southern Seaboard region is represented by Texas, North Carolina, South Carolina, Mississippi, Georgia, Virginia, Delaware, Maryland, Arkansas and Alabama. Farm income data consists of the net income of sole proprietorships and partnerships that operate farms. For more information regarding the computation of these data see www.bea.gov/regional/pdf/lapi2010.pdf. Farm income data collected for each state and then weighted according to the farm population of each state. Famer relative income data calculated by dividing this weighted income data by the average hourly earnings of non-farm production workers for each year. Data are smoothed to 3-year moving averages. Farmer relative income data re-based at 100 in 1983 Q3.
Source: Farmers proprietors’ income data from the Bureau of Economic Analysis through Global Insight; series code: YENTAF. Average hourly earnings data of nonfarm workers from the Bureau of Labor Statistics through Global Insight. Series code: AHE@US.Q. State farm population data from USDA NASS (2012) Census on Agriculture: http://www.agcensus.usda.gov/ and from the USDA NASS (2013b) Agricultural Resource Management Survey: http://www.ers.usda.gov/data-products/arms-farm-financial-and-crop-production-practices/.
As you can see from the chart, from the mid-2000s onwards there has been a dramatic divergence in relative farmer income between both regions. While the relative income of Corn Belt farmers has been soaring over the last 8 years, the relative income of farmers in the Southern Seaboard has tanked. Seaboard income has risen somewhat since 2010, however it is nowhere near the zenith it reached in 2005. What explains the regional divergence in farmer incomes? It is partly to do with the impact of two key policy measures passed by US Congress: the 2005 Renewable Fuels Standard and the 2007 US Energy Independence and Security Act. Both of these legislative measures mandated the large-scale production of ethanol in the US. As corn is the central feedstock for ethanol in America, these mandates necessitated the large-scale re-channeling of corn from the livestock sector to the burgeoning biofuel sector.
This re-channeling had a baleful impact on livestock production in the US because corn accounts for about 90% grain used to feed American animals raised for meat. With more corn going into the production of fuel, feed costs rose markedly and the margins of livestock farmers were squeezed. Given the pronounced division of agricultural production in the US – between the predominantly grain-producing Corn Belt and the predominantly meat-producing Southern Seaboard – the corn-ethanol boom effectively drove a regional income shift within American agriculture – from livestock farmers in the Southern Seaboard region to the corn growers in the Midwest.
Why is this analysis important? It indicates that scaling back corn-ethanol production does not simply entail challenging the interests of a small group of incredibly powerful agri-food corporations. In fact, it necessarily involves confronting the interests of the 400,000 corn farms in the US, many of which have a direct stake in the continued diversion of their output into biofuels production. Moreover, it suggests that we need to factor geography into our analysis of price changes. As Nitzan and Bichler have argued, inflation is always and everywhere a redistributional phenomenon. Insofar as price changes affect different social constituencies unevenly across space, inflation is always and everywhere a geographical phenomenon as well.

It is interesting that we think of these two groups as sharing certain political ideals, identifying both regions with the Tea Party. Given the clear dependence of the corn farmers on government largesse of various forms, have we misunderstood where the Tea Party’s appeal is? Do these farmers understand the source of their own recent fortunes? Do they believe it to be the product of their individual guile and hard work? Or, do they secretly fear a Tea Party victory that could put an end to the government programs from which they benefit?