
Soft-wars
A Capital-as-Power Analysis of
Google’s Differential Power Trajectory

CHRIS MOURÉ
October 2021
Abstract
The capital as power framework, developed by Jonathan Nitzan and Shimshon Bichler, argues that the aim of business is not ‘profit maximization’ but the differential accumulation of social power. Using this framework as a theoretical starting point, I analyze the differential accumulation strategies of Google and Microsoft. I present qualitative and quantitative evidence demonstrating that, despite the fact that Google and Microsoft currently derive the majority of their profits from separate businesses (and so by conventional logic are not in direct competition with one another), the two firms are nonetheless engaged in antagonistic competition over control of the computing industry.
Keywords
big tech, capitalization, differential accumulation, differential profit, Facebook, Google, Microsoft
Citation
Mouré, Chris. 2021. ‘Soft-wars: A Capital-as-Power Analysis of Google’s Differential Power Trajectory’. Review of Capital as Power, Vol. 2, No. 1, pp. 71–90.
1 A hostile campaign
On August 3, 2011, David Drummond wrote a blog post claiming that Microsoft was waging “a hostile, organized campaign” against Google’s Android operating system. At the time, Drummond was Google’s1 Senior Vice President and Chief Legal Officer. The ‘hostile campaign’ he was referring to was Microsoft’s recent purchase (made through consortiums that included Apple) of a large number of patents from Novell Inc. and Nortel Networks Corporation. The goal of this purchase, Drummond argued, was to control two large blocks of patents around mobile technology (Drummond, 2011).
Purchased for $4.5 billion, the Nortel block consisted of some 6000 patents that, according to the Los Angeles Times, were considered “crucial to the future of mobile computing” (Olivarez-Giles, 2012). Later that year, Google responded by buying Motorola Mobility for $12.9 billion (Page, 2011). Yet shortly after the deal, Google began selling off parts of the company. By 2014, all that remained of Google-owned Motorola were its patents. According to Google founder Larry Page, these patents would “create a level playing field” and “protect the Android ecosystem” (Page, 2014).
This patent war, I argue, provides evidence of antagonistic competition between Google and Microsoft. The goal of this paper is to explore and interpret this competition using the framework of ‘capital as power’. By doing so, I hope to add to a growing body of capital-as-power research looking at the accumulation strategies of specific firms and industries.
The paper is organized as follows:
-
Section 2 reviews the capital-as-power framework developed by Jonathan Nitzan and Shimshon Bichler. I discuss their concept of ‘differential accumulation’, and outline why the contrasting modes of ‘breadth’ and ‘depth’ are relevant to the analysis of Google and Microsoft.
-
Section 3 explores the idea that Google and Microsoft are direct competitors, despite the fact that they draw on different sources of revenue. I argue that both companies pursue differential accumulation through the strategy of ‘breadth’ (rather than ‘depth’).
-
Section 4 analyzes the convergence of Google and Microsoft’s differential profits. I find that after this convergence, the two firms’ differential profitability became negatively correlated.
-
Section 5 analyzes Google and Microsoft’s internal and external ‘breadth’ strategies, which I find to be tightly related.
-
Section 6 concludes by discussing data limitations and by suggesting avenues for further inquiry.
2 Capital as power and the logic of differential accumulation
Nitzan and Bichler’s theory of ‘capital as power’ proposes that monetary earnings are a symbolic representation of the power struggle between different groups (Nitzan & Bichler, 2009, p. 218). Building on the work of economist and social critic Thorstein Veblen, Nitzan and Bichler divide society into two distinct yet interdependent spheres: ‘industry’ and ‘business’.
For Veblen, ‘industry’ consisted of the collectively held knowledge that underpinned society’s productive capacity. ‘Business’, on the other hand, was concerned only with profit. ‘Business’ used private property to restrain industry — an act of strategic exclusion that Veblen called ‘sabotage’ (Veblen, 1908, pp. 534–536). Following Veblen, Nitzan and Bichler argue that profit results not from the production of social goods, but from a firm’s ability to “strategically limit social creativity and well-being” (2009, p. 261).
Having negated a connection between profit and productivity, Nitzan and Bichler argue that profit should be interpreted ‘differentially’. What concerns capitalists, they propose, is the size of profit relative to other firms. This ‘differential’ profit, Nitzan and Bichler hypothesize, indicates firms’ relative power. Capitalists’ goal is therefore not to maximize profits, but to beat the average rate of return. To beat the average, firms seek ever-greater control over industry, as “others must be prevented from accessing the same earnings” (2009, pp. 246–247). In short, Nitzan and Bichler see capitalism as a process of ‘differential accumulation’.
Nitzan and Bichler argue that there are two distinct strategies for differential accumulation, strategies which they call ‘breadth’ and ‘depth’ (2009, p. 328). A ‘breadth’ strategy consists of expanding total profits at a rate faster than the average. Breadth can be achieved internally, through ‘green-field investment’. Or it can be achieved externally through ‘mergers and acquisitions’.
It is the latter strategy, Nitzan and Bichler propose, that is the more reliable route to differential accumulation. That is because green-field investment expands total production, effectively ‘lifting all boats’. In contrast, mergers and acquisitions increase a firm’s sales without expanding total sales. Mergers and acquisitions are therefore the more reliable strategy for differential accumulation — they increase a firm’s share of profit (2009, p. 331).
In contrast to ‘breadth’, which focuses on total profit, the strategy of ‘depth’ consists of raising a firm’s profit margin faster than the average (or lowering it more slowly). While accumulation through depth is effective in the short term, Nitzan and Bichler argue that it is riskier in the long term. The problem is that because depth entails conflict, it is likely to meet stronger resistance (2009, p. 332). As a result, firms avoid depth strategies when possible and instead focus on breadth — mergers and acquisitions in particular.
Capital-as-power researchers have applied the idea of differential accumulation to the analysis of specific industries (Hager, 2012; Nitzan & Bichler, 2002, Ch. 5) and more recently to the analysis of specific firms such as Walmart (Baines, 2014) and De Beers (Cochrane, 2017). This paper applies the concept of differential accumulation to two powerful firms in the computer technology industry: Microsoft and Google.
Although the two companies began with different sources of revenue, I argue that Google’s expansion has brought it into direct competition with Microsoft. In 2017, Google’s Android overtook Windows as the most used operating system (Lovejoy, 2017). Google applications like Chrome, Docs, and Gmail provide similar services to Microsoft’s Office suite. Google Search competes with Microsoft’s Bing. Both companies are pursuing markets in data analytics, AI, and social media. Finally, Google and Microsoft are both rapidly expanding their cloud computing businesses (Jones, 2021). In short, the two companies are competing for dominance in the tech industry.
3 The rise of Google: a new business, an old model
Compared to Microsoft, which rose to power in the 1980s, Google is a relatively new player in the tech industry. Formed in 1998, Google became powerful in the 2000s and today has revenue that rivals Microsoft.
On the surface, Google’s business model appears rather different from Microsoft’s model. Microsoft derives income by selling its software as a ‘product’. Google, however, gives its software away ‘for free’. Google then derives income by selling advertising space embedded within the software. Thus, from the start, Google’s income growth depended on ever-expanding revenues from advertising — a ‘breadth’ strategy.
Figure 1 shows three ways of looking at Google’s income growth. The grey line plots the growth of Google’s total revenue. The black line plots the growth of net income (profit). And the dashed line shows Google’s markup — the ratio of net income to total revenue.
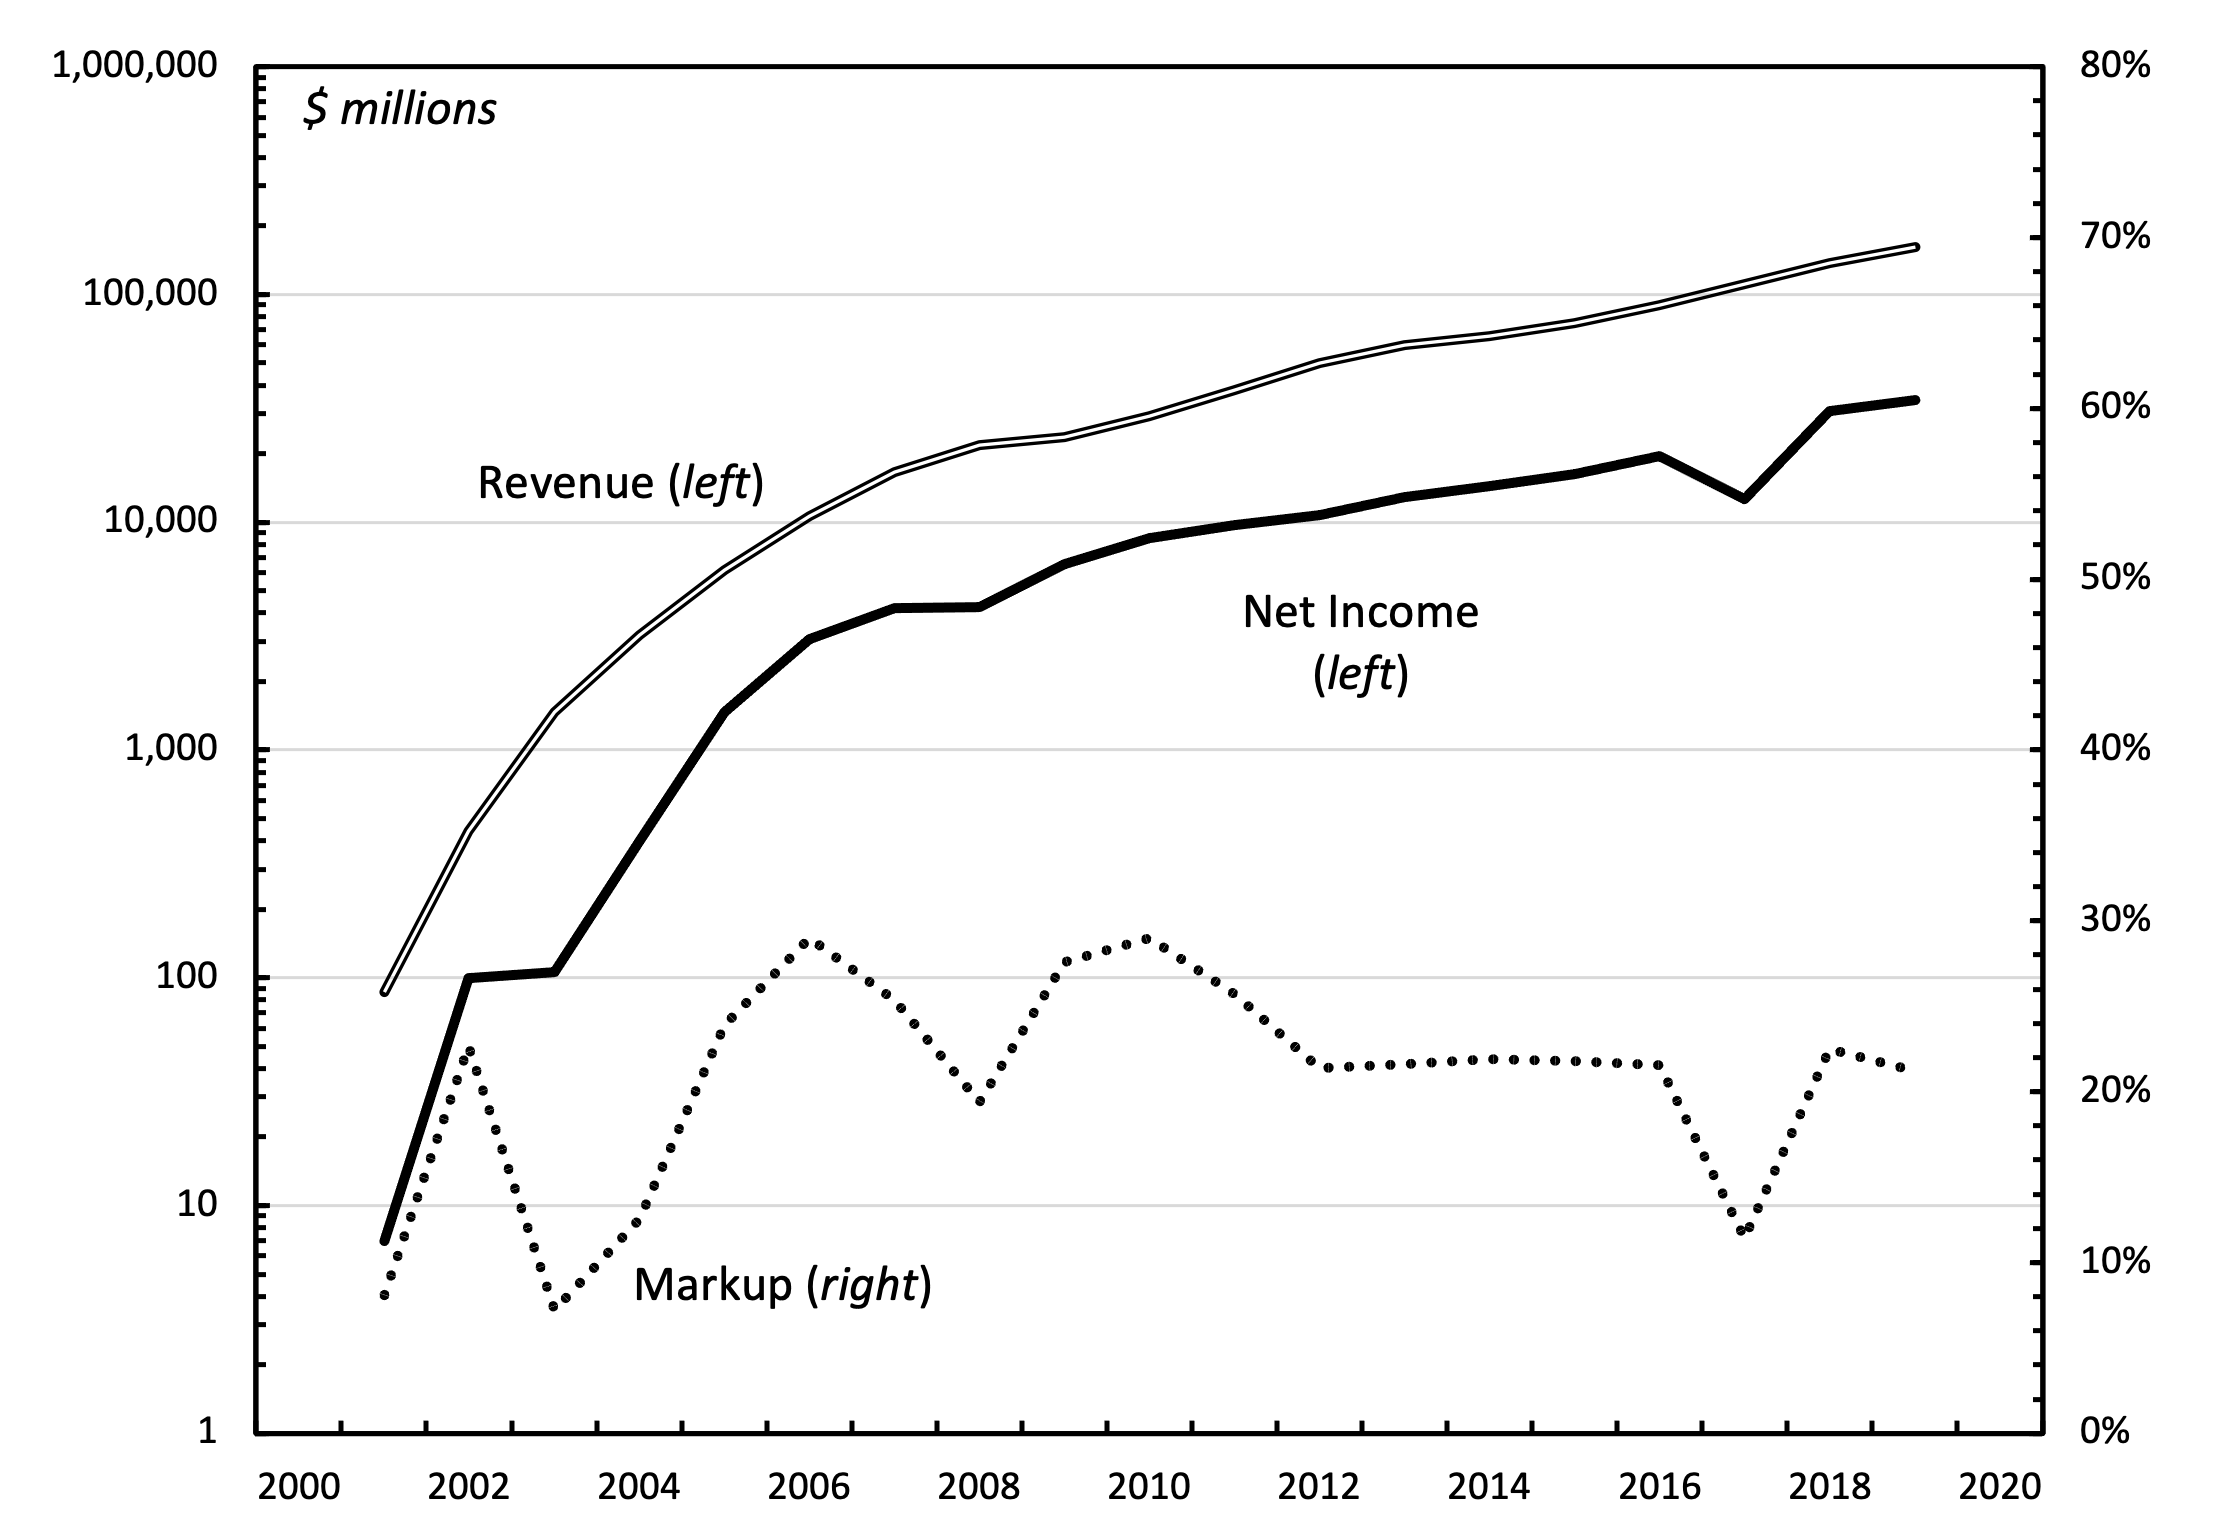 Figure 1: Google’s annual revenue, net income, and markup. Note: Annual markup is calculated as the ratio of net annual income to total annual revenue.
Source: Financial statements are from Mergent Online.
The evidence in Figure 1 illustrates Google’s pursuit of ‘breadth’. Google increased its profit (net income) almost entirely by increasing total revenue. Its markup (an indicator of ‘depth’) remained relatively constant, oscillating around 20-25%. So it appears that revenue growth is Google’s key strategy for increasing profits.
Although Google’s business model differs from Microsoft’s, its accumulation strategy appears to be similar — a fact illustrated by Figure 2. This figure shows the same analysis as in Figure 1, but now shows revenue, net income, and markup for Microsoft. As with Google, Microsoft’s profit growth depended mostly on increasing revenue. Also like Google, Microsoft’s markup fluctuated, but shows no clear trend.
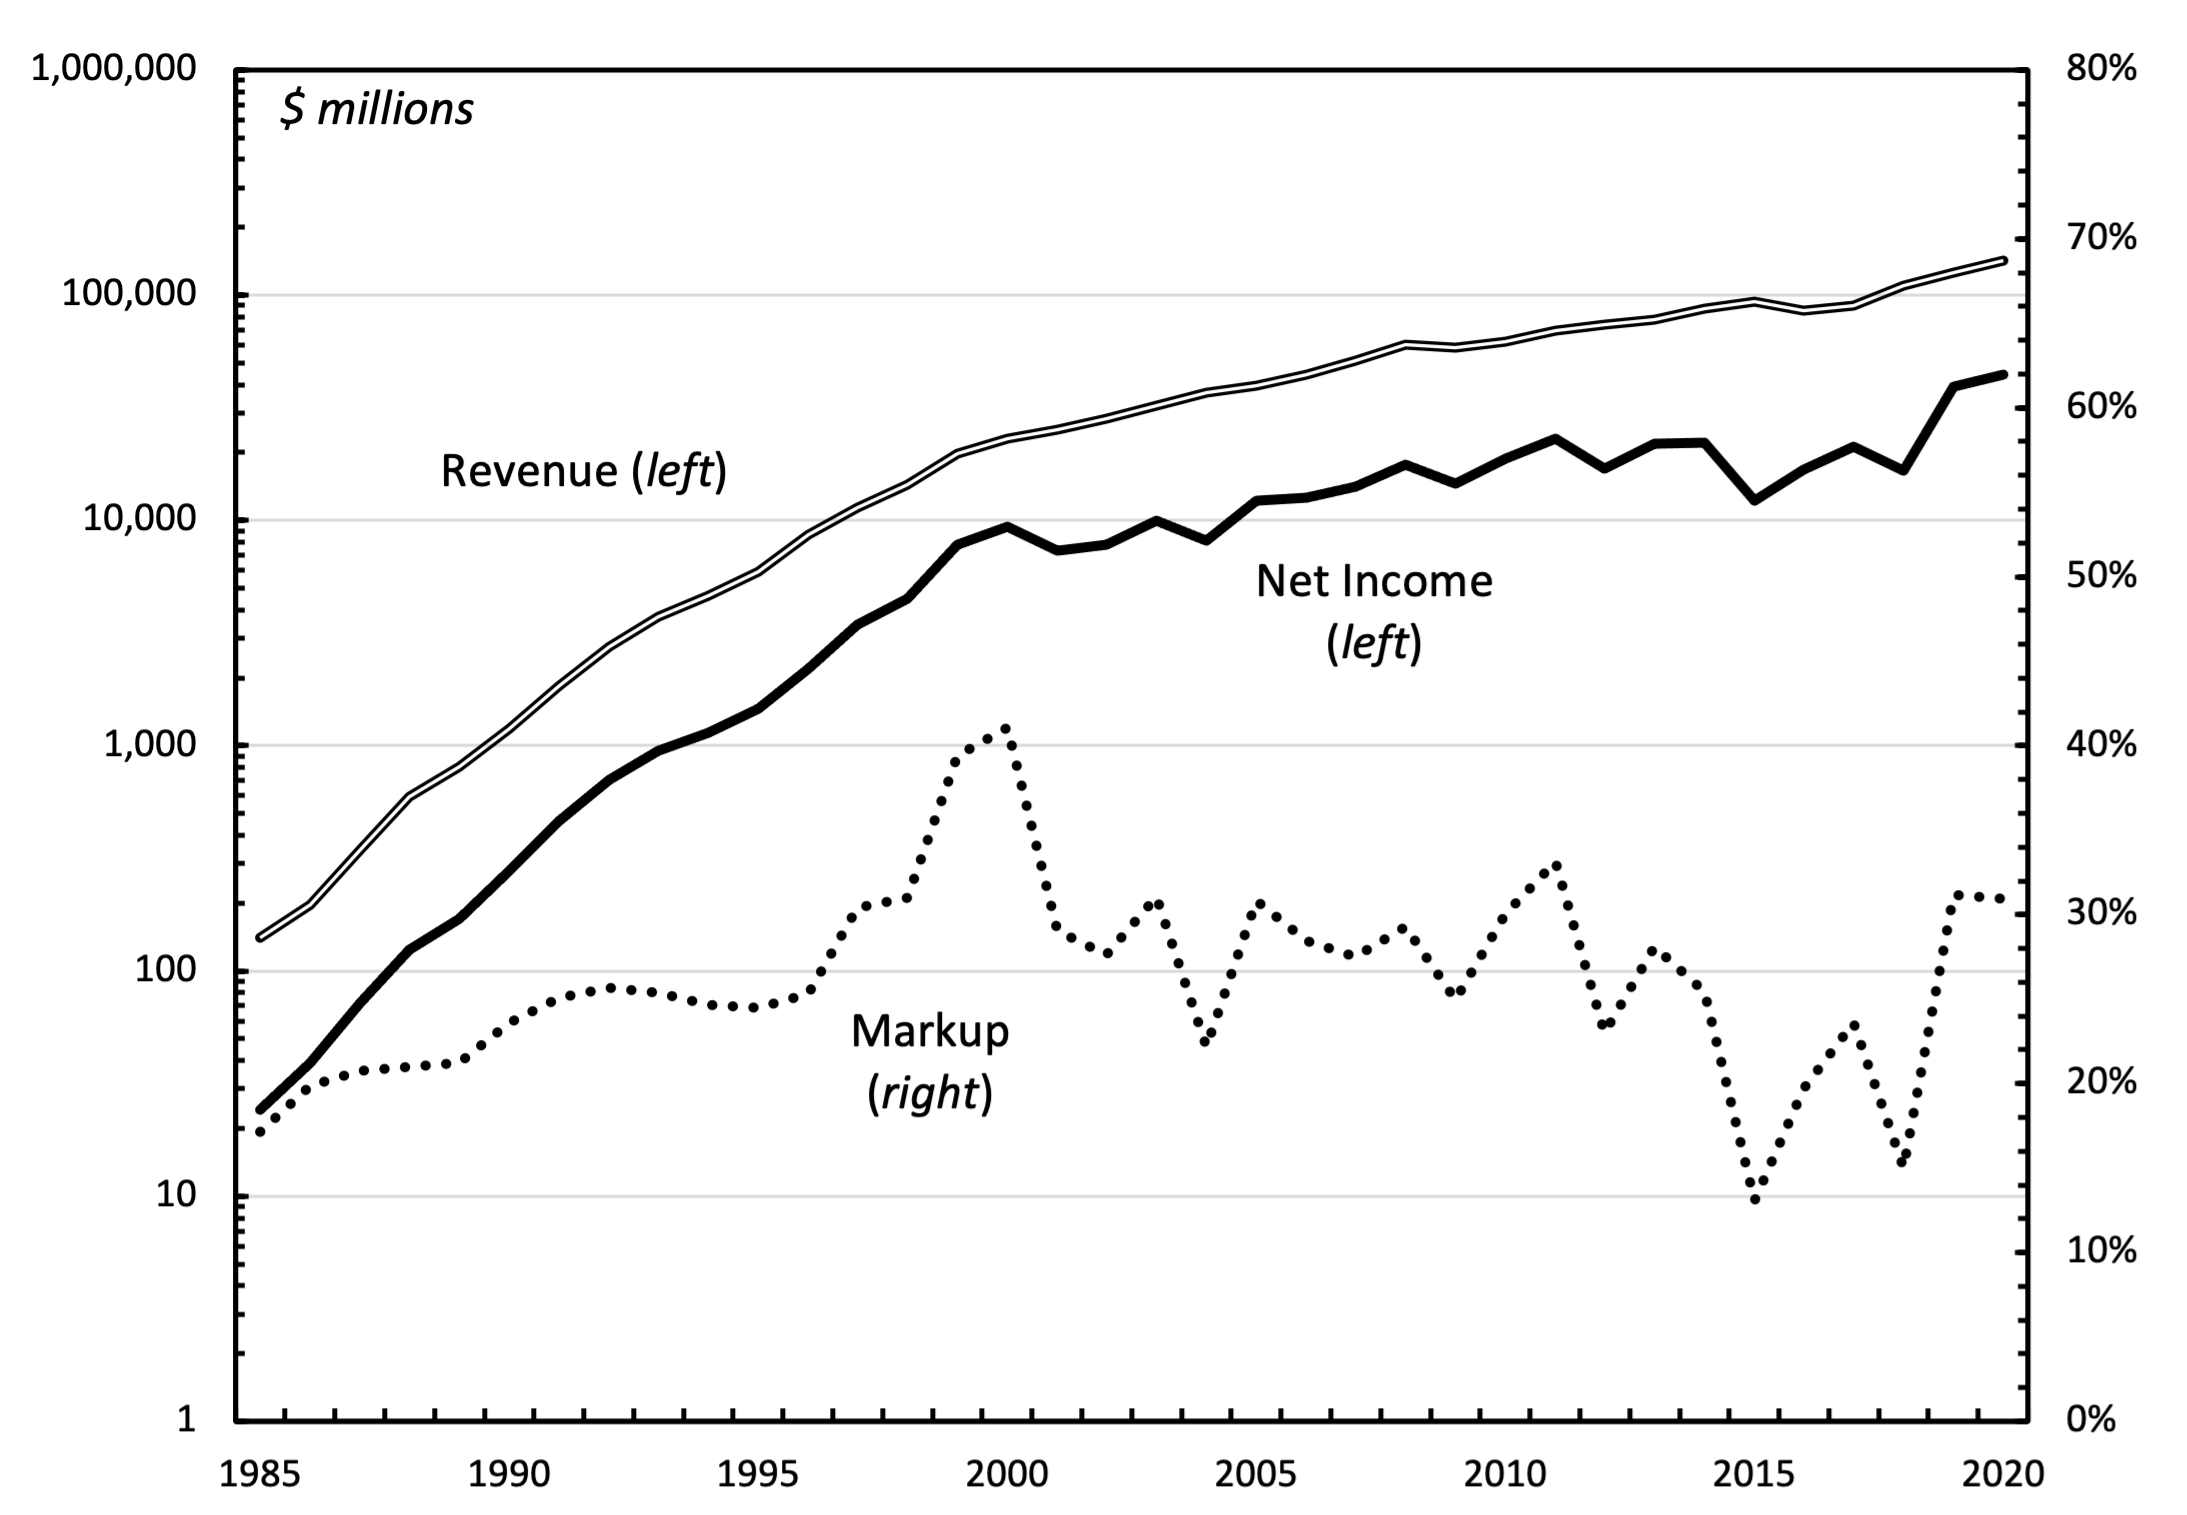
Figure 2: Microsoft’s annual revenue, net income, and markup.
Note: Annual markup is calculated as the ratio of net annual income to total annual revenue.
Source: Financial statements are from Mergent Online.
Having established Google’s reliance on ‘breadth’, let us now look at its strategy for increasing revenues. Google has always derived most of its income from advertising, yet sought to diversify this income stream. In 2008 and 2009, for instance, 97% of Google’s total revenue came from advertising. At the time, Google was already warning its investors that it expected revenue growth to slow:
We believe our revenue growth rate will generally decline as a result of a number of factors including increasing competition, the inevitable decline in growth rates as our revenues increase to higher levels, and the increasing maturity of the online advertising market.
(Alphabet, 2009, p. 37)
To bolster its profit, Google looked to sources of income outside the advertising business. However, these new activities failed to alter Google’s core revenue model. By 2019, Google still received 83% of its revenue from advertising (Alphabet, 2019, p. 29).
One of Google’s new businesses was the ‘Android’ operating system. With Android OS, Google tried to replicate the ‘ecosystem’ model developed by Microsoft (Bradley, 2017). Some commentators call this strategy a ‘walled garden’, but a better description would be a ‘monopoly’. By controlling the underlying operating system, Google sought (like Microsoft before it) to control the access point between software producers and software users. The goal of this monopoly, Michael Lewis observes, is to create a ‘tollbooth’ through which both consumers and producers must pay to access each other (1999, p. 71).
For now, though, this tollbooth remains largely indirect. Google has refrained from selling software directly, and instead continues to earn income by selling advertising space embedded in its software.
3.1 Why breadth?
Why have Microsoft and Google increased profits almost exclusively by increasing sales? Why have they not tried to raise prices? There are several plausible reasons for this reliance on ‘breadth’.
First, the software industry is a competitive place that is constantly expanding in new directions. Although the ‘ecosystem’ approach attempts to enclose and limit the free use of software, it is often unsuccessful. In general, software is a technology that remains relatively open and inexpensive to develop and transmit.
The problem (for monopolists) is that any Stanford dropout with a computer can create the next ‘game-changing’ piece of software. It is therefore difficult for companies like Microsoft and Google to ‘safely’ raise prices. Doing so would make them vulnerable to cheaper competition. For dominant companies with massive fixed costs and a coterie of expectant stockholders, the safer bet is instead to buy new companies as fast as possible. By doing so, big firms gain new intellectual property, and with it, new revenue streams.
A second reason for the reluctance to raise prices may be the cost of incurring antitrust backlash. A major benefit of Google’s ‘free service’ strategy is that it protects the company from antitrust prosecution. The reason is that since the 1980s, US antitrust law has been restricted to proving that monopoly harms ‘consumers’. And consumer ‘harm’, in turn, is defined solely in terms of increasing prices (Bork, 1978). Although its revenue comes almost entirely from advertisers, Google has successfully portrayed software users as its ‘consumers’. And since Google’s software is free, it is difficult to show that these consumers are harmed by Google’s monopoly.
This strategy reflects a broader trend in the tech industry, a trend prompted largely by the high-profile antitrust case against Microsoft at the turn of the millennium (Economides, 2001). After this case, the tech industry shifted from a focus on ‘production’ to a focus on the control of ‘access’.
Adopted by companies like Amazon, Uber and GrubHub, this strategy has a two-pronged approach. On the one hand, companies maintain cheap prices for end-use consumers, sometimes (as with Uber) to the point of direct subsidy. On the other hand, companies raise prices for access to their consumers. It is a model similar to the newspaper business of the 20th century. Software serves as a platform for attracting users, and these users are then sold to the highest bidder.
This two-sided model, adopted wholeheartedly by Google and increasingly by Microsoft, may be why both companies have pursued a breadth strategy over one of inflationary and disruptive depth.
4 Convergence means conflict
When Google began operations in the late 1990s, Microsoft was a tech titan. But it would take only a decade for Google to catch up.
Figure 3 plots Google’s rise, measured in terms of ‘differential profits’ (profits relative to the average net income of the ‘Global 500’ — the 500 largest firms in the world, ranked by revenue). In the early 2000s, Microsoft earned about 10 times more profit than the average Global 500 firm — a number that would remain relatively constant for the next two decades. Google, by contrast, entered the 21st century with about 100 times less profit than the average Global 500 firm. But by 2010, Google had closed the gap with Microsoft.
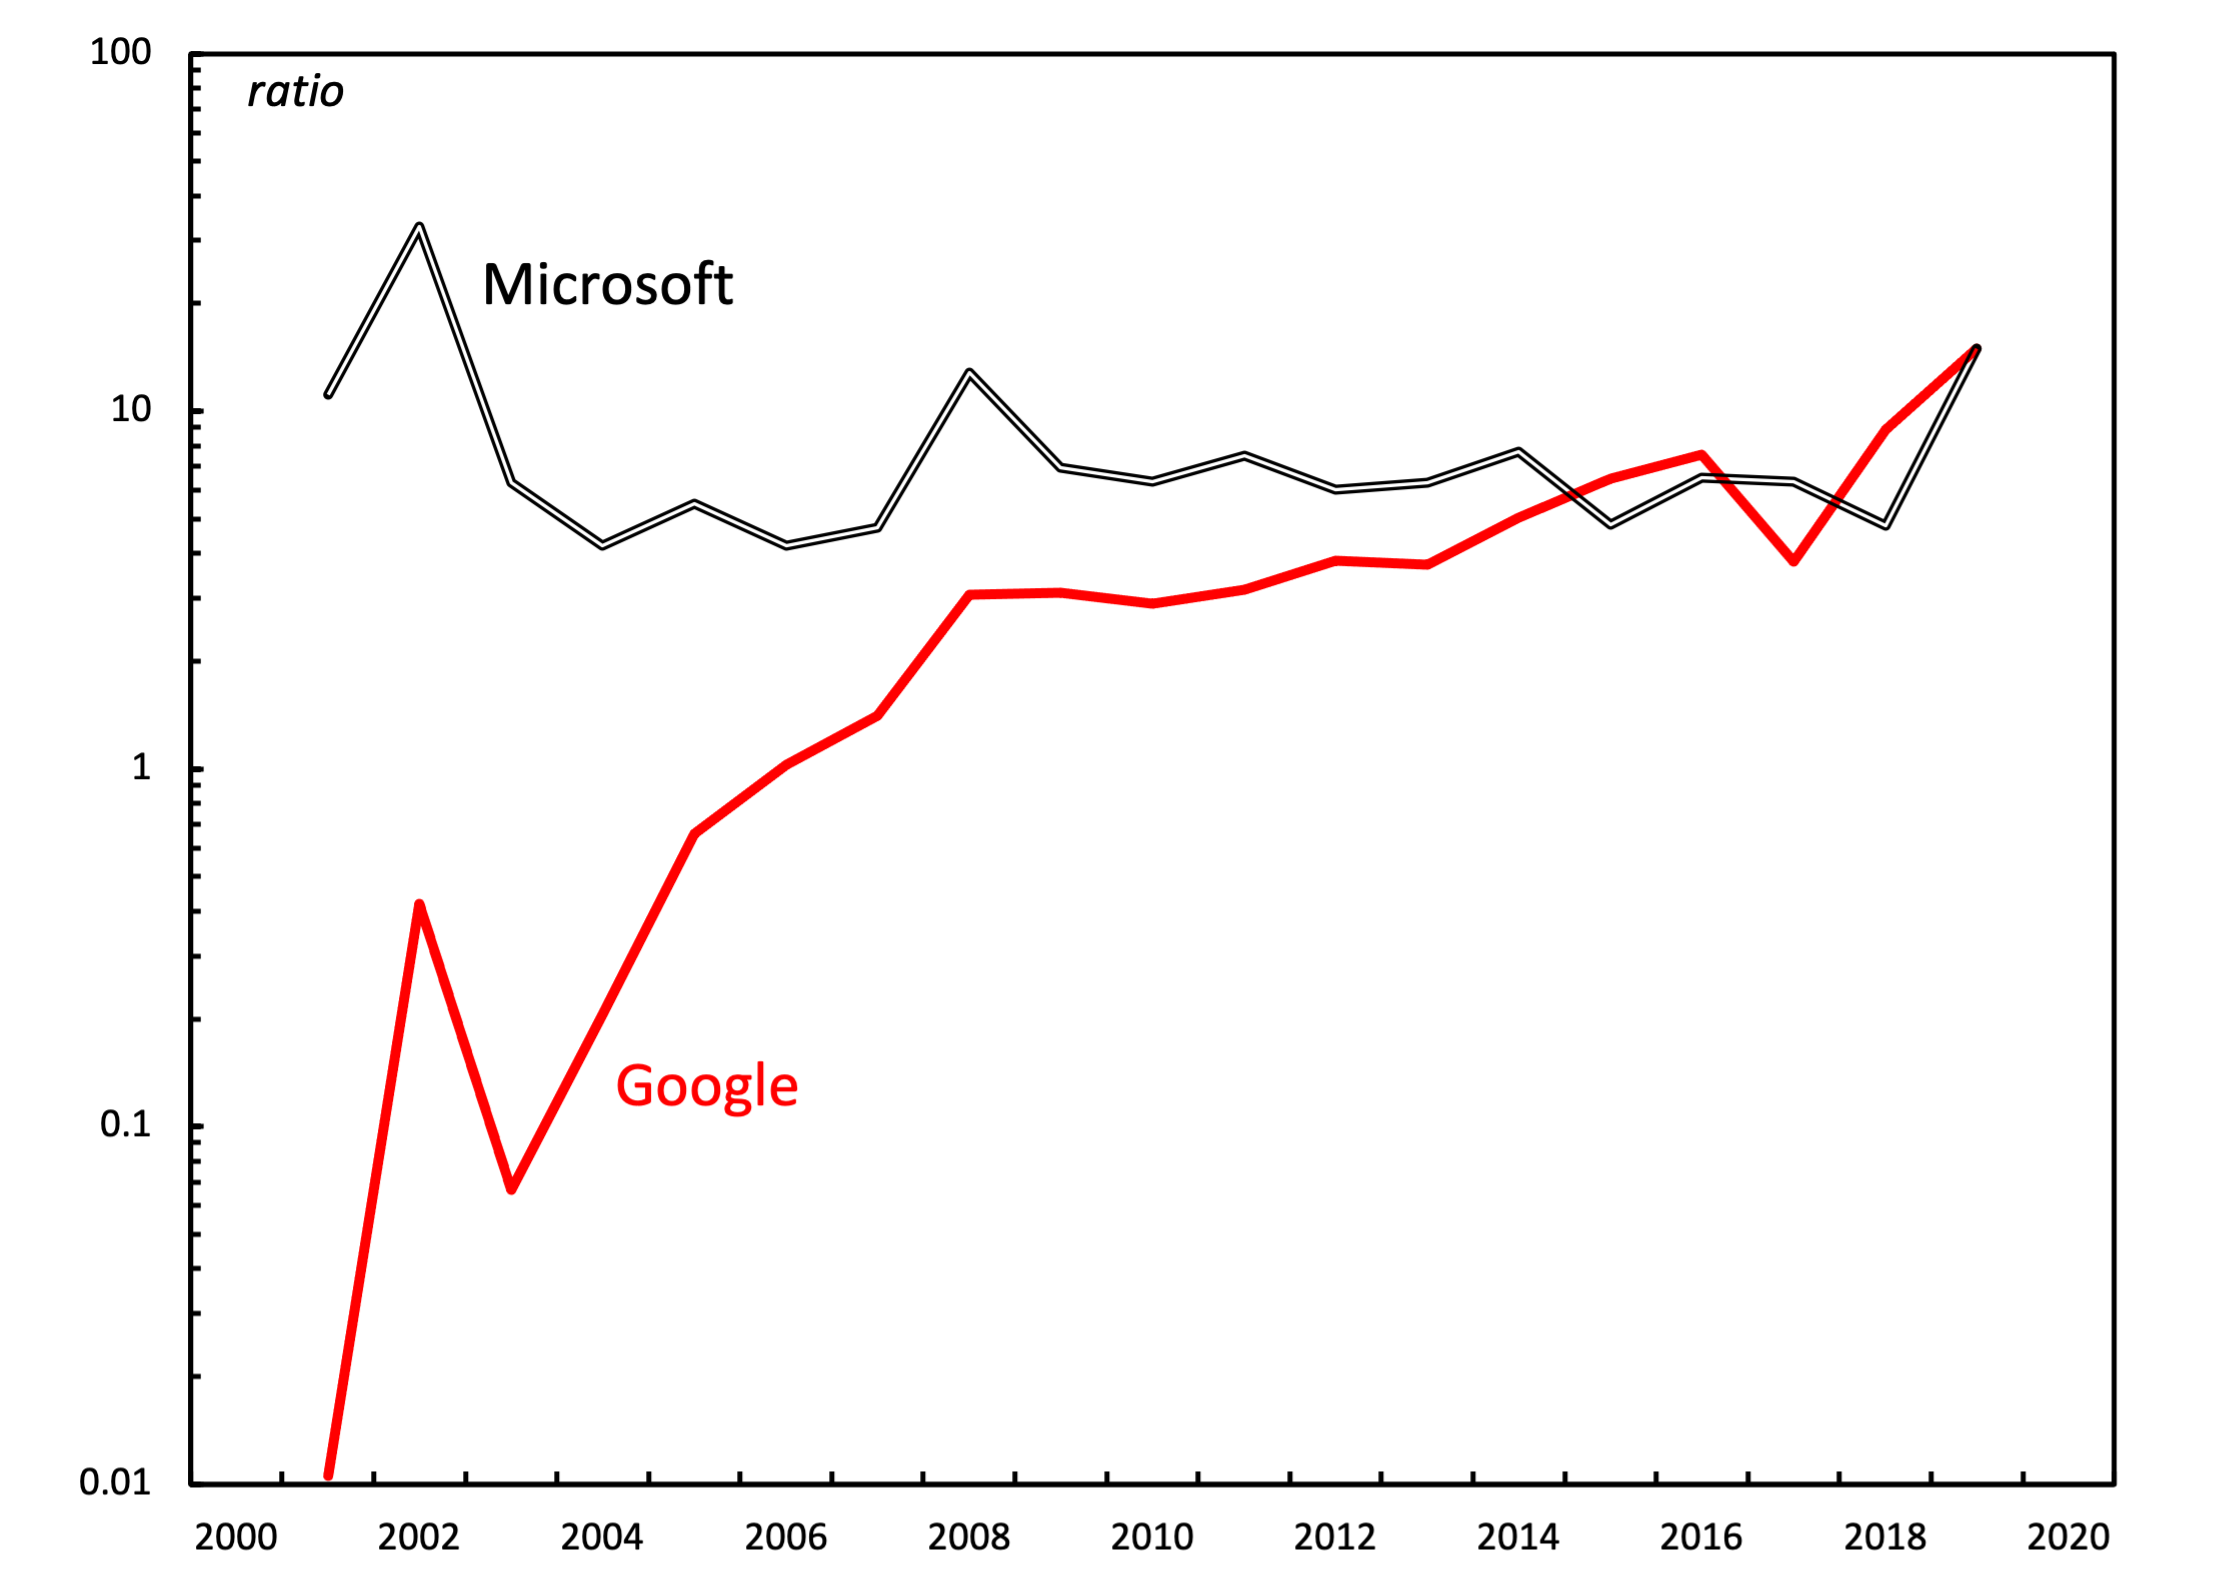
Figure 3: Annual differential profit — Google vs. Microsoft.
Note: Differential profit is the ratio of each firm’s annual net income to the average net income of the largest 500 global companies (ranked by revenue) in the Compustat database. Note that the y-axis uses a log scale
Source: Google and Microsoft income statements are from Mergent Online. Global average net income data is from Compustat (through WRDS), series codes NI and REVT.
As Google’s profits became comparable to Microsoft’s, the two companies became engaged in mutually antagonistic competition. Both firms attempted to gain breadth by “augmenting the relative size of [their] corporate organs” (Nitzan and Bichler 2009, 334). Interestingly, it was around this time that the profitability of the two companies changed ‘regimes’. Prior to 2010, Google’s profits correlated positively with Microsoft’s. But afterwards, the correlation turned negative.
Figure 4 shows this change in correlation. I plot here the growth rate of differential profitability for both Microsoft and Google. Prior to 2010, Google’s profitability moved together with Microsoft (correlation +0.69). From 2011 to 2019, however, the correlation turn negative ( \footnotesize -0.23 ). This divergence in profit growth rates occurred around the time that Google’s profits caught up to Microsoft’s (Figure 3). After that point, neither firm was able to substantially increase its differential profits.
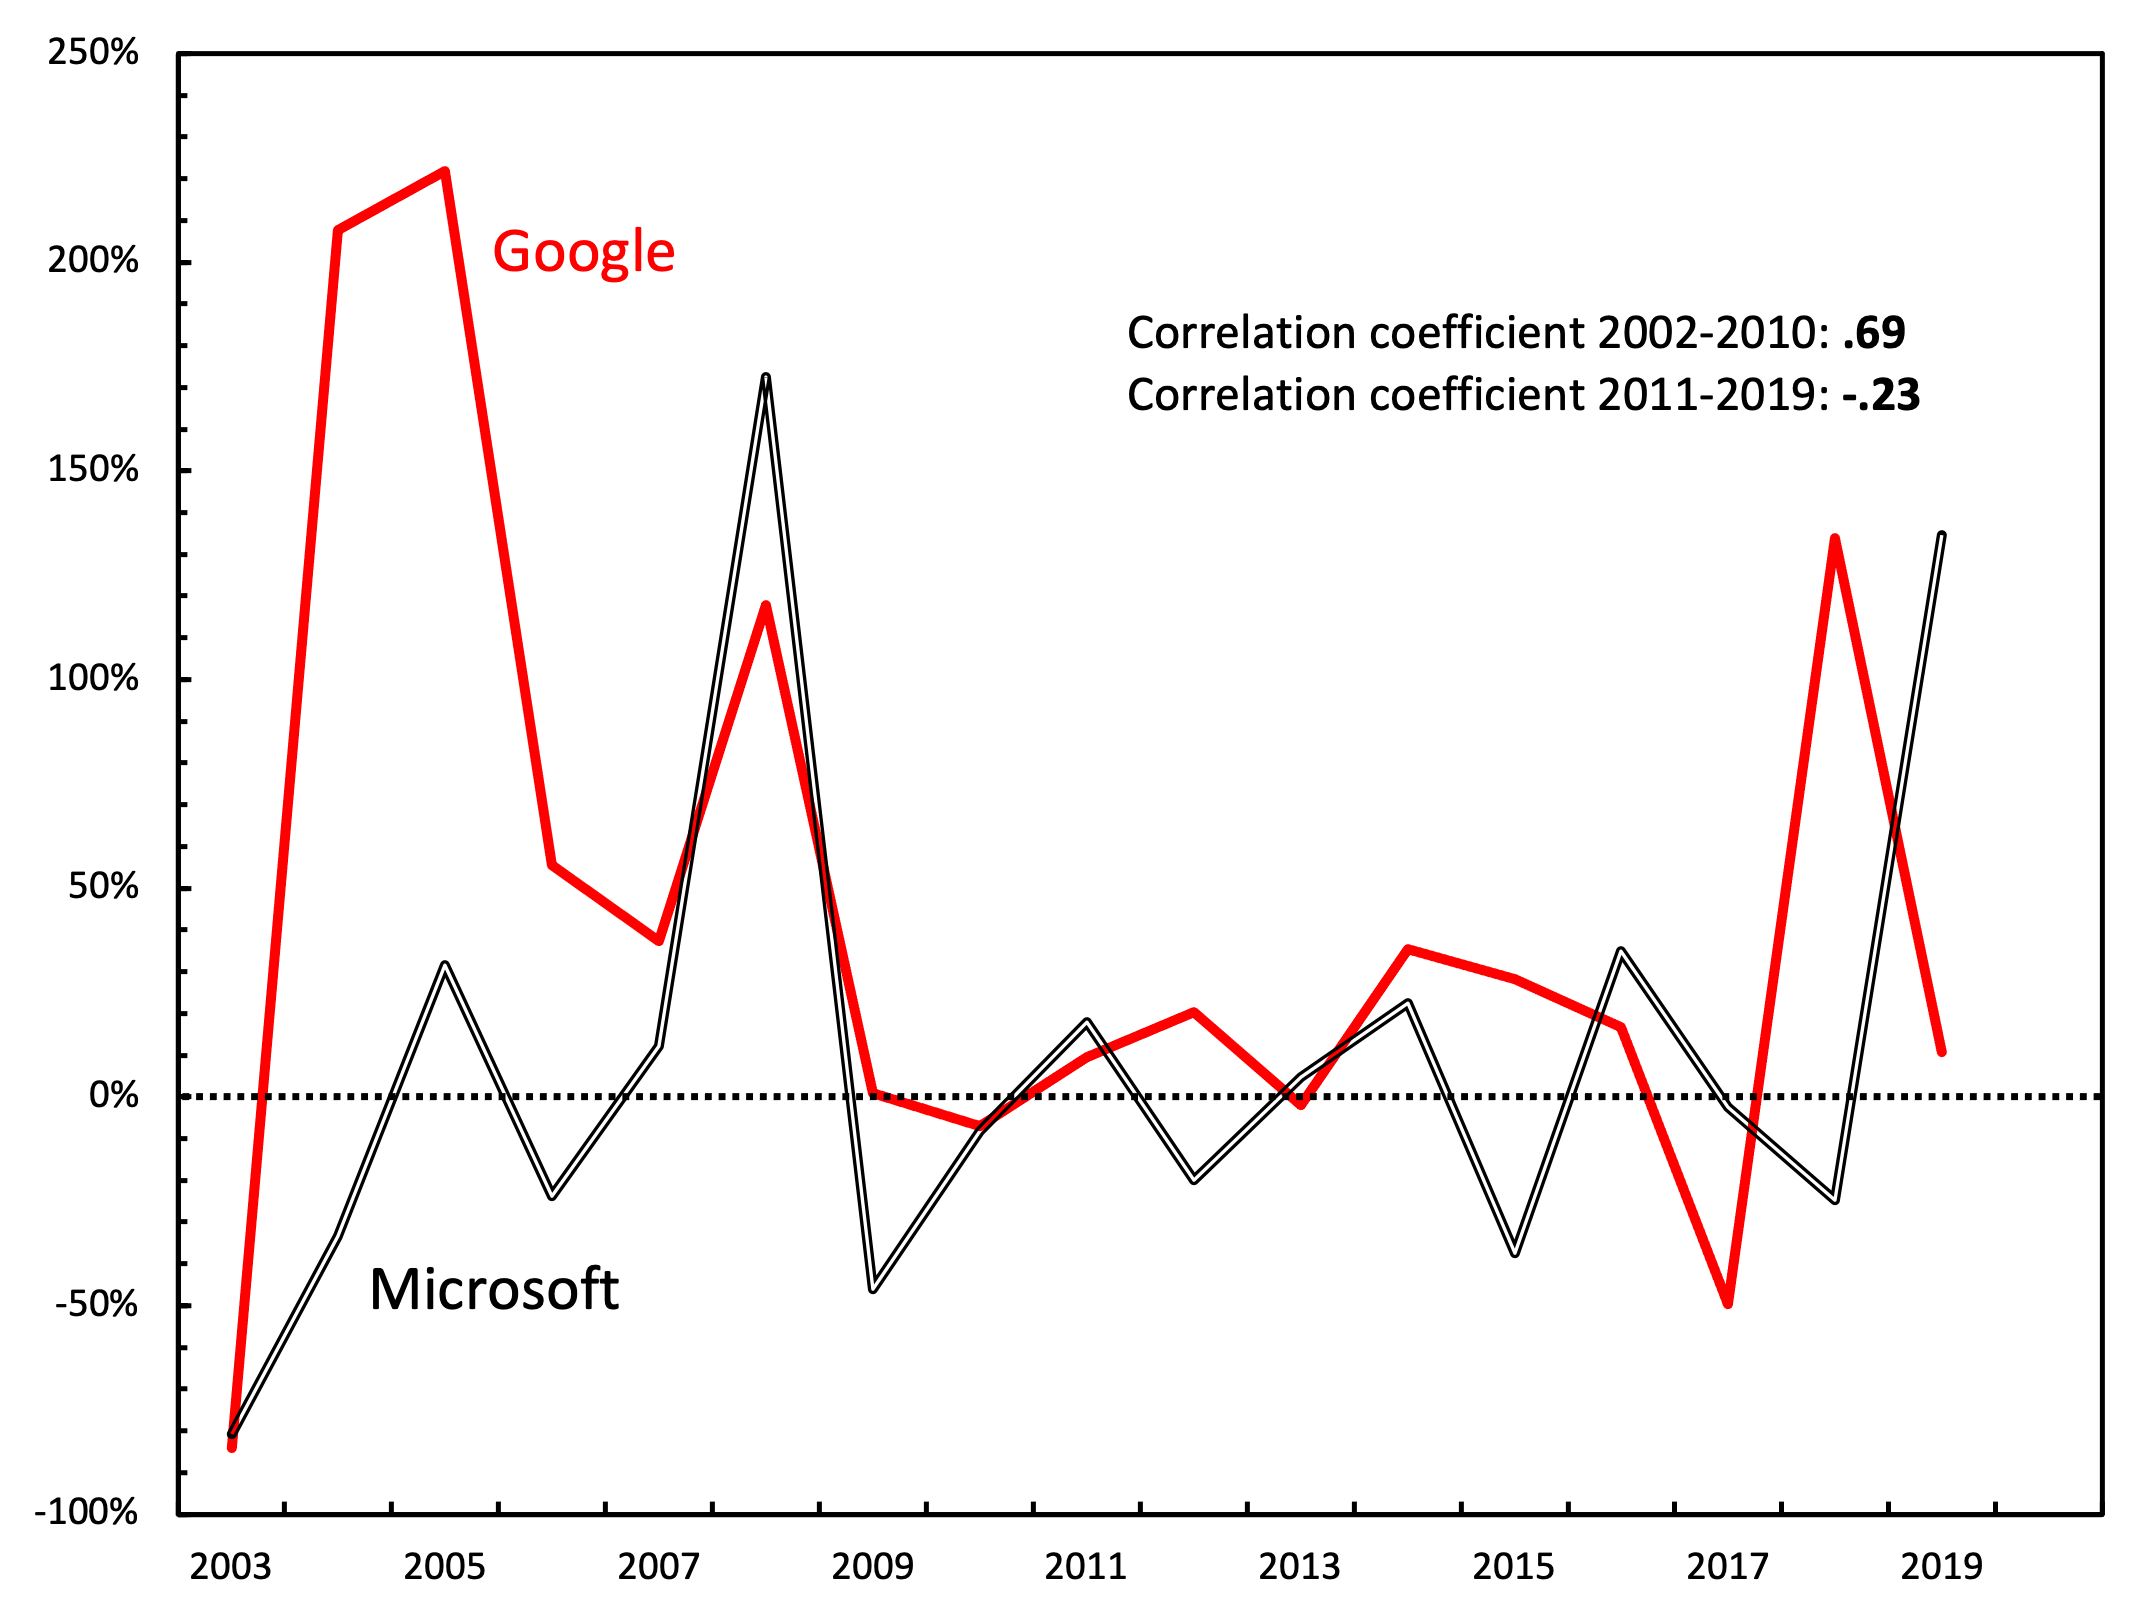
Figure 4: Annual rate of change in differential profitability — Google vs. Microsoft.
Note: Differential profit is the ratio of each firm’s annual net income to the average net income of the largest 500 global companies (ranked by revenue) in the Compustat database. Note that the y-axis uses a log scale
Source: Google and Microsoft income statements are from Mergent Online. Global average net income data is from Compustat (through WRDS), series codes NI and REVT.
I contend that these two trends are causally connected. That is, I propose that Google’s convergence to Microsoft-levels of profit caused the divergence of profit growth rates that followed. The idea is that once Google became as large as Microsoft, the two firms competed for the same income stream. Thus, after 2010, Google’s profit growth came at the expense of Microsoft’s bottom line (and vice versa). Both companies became monopolists, and therefore limited each other’s expansion.
Today, it is increasingly difficult for either Google or Microsoft to ‘beat the average’, for the simple reason that these firms are so large that they effectively are the average. Google is overwhelmingly dominant in the search engine market, controlling over 90% of the world’s internet searches. As such, there is little room for Google to expand. Microsoft is similarly dominant in business and productivity software, leaving little room for growth. Because of this dominance, both firms have no choice but seek growth outside their core business. As they foray into mobile computing, cloud computing, and everything in between, Google and Microsoft now compete directly with one another.2
Figure 5 reinforces this antagonistic relationship. I plot here the results of a two-step calculation. I first calculate the differential capitalization of both Google and Microsoft — their market value relative to the average market value of S&P 500 firms. Then I plot the rate of change of this differential capitalization.
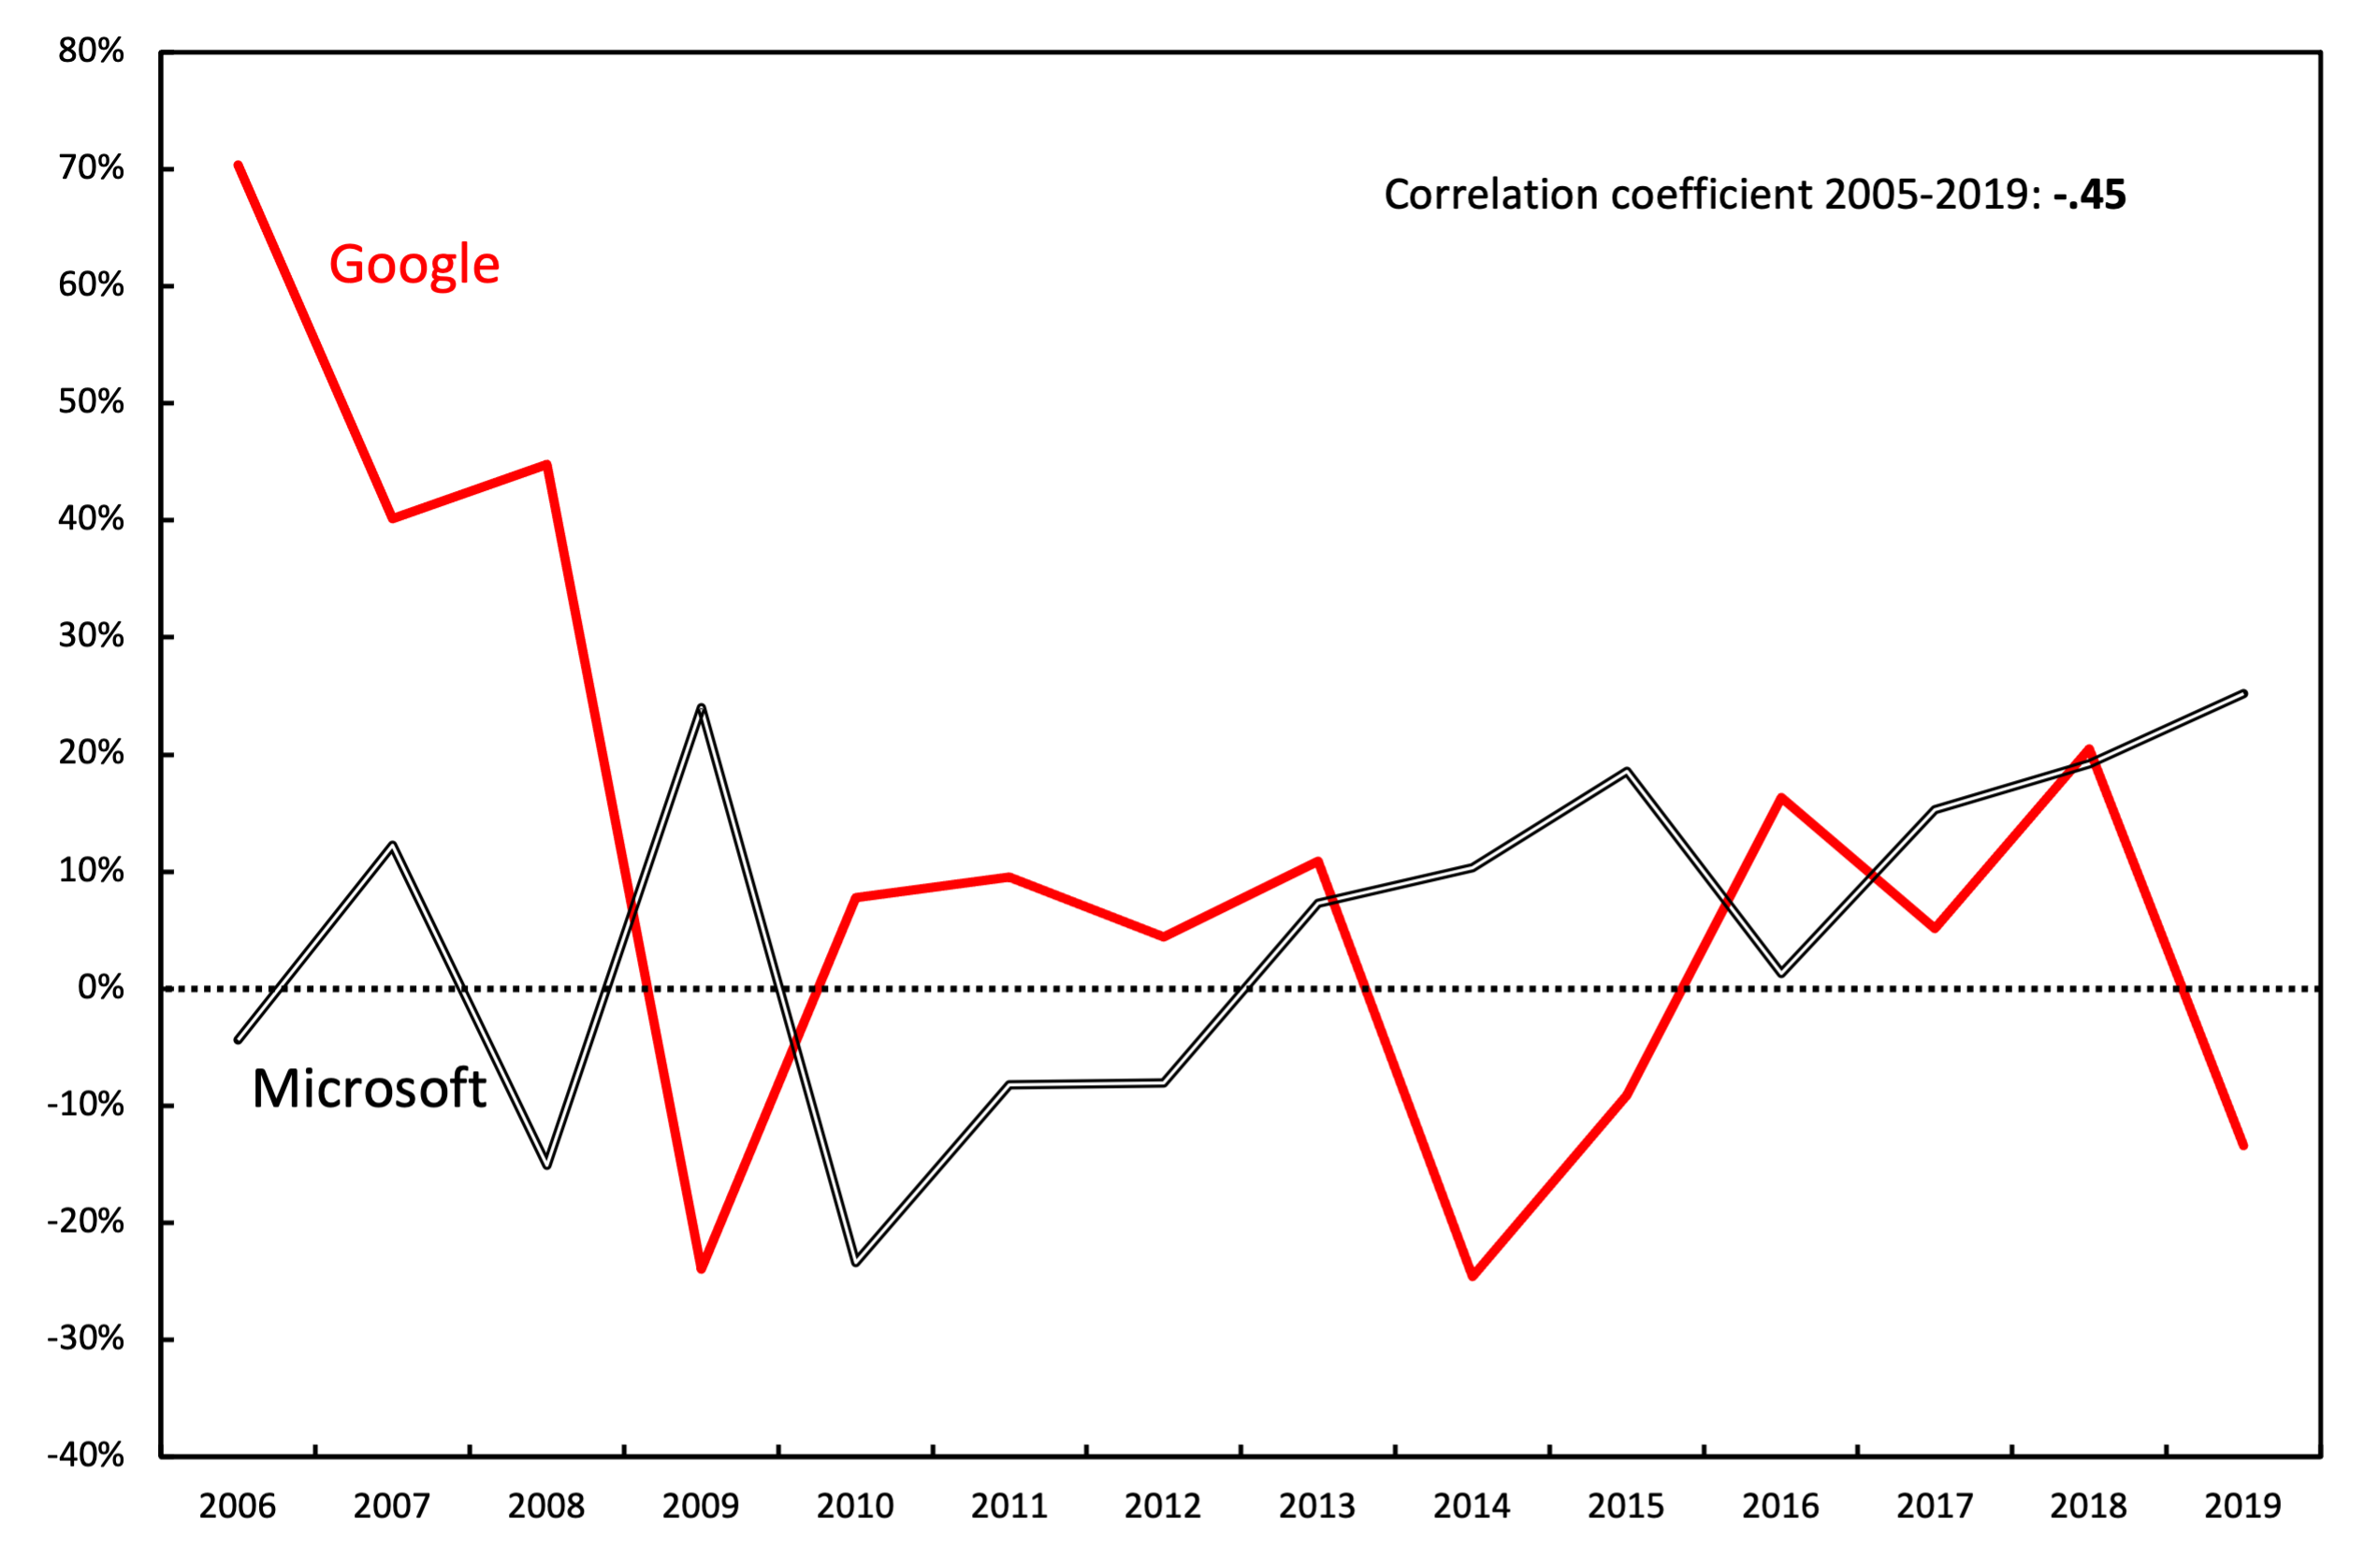
Figure 5: Annual rate of change in differential capitalization — Google vs. Microsoft.
Note: Differential capitalization is calculated as the ratio of each firm’s capitalization to the capitalization of the average S&P 500 firm.
Source: Microsoft’s and Google’s capitalization is calculated using data from Global Financial Data, tickers MSFT and GOOG L. S&P 500 capitalization is from Global Financial Data, symbol SCSP500D.
From 2005 to 2019, Google’s capitalization showed an antagonistic relation with Microsoft: their capitalization growth rates moved in opposite directions (correlation \footnotesize -0.46 ). This finding suggests that mutual conflict between the two firms may be a significant factor in predicting their future performance.
5 Trading punches
Continuing the analysis of Microsoft and Google’s antagonistic relationship, Figure 6 shows the markup of the two firms — their net income as a percentage of sales. Over the last 20 years, Microsoft’s markup trended slightly downward, while Google’s trended slightly upward. The two trends converged around 2018.
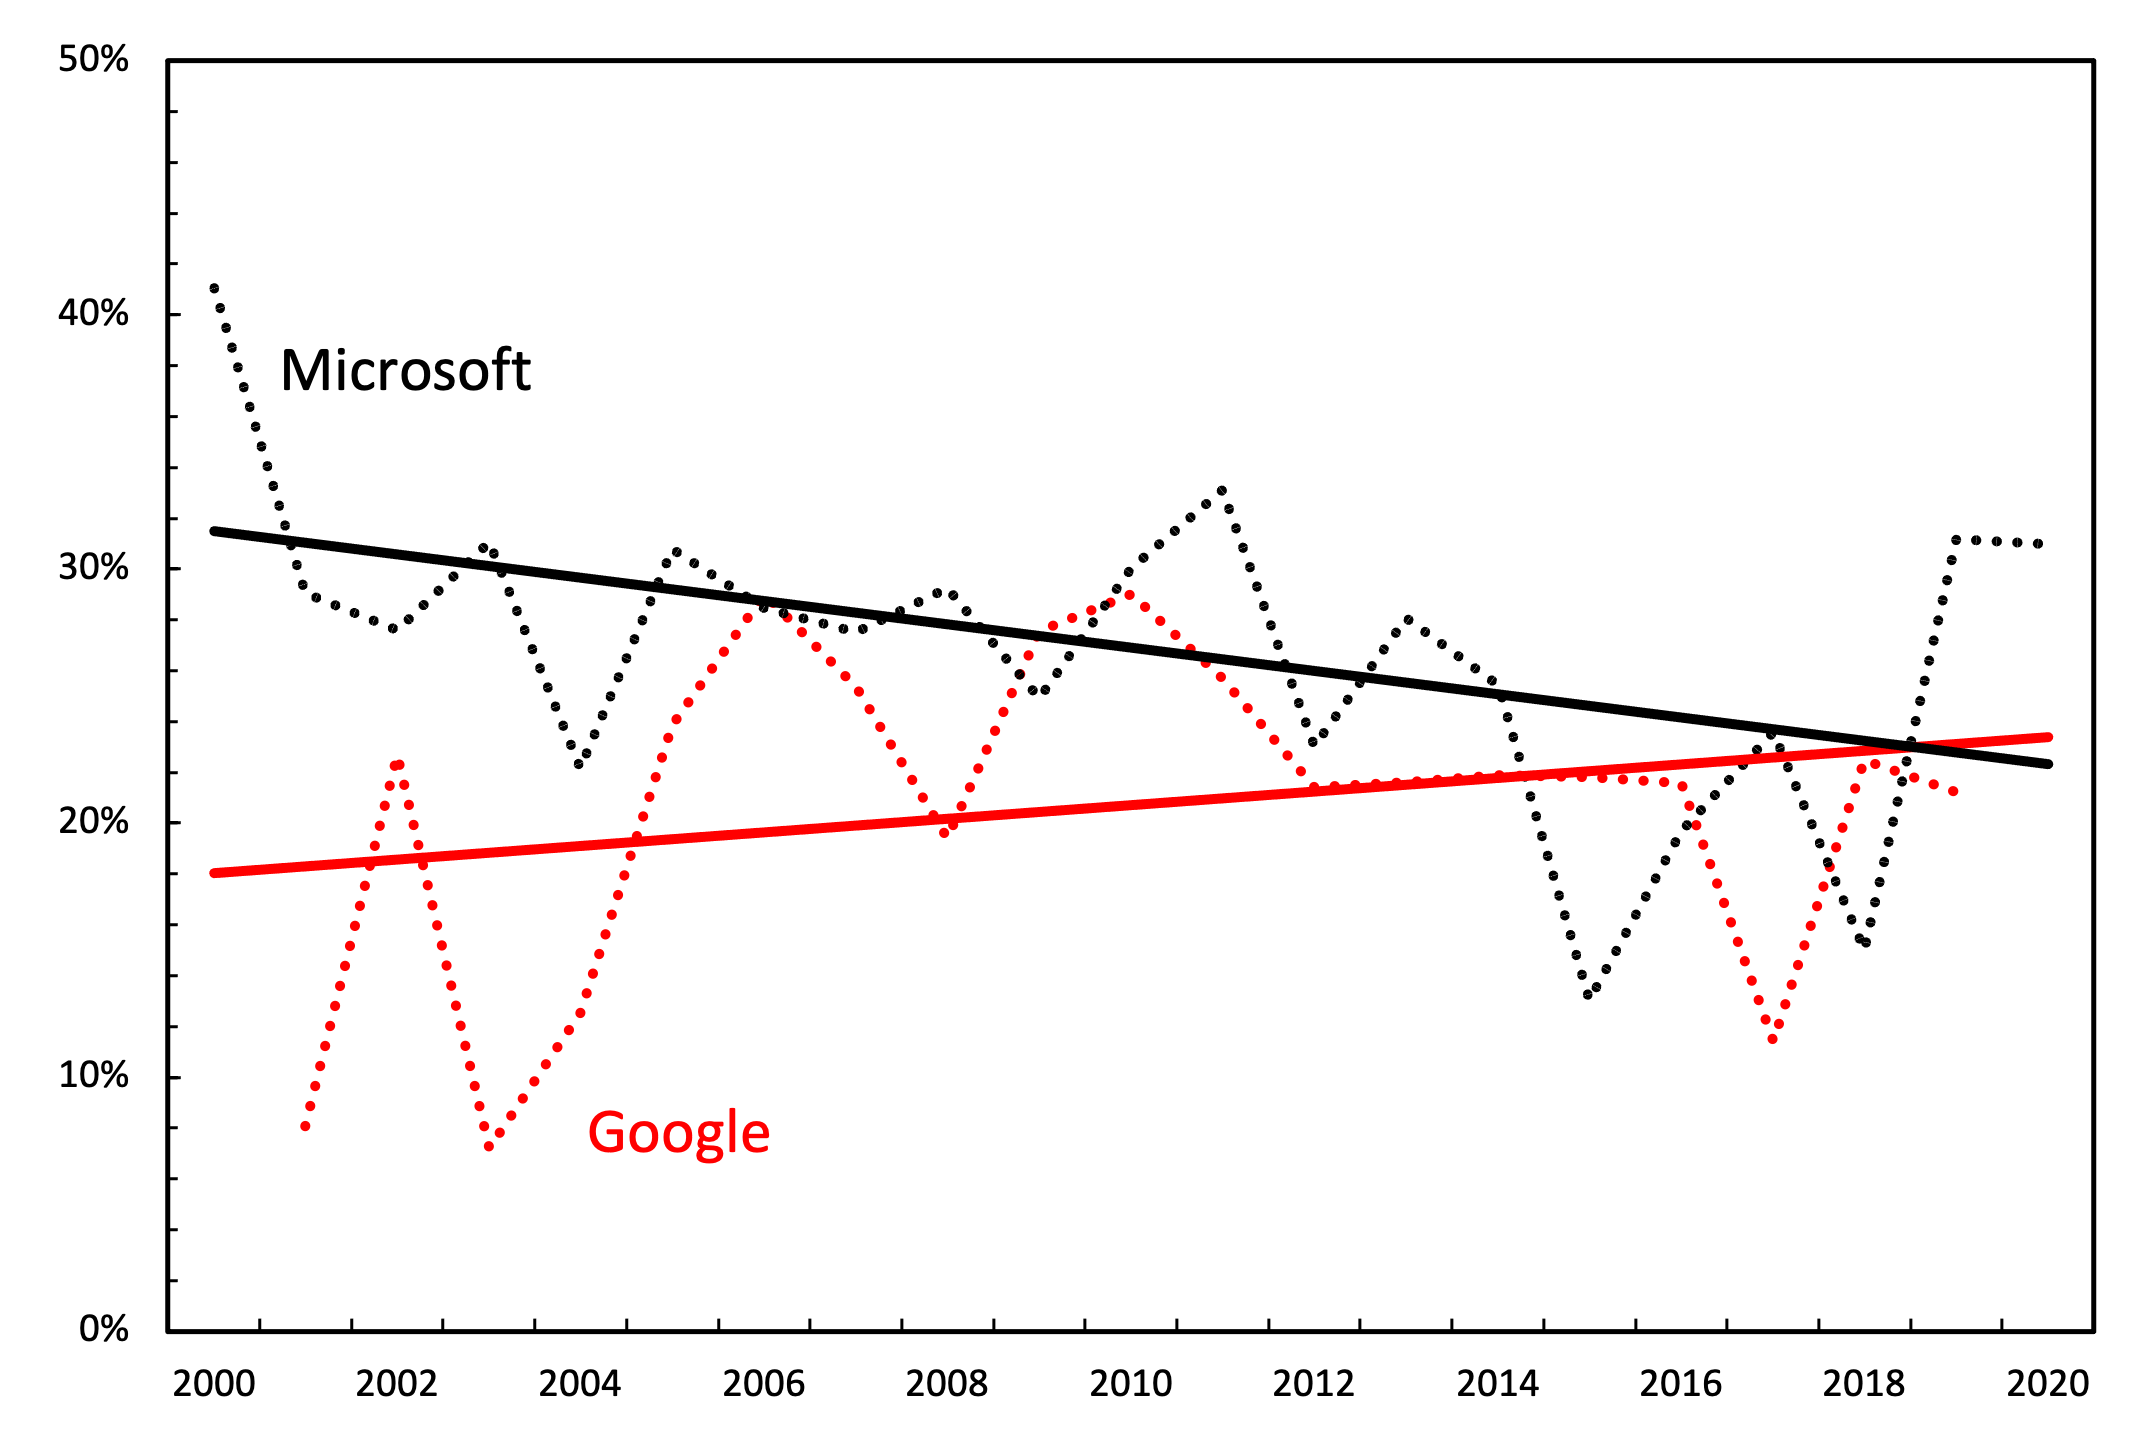
Figure 6: Annual markup — Google vs. Microsoft.
Note: Annual markup is calculated as the ratio of annual net income to total annual revenue. Trend lines indicate linear regressions.
Source: Income statements are from Mergent Online.
What might have caused the markup convergence? One possibility is that in a bid to remain competitive with Google, Microsoft was forced to lower prices. This hypothesis seems unlikely, however, as the two firms’ core products do not compete directly with one another. Another possibility is that the markup convergence resulted from convergent ‘costs’. I use scare quotes here because I do not mean costs of production. I mean the ‘costs’ of remaining powerful.
Recall (from Figures 1 and 2) that Google and Microsoft have historically increased their profit by increasing their revenue — a strategy that Nitzan and Bichler call ‘breadth’. This strategy comes with costs, namely the expenses associated with green-field investment and/or the cost of merges and acquisitions. For Google and Microsoft, it turns out that these costs of ‘breadth’ have converged.
Figure 7 shows the converging costs of green-field investment, measured using spending on ‘property and equipment’. Relative to Microsoft, Google started the 21st century spending an order of magnitude less on green-field investment. But by 2010, this spending had converged. Today, Google spends slightly more on green-field investment than Microsoft. Overall, the correlation between these two firms’ purchases is +0.96.
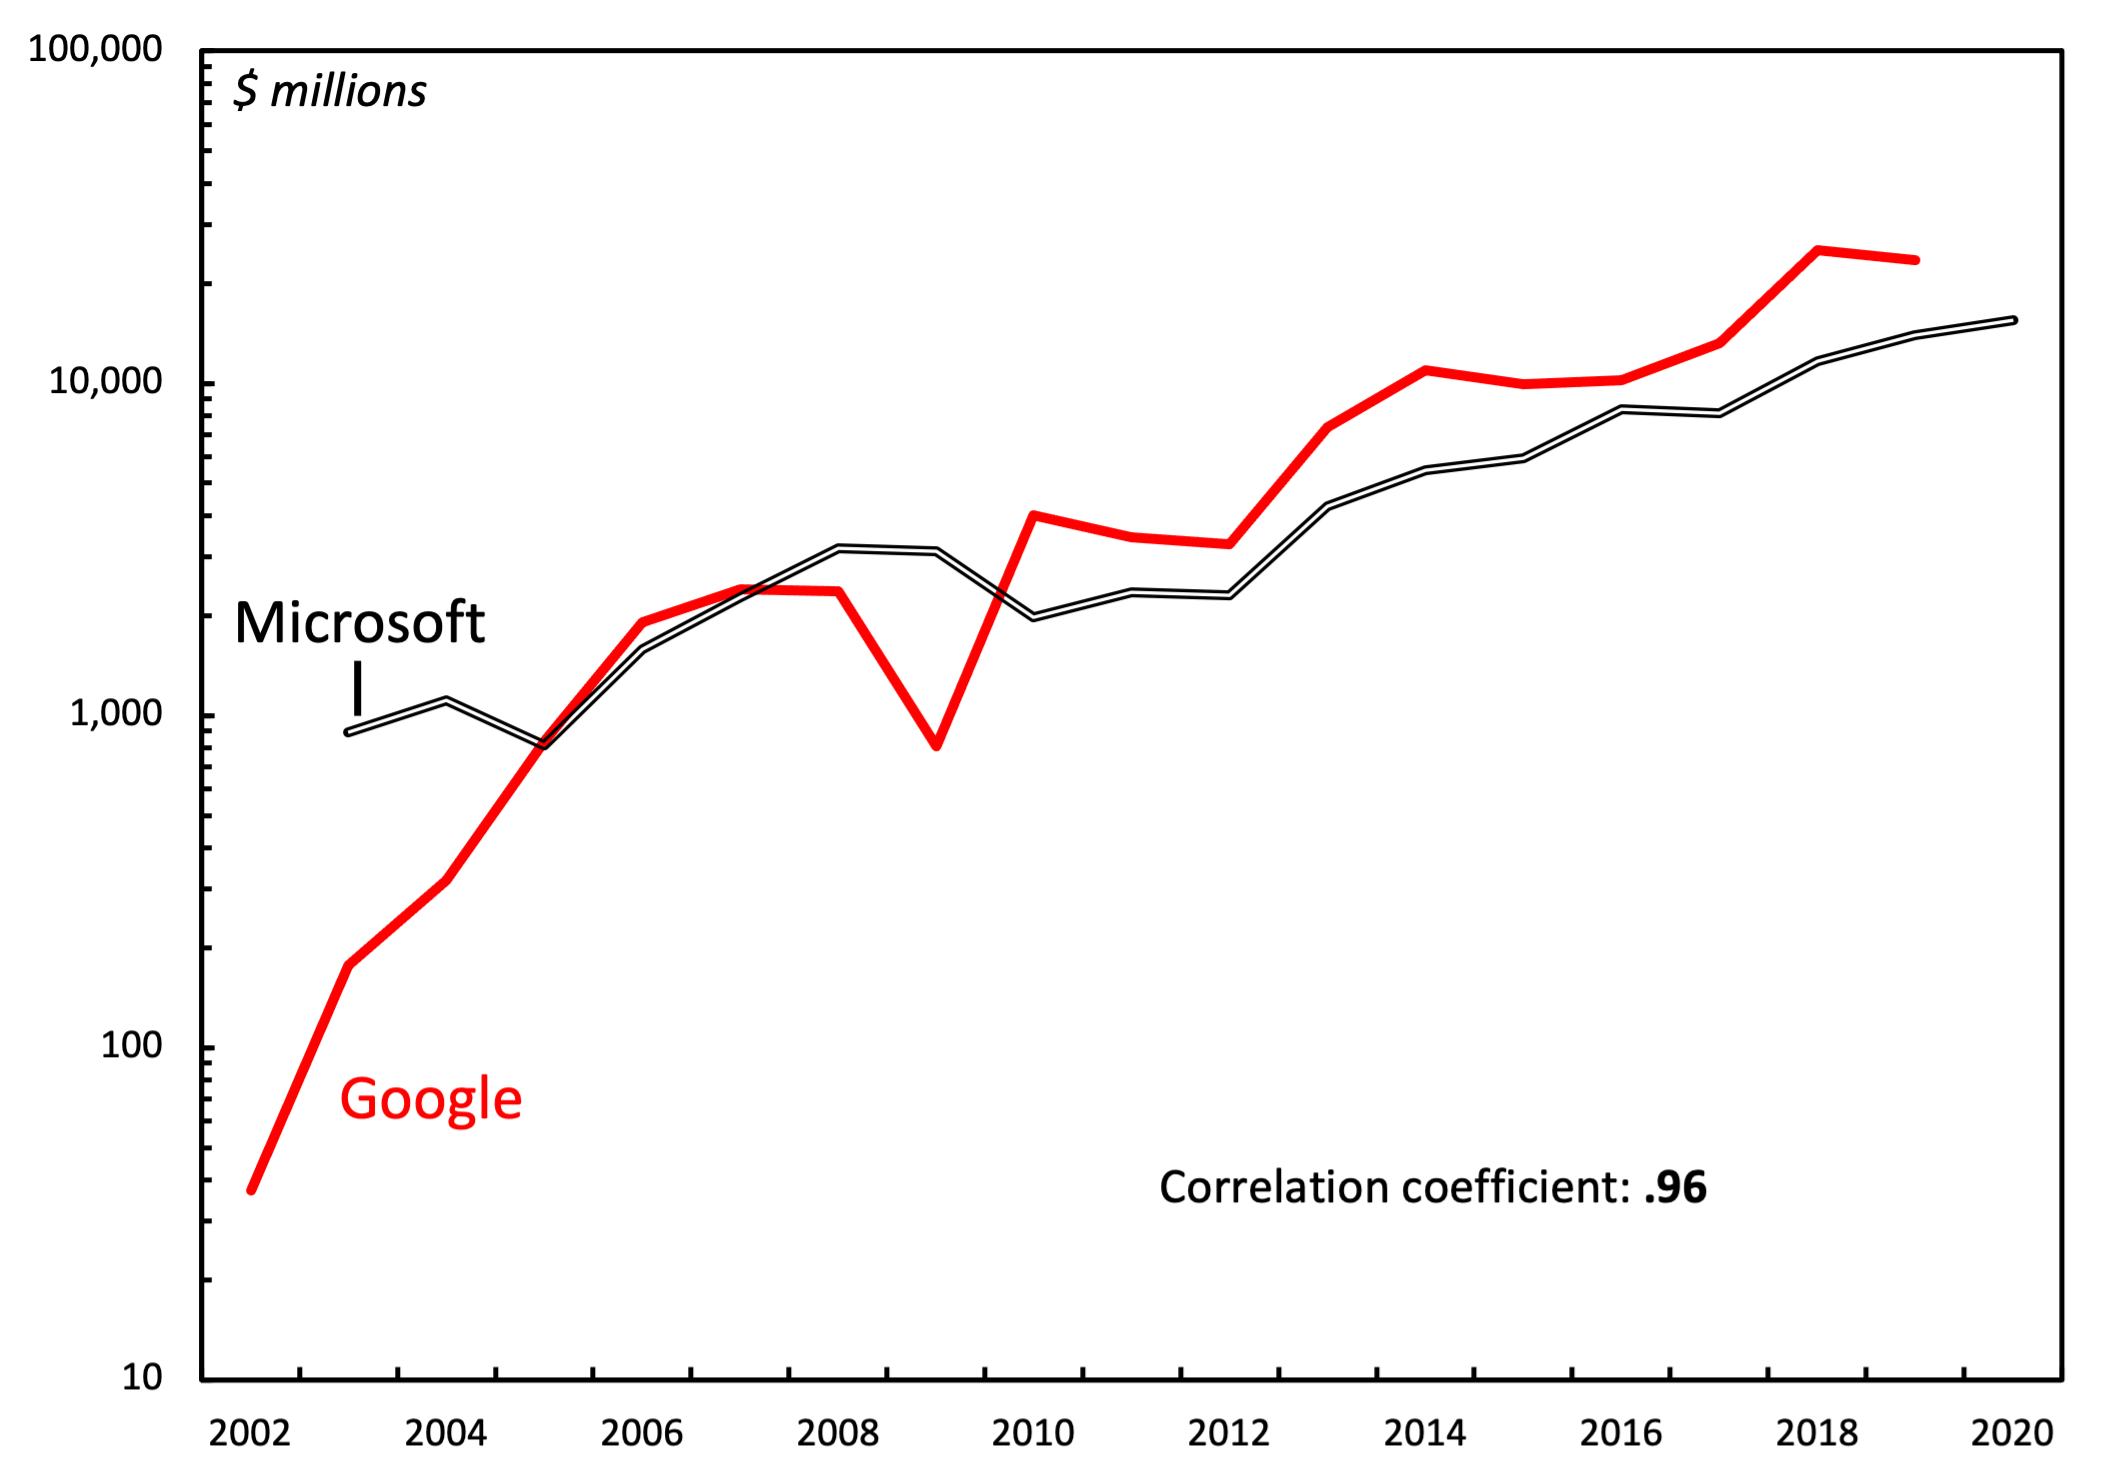
Figure 7: Annual green-field investment — Google vs. Microsoft.
Note: I use annual spending on purchases of property and equipment as a proxy for green-field investment.
Source: Data are from annual cash-flow statements on Mergent Online.
In addition to matching green-field investment, it seems that Google and Microsoft are also locked in a struggle to match each other’s spending on mergers and acquisition. Figure 8 shows each firm’s absolute change in annual spending on business acquisitions — change that is tightly correlated.
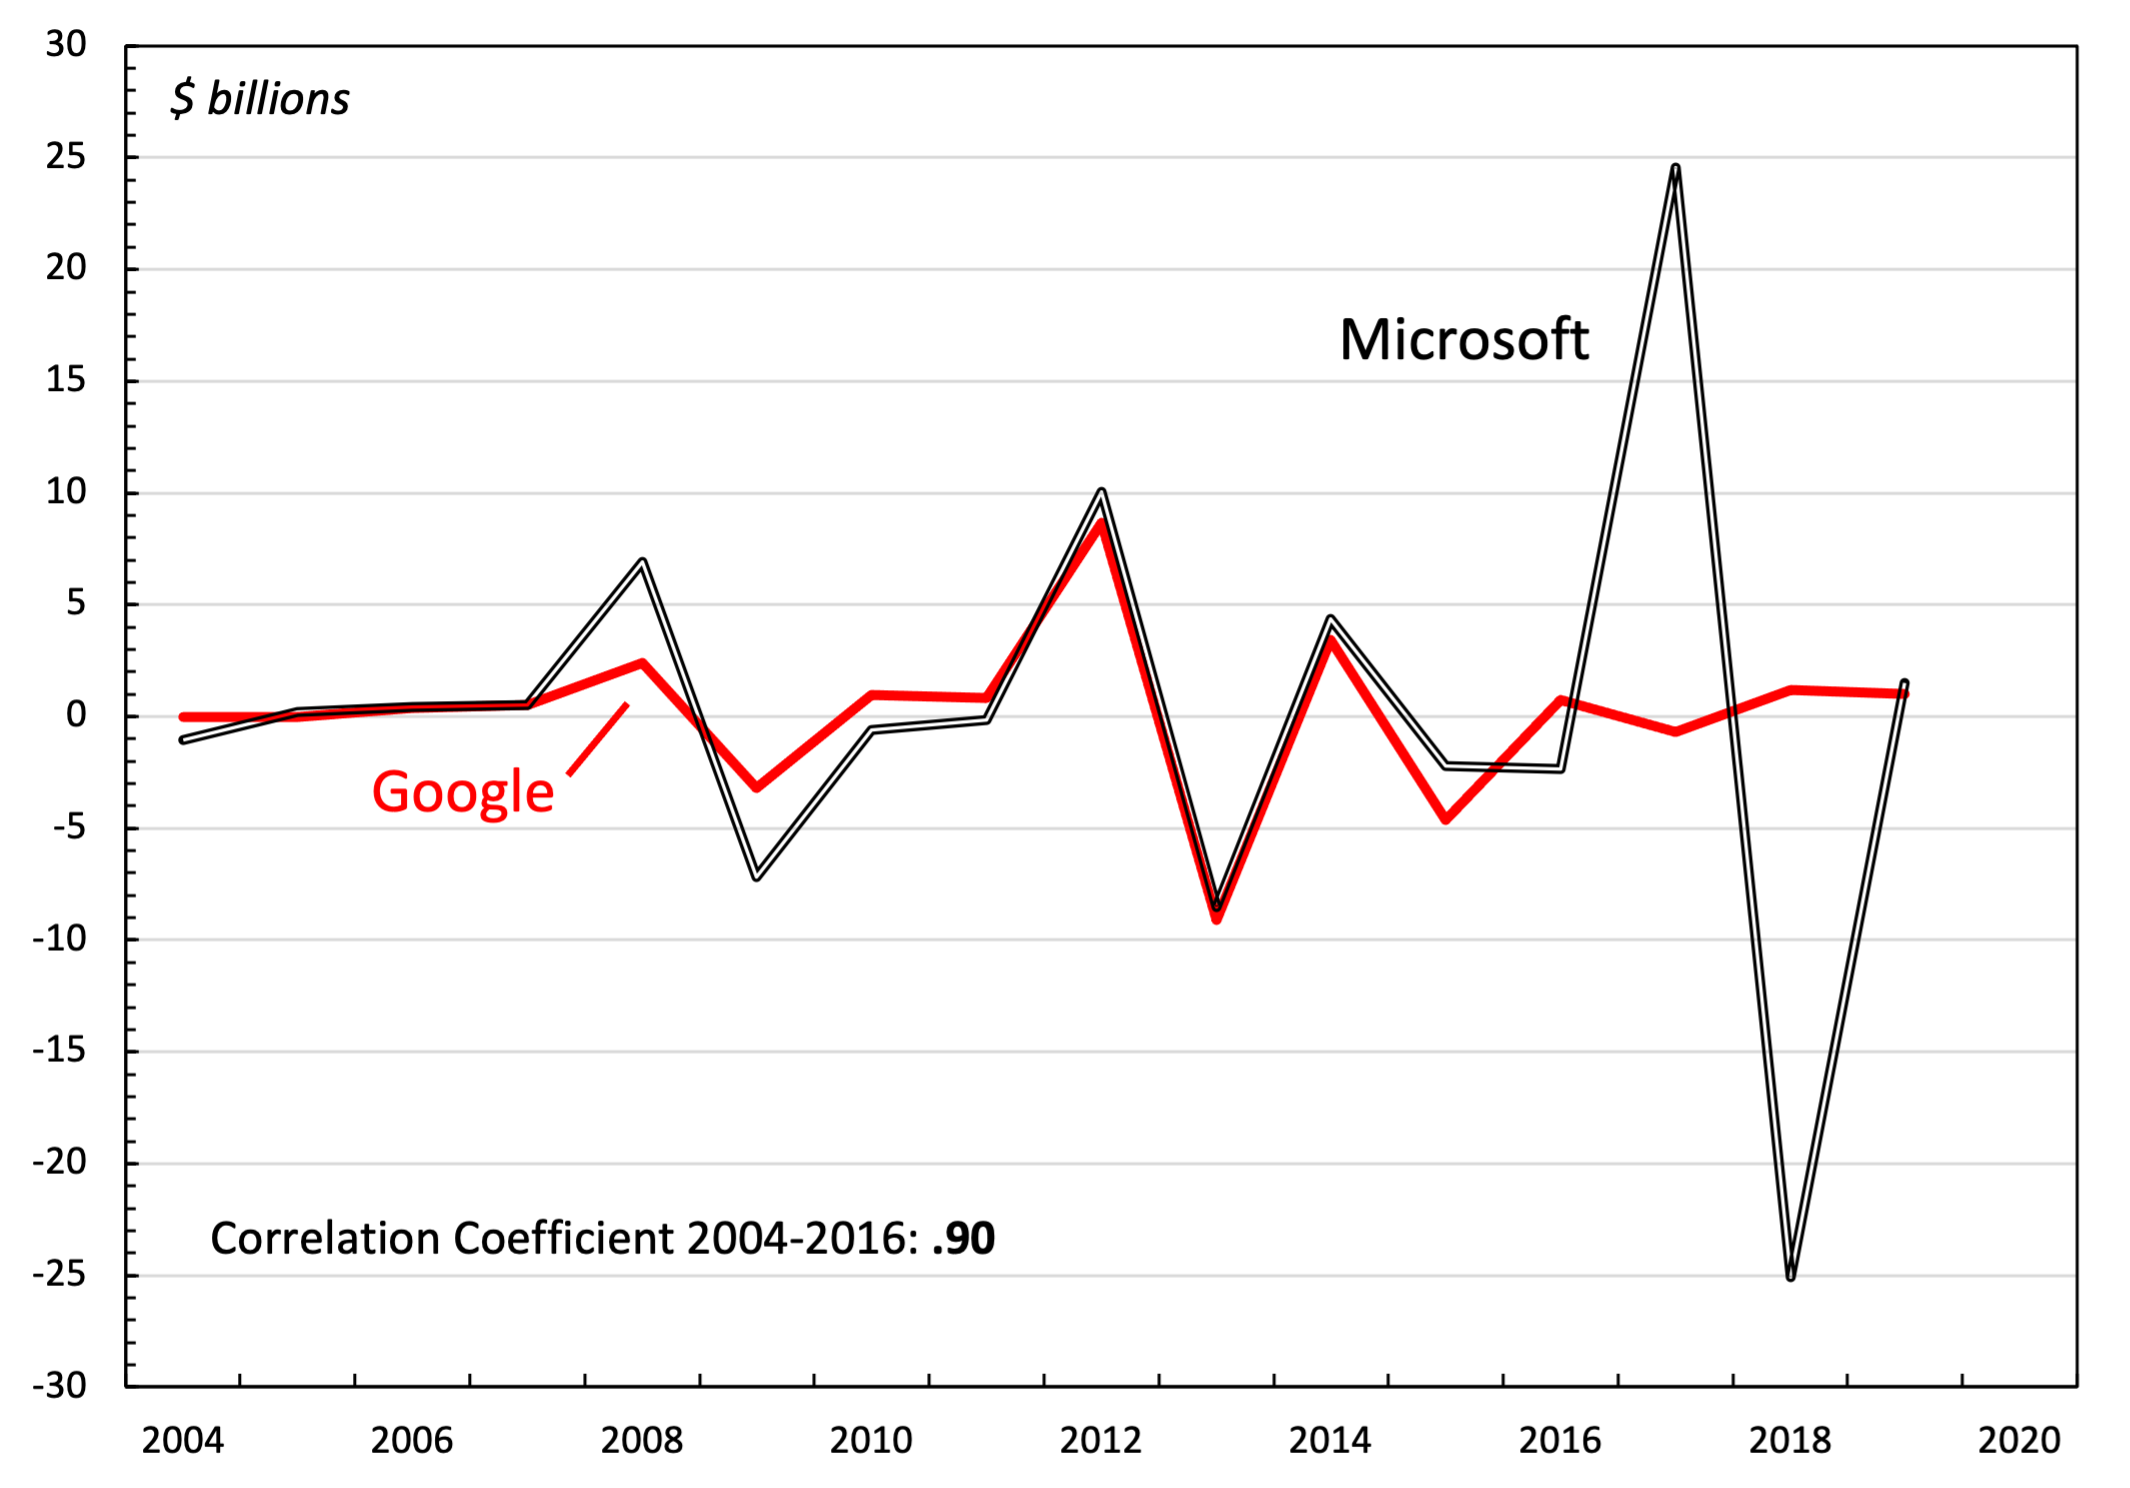
Figure 8: Annual absolute change in acquisitions — Google vs. Microsoft.
Source: Acquisitions data are from annual cash-flow statements on Mergent Online.
From the vantage point of ‘costs of production’, it is difficult to understand why Google and Microsoft would want to match each other’s spending on acquisitions. Such spending, however, makes sense when viewed through the lens of power. Acquisitions, Nitzan and Bichler note, increase a firm’s share of the profit without increasing the overall size of the market. Importantly, acquisitions also remove one’s competitors from the market, bolstering differential profitability. Viewed in this light, Figure 8 indicates that Google and Microsoft are engaged in remarkably synchronous competitor removal.
This matched spending is all the more impressive, given the limited pool of tech firms available for purchase. Yet despite this limitation, from 2004 to 2016, Microsoft and Google coordinated their acquisitions spending with remarkable accuracy (correlation +0.90). In the years that followed, however, Microsoft went on an acquisition spending spree that was unmatched by Google. (Most notably, Microsoft purchased LinkedIn.) I will discuss possible reasons for this acquisition divergence in the conclusion.
5.1 A war for patents
Figure 8 quantifies the events that played out qualitatively during the Novell-Nortel-Motorola patent war. According to Google’s Chief Legal Officer (David Drummond), Microsoft’s purchase of mobile patents was a form of strategic sabotage.3
By buying patents for mobile technology, Microsoft was encroaching on Google’s turf. Importantly, it was an encroachment not on a territory of current profitability, but on an area of perceived future profitability. In other words, Drummond chastised Microsoft for attempting to cut off Google’s path to future differential earnings.
Today, neither Microsoft nor Google derive their core profits directly from mobile computing. Yet their actions show that this is an arena that both firms are struggling to control (or at least struggling to keep the other firm from controlling).
Interestingly, the patent war between Microsoft and Google came to a head in 2011 — around the same time that the two firms’ profits became antagonistic (Figure 4). Thus this patent war may provide a case study in how differential profitability can be zero sum, achieved not with but against other firms. It also provides a fascinating case study of how acquisitions can be used as a form of sabotage (Nitzan and Bichler 2009, 231-233).
When Microsoft purchased the Nortel patents, it sought control over a set of intellectual property rights. But its aim was likely not to use these property rights for ‘production’. Instead, Microsoft probably intended to exercise its power to exclude. By suing Android mobile producers for patent infringement, Microsoft hoped to damage Google’s ecosystem, thereby choking Google’s profits.
In other words, the aim was not to increase Microsoft’s profit in absolute terms, but to increase them differentially by sabotaging Google. Viewed through the lens of profit maximization, this strategy makes little sense. But when viewed through the lens of differential power, it is perfectly logical. Google’s loss is Microsoft’s gain.
6 Conclusion
Mainstream economists typically assume that capitalism is positive sum, meaning competition between firms results in expanded production. Nitzan and Bichler, however, note that capitalist competition is sometimes zero sum. When this happens, firms achieve differential gains by inflicting damage on their opponents.
The patent war between Microsoft and Google may be such a case. Since 2010, the expansion of Google’s profits came at the cost of Microsoft’s profits (and vice versa). So it seems plausible that both firms are locked in a battle of strategic sabotage. Both firms dominate their core areas of profitability, and so are looking to expand to new territory. As they do, they encroach on each other’s turf. In this respect, mobile computing may be just one aspect of the Microsoft-Google turf struggle.
Having analyzed the competition between Microsoft and Google, it is important to acknowledge the limitations of studying these two firms in isolation. There are now other big players in the tech industry — notably Apple, Facebook, and Amazon. In the future, similar methods could be used to study the mutual conflict between these tech giants.
On that front, Microsoft may have recently repeated its acquisition strategy, but this time against a different competitor. In June of 2016, Microsoft purchased the social media company LinkedIn for $26 billion (Microsoft News Center, 2016). The purchase may have been a deliberate response to an encroaching competitor: Facebook. As Figure 9 illustrates, by 2016, Facebook’s differential profit had converged with Microsoft’s. What we may be seeing, then, is a deliberate strategy of ‘containment’. When another firm converges on Microsoft’s level of profit, Microsoft seeks to ‘contain’ its rival by acquiring the rival’s direct competitors.
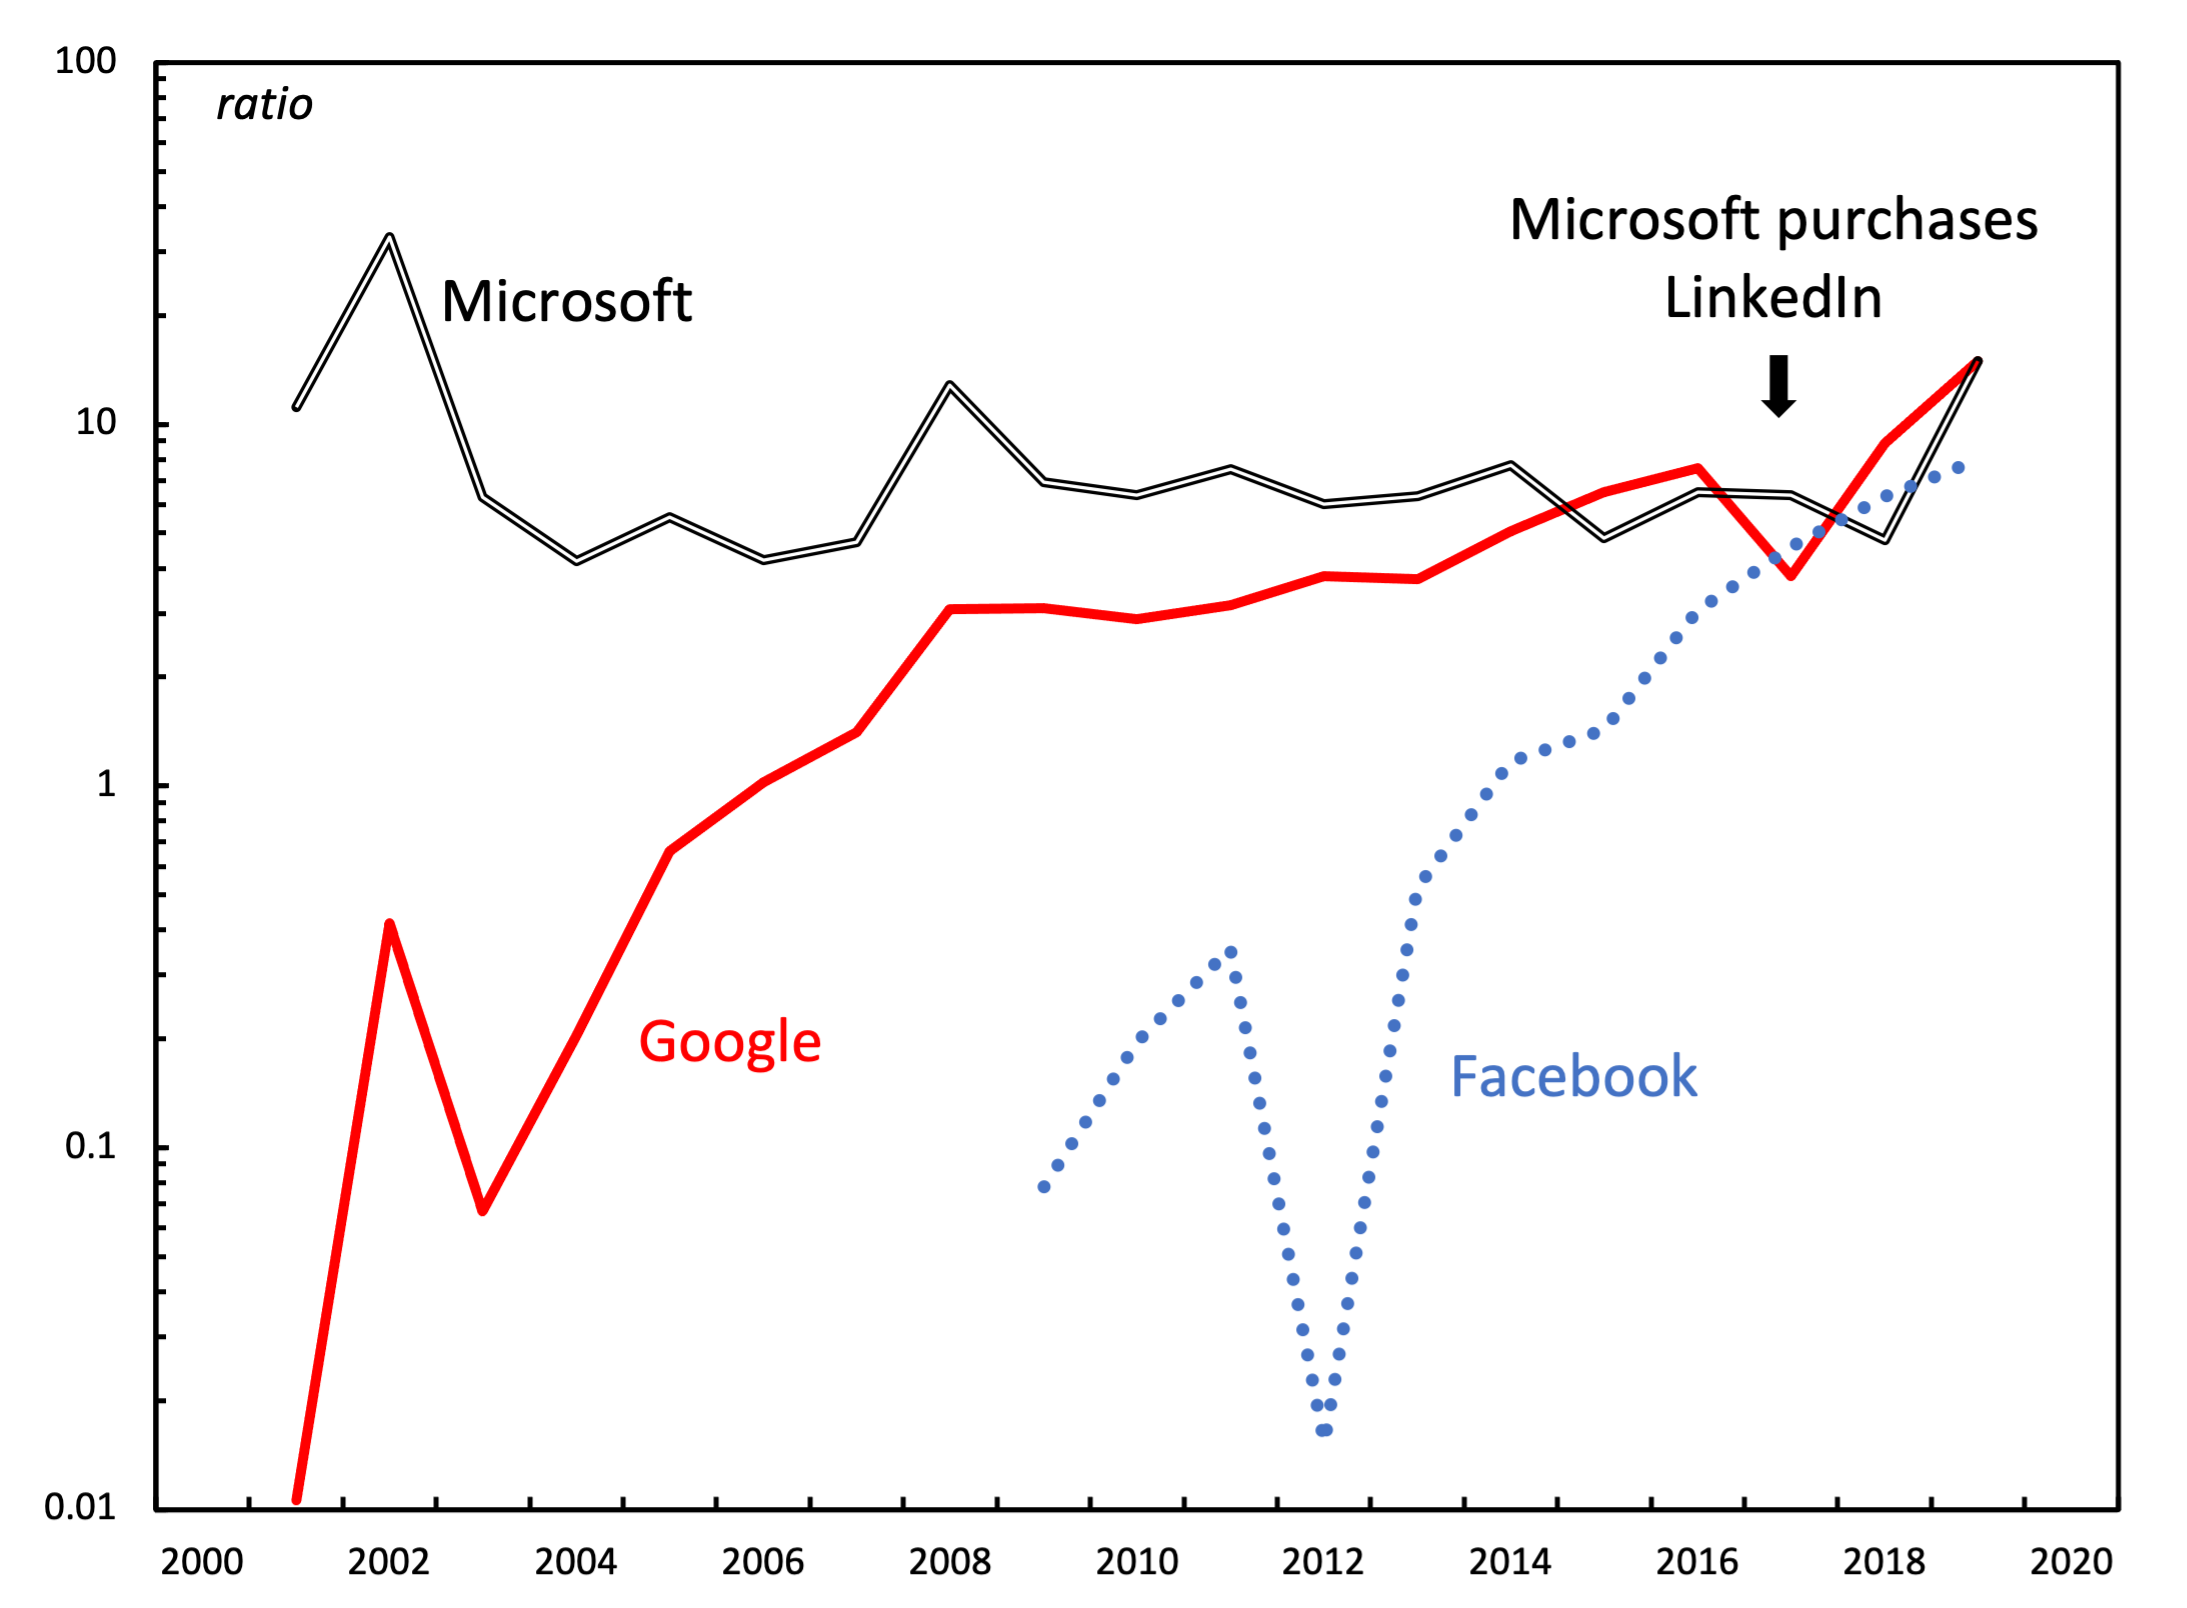
Figure 9: Annual differential profit — Google, Microsoft, and Facebook.
Note: Differential profit is the ratio of each firm’s annual net income to the average net income of the largest 500 global companies (ranked by revenue) in the Compustat database. Note that the y-axis uses a log scale
Source: Google, Microsoft, and Facebook income statements are from Mergent Online. Global average net income data is from Compustat (through WRDS), series codes NI and REVT.
My analysis raises many questions for future research. Why, for instance, have Microsoft, Google, and Facebook plateaued at the same level of differential profits? Is this a result of mutual competition? Is it a wider barrier to size in the tech industry? Or is it simply a coincidence?
Another area for future research is to expand the analysis outside the United States. Internationally, Google competes with Chinese tech companies like Tencent and Baidu. Microsoft and Facebook also face a host of competitors. Because of the complexity of this competition, the analysis in this paper should be considered exploratory.
Still, one way to interpret the results is that despite the complexity of international competition, Google and Microsoft have settled on a simple strategy: match each other’s acquisitions. Although it remains unknown how widespread this behavior is, it is my hope that this study contributes to our understanding of the power trajectory of large corporations.
Notes
Chris Mouré is a graduate student at York University. He can be reached at cjmoure@my.yorku.ca.
-
In 2015 Google reorganized its various businesses into a new conglomerate called ‘Alphabet’. For simplicity, in this paper I use the name “Google” to refer to both Google and Alphabet.↩
-
It is also worth noting that Microsoft’s differential profitability stalled as early as 2000, suggesting that its barrier to differential profit was unrelated to the rise of Google. The plausible explanation is that Microsoft was a victim of its own success, its near total monopoly leaving no room for expansion. Still, the question remains why Microsoft and Google converged on the same ratio of differential profit — about 10 times that of the Global 500 average.↩
-
Admittedly, Drummond did not use the specific word ‘sabotage’. But he expressed a similar sentiment.↩
References
Alphabet. (2009). Annual report 10-K. Securities and Exchange Commission, (Commission file number: 000-50726).
Alphabet. (2019). Annual report 10-K. Securities and Exchange Commission, (Commission file number: 001-37580).
Baines, J. (2014). Wal-mart’s power trajectory: A contribution to the political economy of the firm. Review of Capital as Power, 1(1), 79–109.
Bork, R. (1978). The antitrust paradox: A policy at war with itself. Basic Books.
Bradley, T. (2017). The Windows ecosystem is Microsoft’s “secret sauce”. Forbes.com. https://www.forbes.com/sites/tonybradley/2017/10/17/the-windows-ecosystem-is-microsofts-secret-sauce/?sh = 3c983e1a397a
Cochrane, D. T. (2017). Differentiating diamonds: Transforming knowledge and the accumulation of De Beers. Working Papers on Capital as Power, (2017/01).
Drummond, D. (2011). When patents attack Android. Google: Official Blog. https://googleblog.blogspot.com/2011/08/when-patents-attack-android.html
Economides, N. (2001). The Microsoft antitrust case. Journal of Industry, Competition and Trade, 1(1), 7–39.
Hager, S. B. (2012). Investment bank power and neoliberal regulation: From the Volcker shock to the Volcker rule. In Neoliberalism in crisis (pp. 68–92). Springer.
Jones, E. (2021). Cloud market share – a look at the cloud ecosystem in 2021. Kinsta.com. https://kinsta.com/blog/cloud-market-share/#an-overview-of-the-cloud-computing-market-in-2021
Lewis, M. (1999). The new new thing: A silicon valley story. WW Norton & Company.
Lovejoy, B. (2017). Android now the world’s most popular operating system as it overtakes windows. 9to5google.com. https://9to5google.com/2017/04/03/android-windows-most-popular-operating-system/
Microsoft News Center. (2016). Microsoft to acquire LinkedIn. Microsoft.com. https://news.microsoft.com/2016/06/13/microsoft-to-acquire-linkedin/
Nitzan, J., & Bichler, S. (2002). The global political economy of Israel. Pluto Press.
Nitzan, J., & Bichler, S. (2009). Capital as power: A study of order and creorder. New York: Routledge.
Olivarez-Giles, N. (2012). DOJ approves Nortel patents sale to group led by Apple, Microsoft. Los Angeles Times. https://www.latimes.com/business/technology/la-fi-tn-us-doj-approves-sale-of-nortel-patents-to-apple-microsoft-rim-sony-20120214-story.html
Page, L. (2011). Supercharging Android: Google to acquire Motorola Mobility. Google Official Blog. https://googleblog.blogspot.com/2011/08/supercharging-android-google-to-acquire.html
Page, L. (2014). Lenovo to acquire Motorola Mobility. Google Official Blog. https://blog.google/inside-google/company-announcements/lenovo-to-acquire-motorola-mobility/
Veblen, T. (1908). On the nature of capital. The Quarterly Journal of Economics, 22(4), 517–542.