A Brief History of the Buy-to-Build Indicator
July 21, 2022
Originally published at Economics from the Top Down
Blair Fix
Today I’m trying a different type of post — one that’s not a deep dive, but instead, a rapid-fire summary of an important topic. My inspiration comes from Cory Doctorow, a sci-fi author who runs an old-fashioned links blog that he syndicates across the internet. (At last count, it’s on pluralistic.net, Twitter, Mastodon, and Medium). I read Doctorow’s blog daily, as he writes consistently excellent commentary on political economy.
Below is my first attempt at this type of post. It’s a rapid-fire summary of Nitzan and Bichler’s buy-to-build indicator — a summary that started life as a Twitter thread.
The buy-to-build indicator
Let’s talk about Nitzan and Bichler’s ‘buy-to-build’ indicator. If you’re not familiar, this is an indicator that quantifies the portion of ‘investment’ spent buying other corporations.
Notice the scare quotes around ‘investment’. To many people, ‘investment’ means ‘building new capacity’. Hence, governments are always chasing ‘investment’ dollars. But here’s the thing: ‘investment’ is purely about transferring property rights.
The word ‘invest’, Nitzan and Bichler observe, has feudal origins. In feudal societies, investiture was the “symbolic ceremony of transferring property rights from the lord to the vassal”:
Originally, the meaning of ‘investment’ had nothing to do with money and even less to do with production. Investment was a matter of power, pure and simple. Investio in Latin means ‘to dress’, and in Europe of the Middle Ages it was a signifier of feudal property rights. Lords would typically give their vassals a suit of clothing — or vestes — as part of their keep and as a sign of honour. The symbolic ceremony of transferring property rights from the lord to the vassal was known as investiture. The property in question could have been an estate, an office, a monastery, or simply a stipend (feodum de bursa). The ceremony ‘vested’ the vassal with the fief, conferring on him tenure or seisin — a legal seizure protected against invasion from any quarter.
Okay, so ‘investment’ is everywhere and always a transfer of property rights. Still, there are many kinds of property rights, so ‘investment’ can have many different forms. I can ‘invest’ in land, houses, machines, factories, etc. Now here is the twist: if I own a corporation, I can also get that corporation to invest in other corporations. In corporate speak, the act of buying up other corporations is call ‘mergers and acquisitions’.
Why, though, would I want to buy other corporations? In a word, power. The drive to merge is about acquiring the power to set prices. Cory Doctorow has a nice way of putting it:
When the CEOs of two companies conspire to set prices, it’s illegal. When they merge their companies and engage in the same conspiracy, it’s not. Collective bargaining is out, monopolization is in. That’s why the Big Six publishers are now the Big Four.
This price-setting power is written in the data. Big firms tend to have a higher ‘markup’ (profit as a portion of sales) than smaller firms. Here’s the trend among US firms.

The trend in Figure 1 is not new, by the way. The link between firm size (capitalization) and markup goes back at least to the 1950s.

Back to mergers and acquisitions. An important question to ask is — to what extent are corporations buying other corporations rather than investing in ‘stuff’? And what is the trend? These are the questions behind Nitzan and Bichler’s ‘buy-to-build’ indicator.
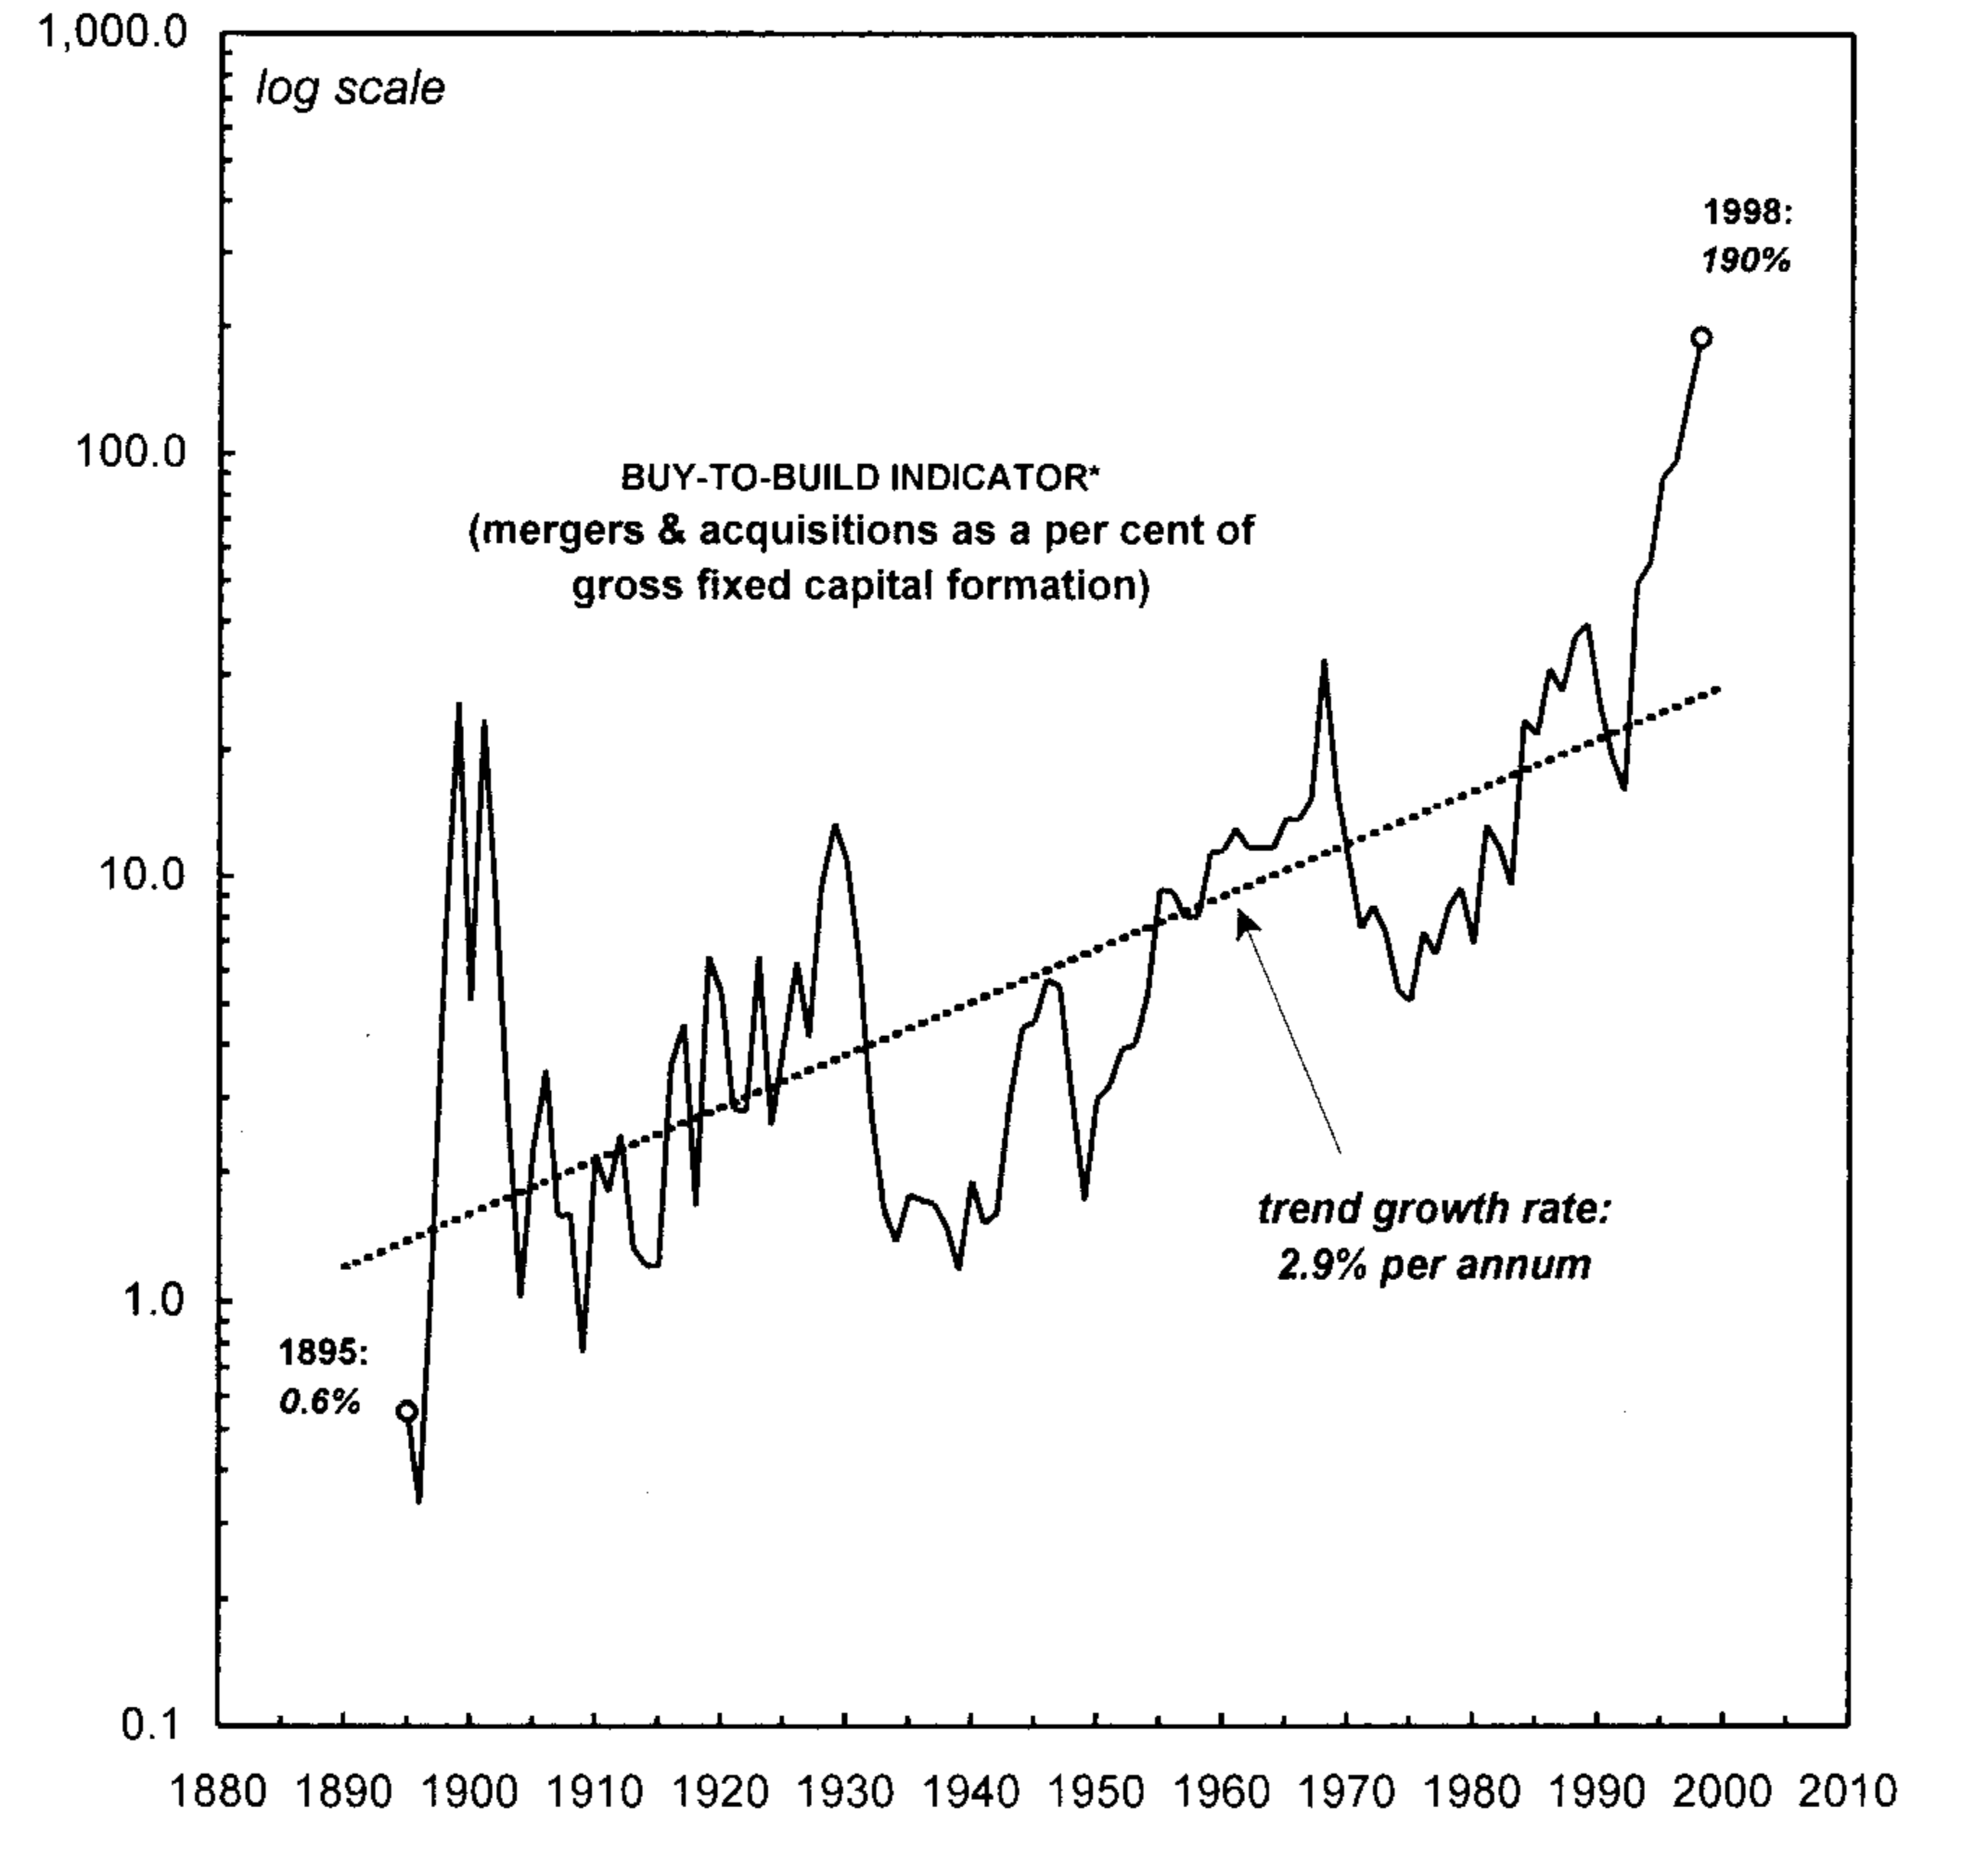
The first published stab at constructing a buy-to-build indicator was in a 2001 paper by Jonathan Nitzan called ‘Regimes of Differential Accumulation’. Figure 3 shows the US results. Notice two things:
- The trend is upward;
- There are big oscillations.

In 2009, Jonathan Nitzan and Shimshon Bichler updated the ‘buy-to-build’ indicator, with much the same results:

In 2013, Joe Francis constructed new estimates for the buy-to-build indicator in the US (Fig. 5) and Britain (Fig. 6). As you can see, the estimates require splicing together many different sets of data.


Much of the underlying data in Figures 5 and 6 is proprietary. Noting this fact, Joe Francis later constructed buy-to-build indicators using open source data. Figure 7 shows US trends. Figure 8 shows British trends. (They look different than the figures above, because Francis has used a linear scale rather than a log scale.)


You can download Francis’ most recent buy-to-build data here, which he has updated to 2020. Like me, Francis is an independent researcher and blogger. He blogs at joefrancis.info. Support him on Patreon here.
Back to the buy-to-build indicator. Francis uncovered a calculation error in Nitzan and Bichler’s original estimates. His new estimate differed slightly from the original. Nitzan and Bichler noted this fact in an accompanying comment.

In their comment, Bichler and Nitzan also noted that the US and Britain have similar buy-to-build trends. The long-term growth rates are almost identical, as are the short-term fluctuations. In other words, capitalism is a global system.

A side note here about the interchange between Francis and Nitzan/Bichler. This type of back and forth is crucial to science. Yet in economics, it’s becoming increasingly rare. Interestingly, it was Joe Francis who quantified the rise and fall of economics debate. Here are his results:

Now lets back up 20 years. In Jonathan Nitzan’s first paper on the buy-to-build indicator, he looked at its short term fluctuation. It turns out that the oscillation of the buy-to-build indicator correlate negatively with a ‘stagflation’ index — a measure of inflation and unemployment.

In other words, when corporations merge more, unemployment and inflation tend to decrease. And when corporations fail to merge, they turn to inflation (raising prices) to make money. Nitzan and Bichler updated the data in 2009, finding much the same thing:

When Joe Francis did new stagflation estimates in 2013, he found the same correlation. The buy-to-build indicator moves inversely with stagflation. Here’s the trend in the US and Britain.

Nitzan and Bichler use these results to classify different regimes of capitalism. Corporations’ goal is always to increase their capitalization relative to other firms. But there are different ways to do it. Here’s Nitzan and Bichler’s classification:
 Source: ‘Regimes of Differential Accumulation’.
Greenfield investment means building new factories. When people think of ‘investment’, that’s their default. But the other major way for firms to get bigger is to buy other firms: mergers and acquisitions. The trend has been towards less greenfield investment and more mergers. This trend, Nitzan and Bichler hypothesize, is a key feature of capitalism.
Alternatively, instead of getting larger, firms can try to boost their profitability per employee. Economists will tell you that firms do this by cost-cutting. The dirty secret, though, is that firms have a secret weapon for increasing profits: inflation. Since inflation also tends to come with economic stagnation, Nitzan and Bichler call this regime stagflation.
That brings us today. Jonathan Nitzan, Shimshon Bichler, and Joe Francis have shown that in the US and Britain:
- Over the long term, the buy-to-build indicator tends to increase;
- Over the short term, oscillations in the buy-to-build indicator correlate negatively with stagflation.
What we need now is for researchers to see if this research replicates in other countries. If you’re an aspiring political economist, this is an excellent empirical project on which to cut your teeth. Whatever you find, the Review of Capital as Power is interested in publishing your results.

Further reading
Francis, J., Bichler, S., & Nitzan, J. (2013). The buy-to-build indicator: New estimates for Britain and the United States and a comment. Review of Capital as Power, 1(1, October), 63–78.
Nitzan, J. (2001). Regimes of differential accumulation: Mergers, stagflation and the logic of globalization. Review of International Political Economy, 8(2), 226–274.
Nitzan, J., & Bichler, S. (2009). Capital as power: A study of order and creorder. New York: Routledge.