Forum Replies Created
-
AuthorReplies
-
Dominant Capital and the Government
Shimshon Bichler and Jonathan Nitzan[1]
Originally published on The Bichler and Nitzan Archives.
***
This note contextualizes the ongoing U.S. policy shift toward greater ‘regulation’ of large corporations. Cory Doctorow (2021) and Blair Fix (2021) are optimistic about this shift. We doubt it.
1. The Limits of Power
Large U.S.-based corporations are extremely powerful, but the growth of their power has decelerated considerably.
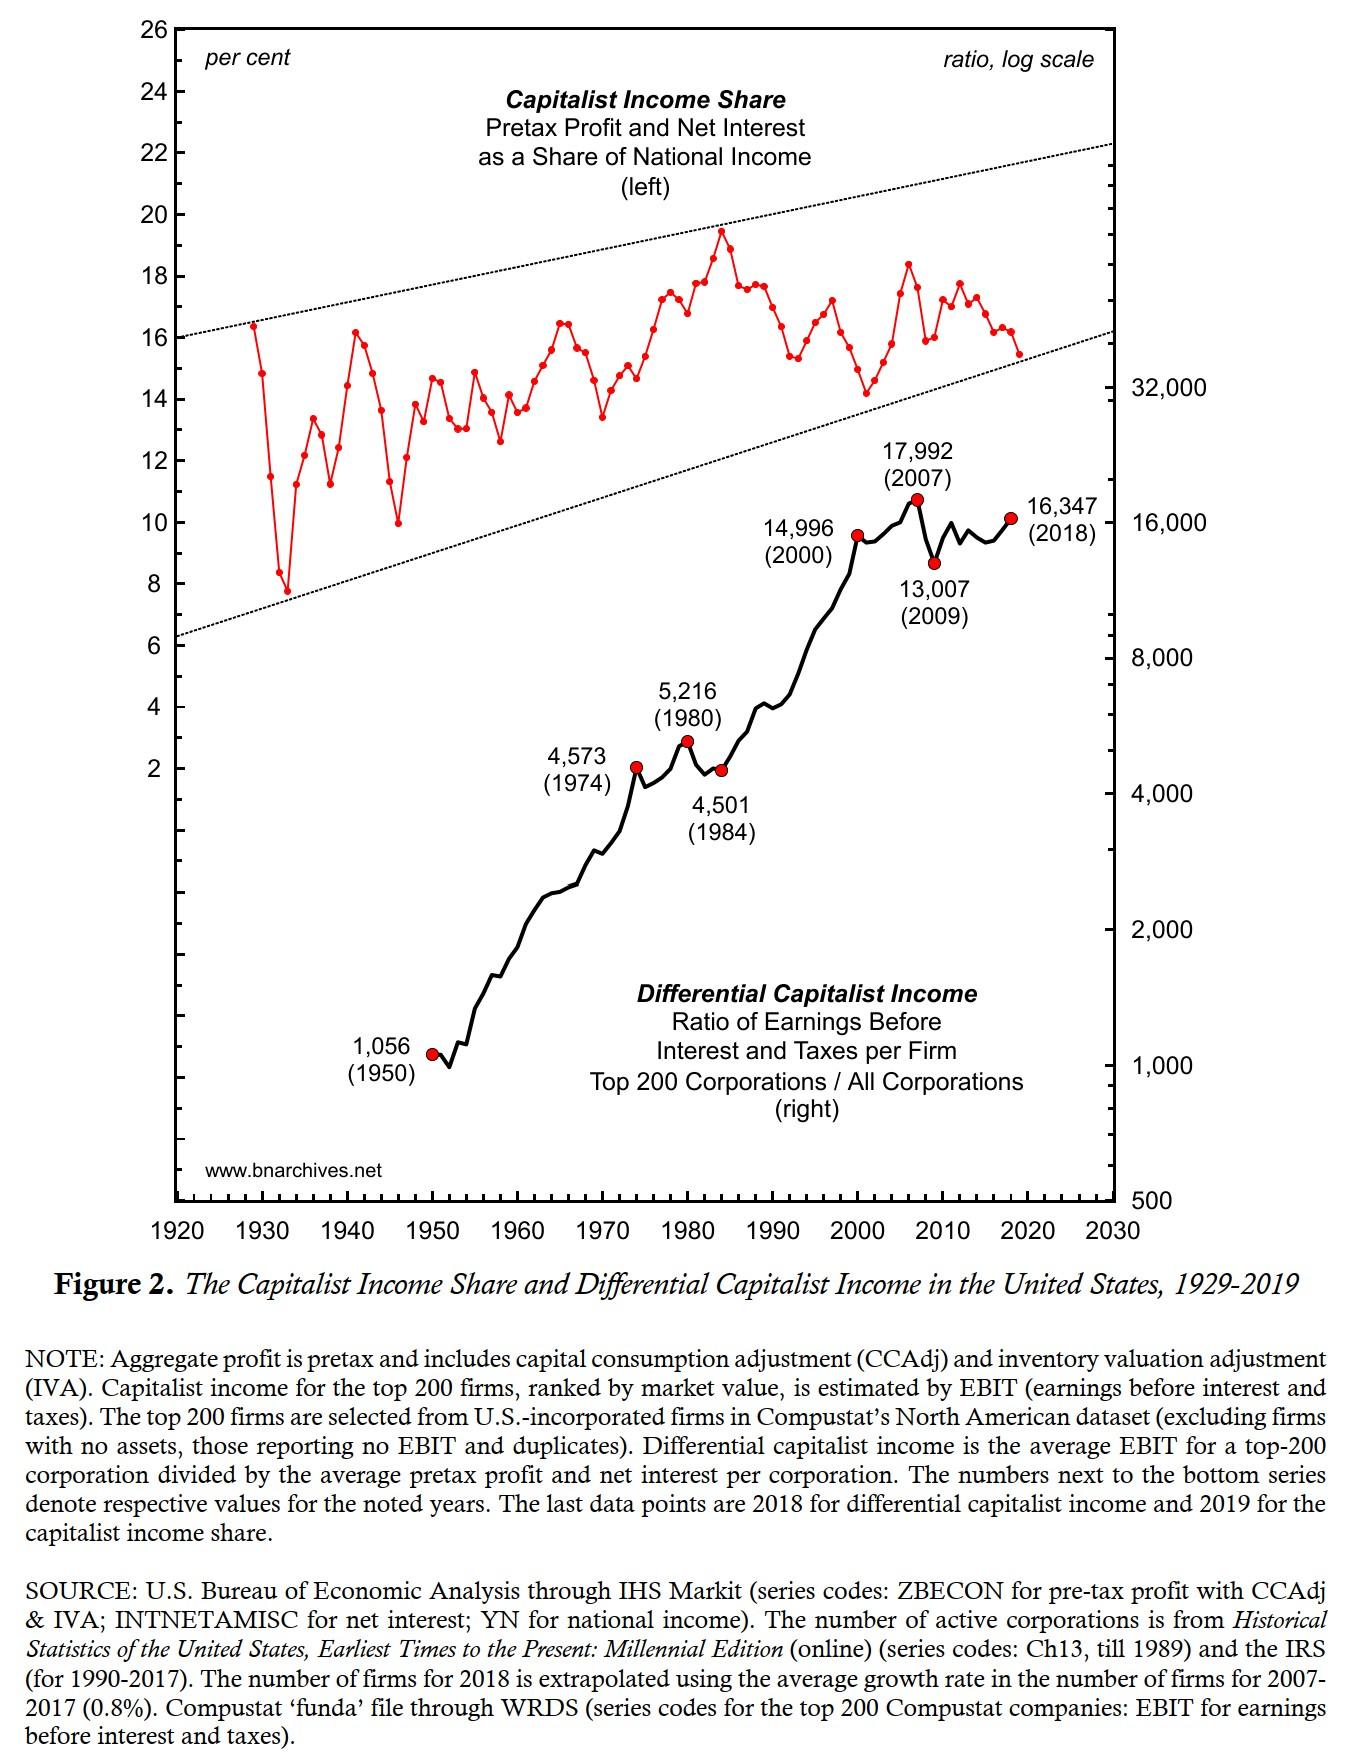
Figure 1, updated from our ‘Corporate Power and the Future of U.S. Capitalism’ (Bichler and Nitzan 2021), shows the earnings before interest and taxes (EBIT) of the top 200 U.S.-based corporations, ranked by market capitalization, relative to those earned by the average U.S. corporation. The top series confirms that this differential – which proxies the relative power of the top 200 firms – has grown exponentially, rising from roughly 1,000 in 1950 to more than 15,000 in the 2000s. The bottom series, though, shows that the rate at which this differential power has grown trends downwards.
This long-term deceleration is not accidental. In fact, it is built into the very nature of social power. In our capital-as-power research – or CasP, for short – we argue that power always elicits resistance from those on whom it is imposed; that this resistance tends to rise along with power; and that the greater the resistance the more difficult it is to augment power even further. In other words, power is self-limiting (Bichler and Nitzan 2012, 2016, 2020).
The twenty-first century revival of anti-corporate sentiments and anti-capitalist movements around the world is part of this resistance – as are some of the policy reforms emerging in their wake. But these reforms shouldn’t be over-hyped.
2. The Capitalist Mode of Power
Our CasP analysis claims that, as capitalism develops, governments and large corporations become increasingly intertwined organs of the same capitalist mode of power. We call this mode of power the ‘state of capital,’ and we label the large government-backed corporate coalitions at its core ‘dominant capital’.
The coalescence of governments into the capitalist mode of power does not mean that ‘policymakers’ can no longer take an independent stance. They can. But the likelihood of them doing so, as well as the scope of their independence, tend to diminish as the capitalist mode of power creorders – or creates the order of – more and more aspects of social and private life. As this corporate-government integration unfolds, government organizations and officials, including ‘reformers’, not only get entangled in the web of capitalized power, but they also find themselves conditioned by its very concepts, symbols, ideologies and rituals. Consequently, most of them cannot even conceive of fundamental change, let alone bring it about.
From this broad perspective, a meaningful shift within capitalism – and certainly a shift away from it – is less and less likely to come from above. If this shift is to materialize – and in our view, the current prospects for it remain dim – it is likely to come not from reformist governments and soulful corporations, but from below or from without. It will be affected either by social movements mobilized by radical rethinking of capitalized power, or by environmental calamity. Finally, and importantly, this change is likely to materialize not peacefully, but conflictually.
3. Why are Neoliberal Governments so Big?
Think of contemporary governments. Since the 1980s, neoliberal ideology has demanded that state ‘intervention’ and ‘regulation’ be scaled back. It has called for capitalist efficiency to substitute for bureaucratic red tape, for market transparency to replace state corruption, and for equal opportunity to displace hierarchical power. It insists that government should stop ‘crowding-out’ private investment and cease interfering with the so-called free market. It argues that for markets to expand, governments must shrink.
And yet, as Figure 2 shows, the victory of neoliberalism hasn’t made government any smaller. Not by a long shot. In high-income countries, the national income share of government consumption spending remains as large as it was before the onset of neoliberalism, while in low- and middle-income countries, it continues to grow bigger and bigger.
And that shouldn’t surprise us. The capitalist mode of power and the dominant-capital coalitions that rule it do not require small governments. In fact, in many respects, they need larger ones.
As a mode of power, capitalism thrives on multiple forms of ‘strategic sabotage’ – that is, on limiting and redirecting the energy of human beings toward the augmentation of capitalizing power. Dominant capital prevents most people from cooperating, democratically and directly, to improve the well-being of their society and environment. Instead, it forces them to fortify and amplify the very capitalized power that dominates them. And this forcing requires a whole slew of threats, limitations, and the open use of force – in other words, it begets strategic sabotage.
The thing is that, left unregulated, strategic sabotage can easily overbuild, causing the mode of power to implode under its own weight. And that’s where government spending comes in as a mitigating force. From this viewpoint, bigger government – particularly its sprawling social programs and transfer payments – mirrors not the failure of neoliberalism, but its very success.
Figure 3 shows the changing importance of federal transfer payments in the United States. The dashed series depicts the level of current expenditures by the federal government, expressed as a share of U.S. national income. Note that these expenditures include purchases of goods and services, as well as transfer payments for which no goods and services are rendered in return. The solid series displays the share of transfer payments in overall current federal expenditures.
The relationship between the two proportions is telling. Initially, the association was negative. During the 1930s and 1940s, when the national income share of current federal expenditures increased, the share of transfers in these expenditures declined – and vice versa when government expenditures fell. This inverse relationship means that transfers were relatively stable, and that most of the ups and downs in federal spending were due to ups and downs in current government consumption.
But soon enough the relationship flipped. From the 1950s onward, the national income share of current federal expenditures trended upward – and, for the most part, this uptrend was driven by a relentless increase in the share of transfers. All in all, during the postwar era, this share rose 13-fold – from less than 5 per cent in the early 1940s, to nearly 65 per cent presently.
With this observation in mind, it is perhaps worth noting that the 2020 Covid19-related surge in current federal spending – a surge that many like/hate to think of as active ‘Keynesianism’ – was accounted for mostly by passive transfers.
The gradual shift from discretionary expenditures on goods and services to reactive transfers is typical of many governments around the world, and it suggests that these governments are far less potent than their size might imply. In fact, one can argue that the bigger ‘transfer states’ of today are far weaker than the smaller ‘consumption states’ of the Keynesian era. Their apparent largess indicates not greater power but subjugation: a built-in deference to dominant capital, whose strategic sabotage must be offset, at least in part, by unemployment insurance benefits, welfare payments and the like.
4. Summary
On paper, the U.S. government is free to legislate its path and determine its policies. In principle, there is little to prevent a resolute U.S. administration from challenging the power of the country’s dominant capital and clip the wings of its largest firms.
But it would be good to remember that the U.S. government – like most other governments – has become part and parcel of an increasingly global state of capital. This integration has undermined the de facto autonomy of governments everywhere. Whether willing or reluctant, many if not most policymakers have become pawns of a global mode of power they cannot control and that forces them to tranquilize the increasingly vulnerable population that dominant capital helps create. Government spending has inflated, but this inflation betrays weakness, not strength.
Larger-yet-weaker neoliberal governments are the alter-ego of bigger-and-meaner dominant capital. It is hard to think of any important sector or aspect of society, in the United States and elsewhere, where dominant capital does not dominate. It is true that, faced with increasing resistance, the rising power of dominant capital in the United States has slowed down significantly over the years and seems to have stalled completely in recent times (Figure 1). But the level of this power is still greater than ever, and it is yet to show any meaningful decline. Finally, and importantly, the stalling advance of U.S. dominant capital makes it extra vigilant against any serious challenge.
Prediction: if the current U.S. government delivers on its promise to curtail the might of the country’s largest corporations, it will face the wrath of the most powerful megamachine the world has ever seen.
Endnotes
[1] Shimshon Bichler and Jonathan Nitzan teach political economy at colleges and universities in Israel and Canada, respectively. All their publications are available for free on The Bichler & Nitzan Archives (http://bnarchives.net). Work on this note was partly supported by SSHRC.
References
Bichler, Shimshon, and Jonathan Nitzan. 2012. The Asymptotes of Power. Real-World Economics Review (60, June): 18-53.
Bichler, Shimshon, and Jonathan Nitzan. 2016. A CasP Model of the Stock Market. Real-World Economics Review (77, December): 119-154.
Bichler, Shimshon, and Jonathan Nitzan. 2020. The Limits of Capitalized Power. A 2020 U.S. Update. Working Papers on Capital as Power (2020/06, December): 1-16.
Bichler, Shimshon, and Jonathan Nitzan. 2021. Corporate Power and the Future of U.S. Capitalism. Real-World Economics Review Blog, January 4.
Doctorow, Cory. 2021. End of the Line for Reaganomics. Capital as Power Blog, September 26.
Fix, Blair. 2021. How Dominant are Big US Corporations? Economics from the Top Down, September 29.
- This reply was modified 4 years, 3 months ago by Jonathan Nitzan.
Jonathan Nitzan criticises Marx for “dialectical determinism” which “perhaps explains why many of his predictions failed to materialize.”
1.
Very interesting posts, Rowan, but I think their focus is different than mine in the lead post. Notice that I wrote that
Marx’s dialectical determinism was simply too demanding for his narrow ‘economic’ argument
In other words, in my view the problem with Marx’s method is not his quest for dialectical determinism, but his basing of dialectical determinism on narrow economic arguments.
2.
The motivation for this post was the question of alienation, which Marx anchored in the commodification of labour. CasP research suggests that alienation — the estrangement of human beings from their own actions and creations — is an aspect of power writ large, and that the commodification of labour is only one aspect of this power. If this claim is valid, it makes Marx’s economic focus too narrow and therefore potentially misleading in its derivations.
3.
And, yes, many of Marx’s expectations — the falling tendency of the rate of profit, immiseration, deeper and deeper crises, the cascading collapse of capitalism, among others — are yet to come true. Hanging these delays on ‘countervailing forces’ is reminiscent of neoclassical ‘distortions’. A theory that claims to grapple with the fate of humanity should include any meaningful countervailing force in its core. If you think of finance, politics, culture, international relations, etc. as mere derivatives of — or worse still, external auxiliaries/shocks to — the labour process, don’t be surprised that your economically-based predictions end up being off.
I hope these comments help clarify my point.
- This reply was modified 4 years, 3 months ago by Jonathan Nitzan.
- This reply was modified 4 years, 3 months ago by Jonathan Nitzan.
Thank you Rowan for raising this subject, a topic that CasP researchers haven’t examined, certainly not systematically, as far as I know.
I’m curious how one can devise an ex-ante stress test for capitalism in general and Covid-19 capitalism in particular. So far, ex-post differential accumulation seems to continue along with the underlying processes of strategic sabotage.
Looking forward to reading your argument.
From 1960 until 2000, 10-year US treasury yields appear to have correlated with the average inflation rate of the previous ten years. How does this relate to the Power Index and/or systemic fear, if at all? Or is this just what creordering looks like?
- Power Index = (future profit * hype)/(normal rate of return * risk)/wage rate
- Systemic Fear Index =12-month correlation (current price, current EPS).
With respect to the Power Index, current inflation can affect three current variables: hype (up or down), the normal rate of return (mostly up) and the wage rate (almost always up). It should have no impact on future profit and risk, which are forward-looking variables. All in all, the overall direction of its effect on the Power Index is difficult to theorize.
With respect to the Fear Index, current inflation can affect price and EPS, which are both current, though the impacts are unclear. The overall effect on the price-EPS correlation is therefore hard to guess.
Schiller’s correlation between treasury yields and inflation 10 years earlier adds another layer to these already opaque relationships.
Maybe this is one of Mr. Schiller’s irrationalities?
- This reply was modified 4 years, 3 months ago by Jonathan Nitzan.
Capitalists no longer fear the ruled because the ruled think they’re capitalists, too, and they’ve been conditioned to blame their government for their failures, not capitalists
Yes, fraud is a very potent weapon, particularly in capitalism. But we should be careful of appearances. The overt power of the rulers always hides covert fear of losing this power, and collapse, from Belshazzar in Babylon to the communist parties in Euroasia, often occurs when the rulers are caught in their hubris.
This chart, taken from ‘The Limits of Capitalized Power. A 2020 U.S. Update‘, shows that the power of U.S. capitalists in general and dominant capital in particular, having increased dramatically in the last century, is now running against an asymptote.
I’m not sure this asymptote is entirely lost on those in power.
4. I think the WSJ critique here is misguided.
The writer contrasts two examples – one relative, the other absolute: (1) an equal 10% increase/decrease in the stock prices of a very big and a very small company; and (2) an equal $10bn increase/decrease in the earnings of these same companies.
In my view, this is a comparison of apples and oranges. Because the very large company has a greater number and/or a more expensive stock price than the very small company, a 10% increase in the price of this very large company has a much lager absolute effect than a 10% increase in the price of a very small company. Market-cap basing helps reflect these absolute differences.
This market-cap basing isn’t necessary with EPS, since this measure is already computed in absolute terms (dividing the $ sum of all earnings by the number of all outstanding shares). This is why a $10bn gain/loss of the two companies should be treated equally.
Had the WSJ writer complained that S&P weighted equal % changes in prices but didn’t weight equal % change in earnings, then the criticism would have been valid. But as stated, I think it is invalid.
5. I look forward to an empirical analysis of both stocks and bonds that explains the changing correlation of stock price and recent earnings, and why changes in the correlation correlate so tightly with the stock price/wage ratio.
A brief follow-up to some of your specific points, Scot:
1. Compounding interest is backward-looking (it adds the interest that wasn’t paid to the balance), so in that sense, it is ‘opposite’ to forward-looking capitalization. I look forward to insight from considering them jointly.
4. Stock index data are often adjusted and spliced. I doubt that in the case of the S&P series adjustment/splicing alters the overall trajectory. As far as I know, EPS and price indices are based on the same stock weightings.
5. I look forward to bond-stock analysis that explains the changing correlation of stock price and recent earnings.
6-8. I don’t understand your ‘one question’. Our power index is the stock price/wage ratio. Our systemic-fear index is a correlation between stock price and recent earnings. I cannot see any technical reason for these totally different indices to correlate.
- This reply was modified 4 years, 4 months ago by Jonathan Nitzan.
- This reply was modified 4 years, 4 months ago by Jonathan Nitzan.
Thank you Scott. Here are some thoughts.
1. The CasP emphasis on forward-looking capitalization has nothing to do with investors/capitalists being ‘rational’ or ‘irrational’. In our view, forward-looking capitalization is a ritual. (Until the early 20th century, it was heatedly debated by investors and theorists, many of whom thought it was fraudulent and that asset prices should reflect backward-looking ‘real’ means of production.)
2. Forward-looking capitalization does not mean that capitalists ignore the past. It simply means that they use whatever information they have — including the past and including recent earnings — to predict future earnings all the way to infinity.
3. I think we agree that the short-term gyrations of last year’s earnings cannot tell us much about their long-term trajectory. So, if investors indeed discount expected long-term future earnings, stock prices should not be correlated with the ups and down of recent earnings.
4. The data in the following chart show that, during the 1880-1980 period, as the forward-looking ritual gained traction, the correlation between price and recent earnings trended down, In the 1950s, and then in the early 1980s, it turned negative.
5. This long-term decline inverted in the early 1990s. Since then, the correlation between stock prices and recent earnings rose more or less uninterruptedly, reaching all time highs recently.
6. This inversion, we argue, represents a breakdown of the forward-looking capitalization ritual, and this breakdown is not accidental. In our opinion, it represents systemic fear – investors’ fear that the capitalization system itself might be unsustainable.
7. As the following chart shows, the entire history of the systemic fear index is associated, dialectically, with the capitalized power of capitalists, measured here by the stock price/average wage ratio: the higher this power, the greater the fear of capitalists that it cannot be sustained, and therefore their greater systemic fear.
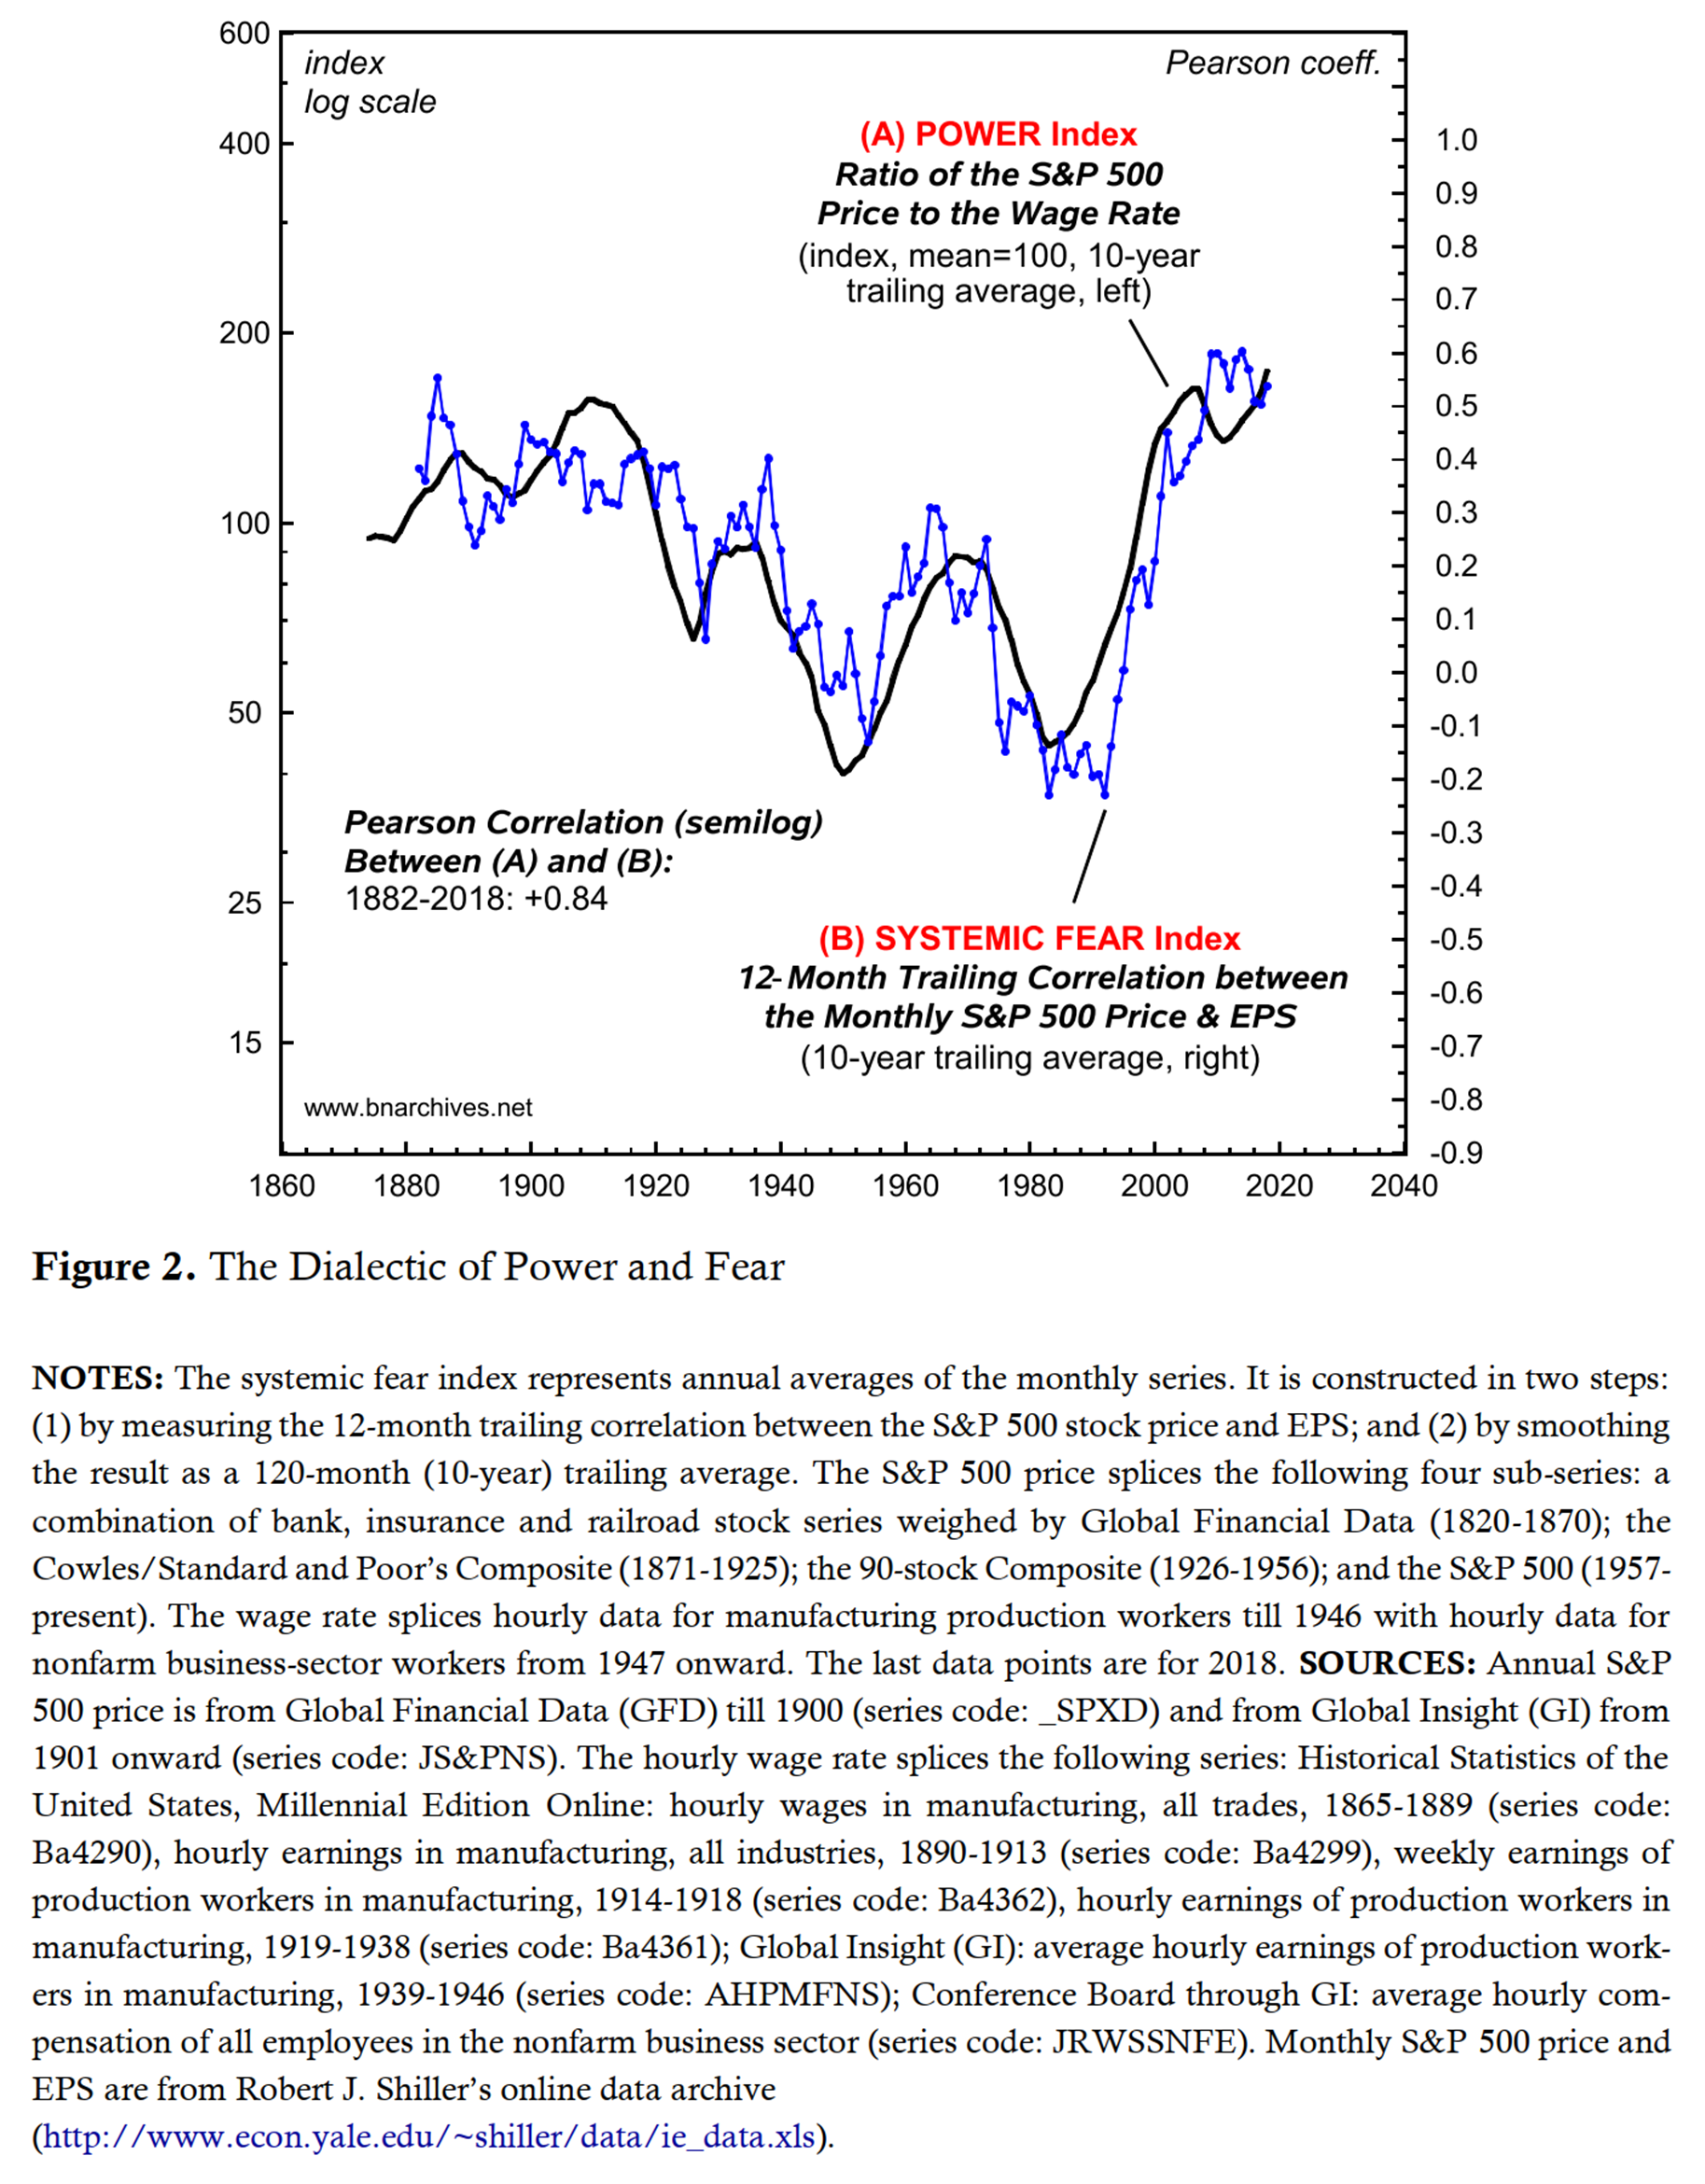
8. The correlation in this chart suggests that the future profit expectations of forward-looking capitalists are calibrated by their power: the lesser/greater their power, the smaller/larger the significance of recent profit for their future-earning predictions.
9. This discussion deals with capitalists as a group and in that sense is unrelated to differential accumulation. Hands-on capitalists accumulate differentially by creordering the power underpinnings of their own assets in ways that affect expected differential profit, hype and risk perceptions, while absentee owners do the same by correctly predicting this creordering. The ongoing changes in overall power of capitalists calibrates the way in which their differential efforts translate into future earnings expectations: the greater/lesser this power, the greater/lesser the impact of their current actions-turned-profit on future earnings expectations.
10. And all of these differential processes — although happening here and now, and even though they are affected by the present to various degrees — are focused on the future.
August 29, 2021 at 10:51 am in reply to: Questions on the schism betwen monetary consumption and material consumption #245970There is no question that, measured in absolute energy term, consumption and income are positively correlated. But in focusing on this correlation and the lavish lifestyle of the rich we might be missing a bigger point.
In our 2020 paper ‘Growing Through Sabotage’, we suggest that the more important question is what part of the energy captured by society goes to wellbeing and what part goes to sustaining and augmenting hierarchical power:

In the paper, we argue that, in the capitalist mode of power, ‘business as usual’ means that the hierarchical share tends rise, and that this relative increase becomes the main driver of energy capture.
If this view is correct, it means that as long as the current capitalist mode of power prevails and expands, the need for more and more hierarchical energy will continue to drive absolute energy capture higher and higher.
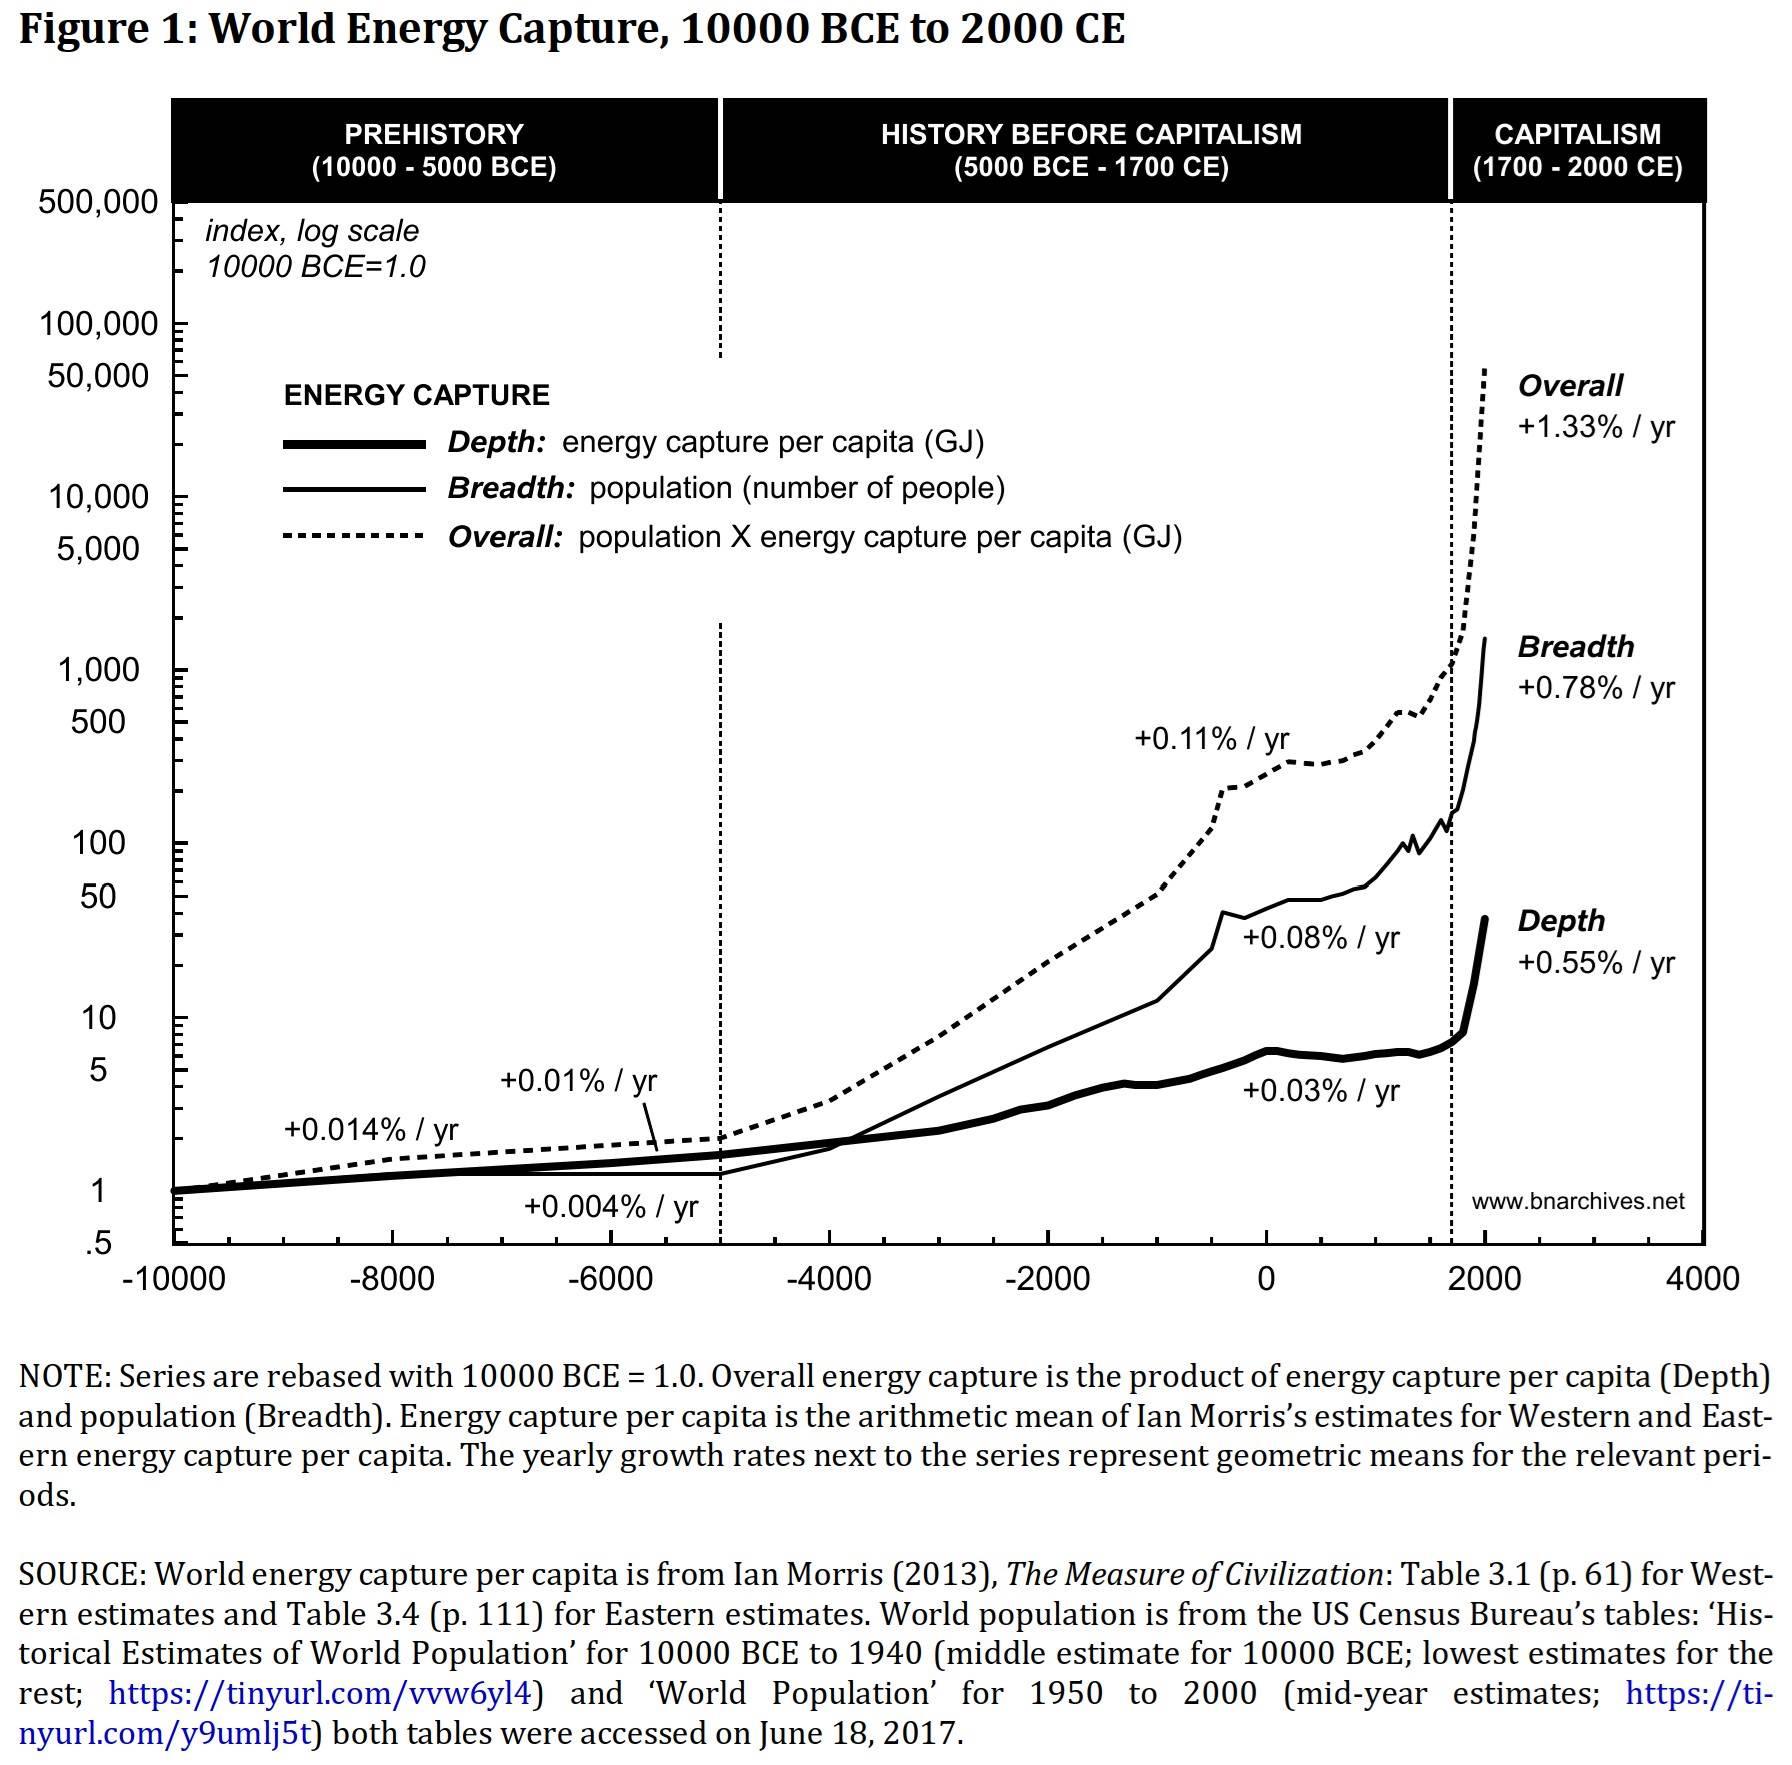
From this power viewpoint, the distribution of consumption between rich and poor is more a consequence than a cause.
- This reply was modified 4 years, 4 months ago by Jonathan Nitzan.
- This reply was modified 4 years, 4 months ago by Jonathan Nitzan.
Brian, I think you are correct that ‘sabotage’ could and should be interpreted more generally than the economic restricting of productive capacity. Most broadly, we can conceive sabotage as the restriction of the autonomous, creative capacities of humanity to develop and augment the personal and common good, or something along those lines.
In our 2020 paper Growing Through Sabotage (p. 2, footnote 3), we write.
Note that our notion of strategic sabotage here is broader and somewhat different than Veblen’s (Bichler and Nitzan 2019). Writing at the turn of the twentieth century, Veblen’s main focus was the pecuniary institutions of ‘business’ and the ways in which these institutions undermined the universal efficiency of ‘industry’ for redistributional ends. In this sense, his conception of sabotage was largely confined to the ‘economic’ sphere of production and consumption, investment and waste, credit and finance. The CasP approach, although partly influenced by Veblen, transcends the politics-economics duality from the very beginning and is therefore able to conceive of sabotage not as an economic tool, but as a lever of power more generally.
This broader viewpoint reveals significant historical changes in the nature and application of strategic sabotage. In the ancient states (as well as in prehistoric societies), power was usually exerted openly, directly and violently, and often in ways that seemed arbitrary and random. In later, more complex polities, though – and particularly in modern capitalism – this exertion became much more opaque and roundabout, far less violent and significantly more systematic. In this latter constellation, sabotage is less open and more stealthy: instead of acting positively to affirm and assert the will of the powerful, it operates mostly negatively, by preventing, restricting and undermining the actions of those polities’ subjects. It also grows less violent: instead of using brute force, it often resorts to temptation, manipulation, mental pressure and inbuilt guilt. Finally and crucially, it becomes more methodical: instead of yielding to whim and caprice, it progresses deliberately and calculatedly.
In our 2009 Capital as Power, we discussed sabotage in relation not only to the pace of industry but also — and perhaps more importantly — its very direction (p. 235)
[Examples of] broad industrial diversions include the development by pharmaceutical companies of expensive remedies for invented ‘medical conditions’ instead of drugs to cure real disease for which the afflicted are too poor to pay; the development by high-tech companies of weapon technologies instead of alternative clean energies; the development by chemical and bio-technology corporations of one-size-fits-all genetically modified vegetation and animals instead of bio-diversified ones; the forced expansion by governments and realtors of socially fractured suburban sprawl instead of participatory and sustainable urbanization; the development by television networks of lowest-denominator programming that washes the brain instead of promoting its critical faculties; and so on.
Of course, as we repeatedly noted the line separating the socially desirable and productive from the undesirable and counterproductive is inter-subjective and contestable. But taken together, these examples nonetheless suggest that a significant proportion of business-driven ‘growth’ is wasteful if not destructive, and that the sabotage underlying these socially negative trajectories is exactly what makes them so profitable.
- This reply was modified 4 years, 4 months ago by Jonathan Nitzan.
A few worthwhile novels about Japan, its culture and power structure, by non-Japanese authors:
1. First on the list is James Clavell’s 1975 Shogun. The story takes place in the early 17th century, but you’ll learn from it more than from any other novel. Also, you won’t be able to put it down.

2. The sensational success of ‘Shogun’ lured tens of thousands of university undergraduates to Japanese studies programs. Academic experts on the subject, envious of Clavell’s success, dissected his work but failed to find meaningful inaccuracies.

3. Peter Tasker, a top financial analyst based in Japan, fast-forwards Clavell to the 21st century. His detective novels, like Samurai Boogie and Buddha Kiss, expose the underbelly of modern-day Japan.

4. Jake Adelstein’s 2009 novel Tokyo Vice is the true story of an American crime reporter who got entangled with the Yakuza. Hold on to your seat.

5. Michael Crichton’s novels are almost always sharp and riveting. His 1992 Rising Sun, written when Japan was still seen as a ‘threat’ to American supremacy, is no exception.

- This reply was modified 4 years, 5 months ago by Jonathan Nitzan.
Some breakdown of U.S. drug cost, based on:
Sood, Jeeraj, Tiffany Shih, Karen Van Nuys, and Dana Goldman. 2017. The Flow of Money Through the Pharmaceutical Distribution System. Los Angeles, CA: USCSchaeffer Leonard D. Schaeffer Center for Health Policy Economics.
According to Sood et. al., a $100 drug in the U.S. costs only $17 to produce. The rest goes to the pharmaceutical firms and various intermediaries. A full $23 of the $100 is earned as profit — $15 by the pharmaceutical firms and $8 by the intermediaries.
This figure, also from Sood et. al., shows the 2015 net profit margins — i.e., net profit as a % of sales — in various U.S. sectors. Brand pharmaceuticals lead the pack, with generic firms following not far behind.
According to Kinch et. al., ownership of new molecular entities (NMEs) has grown highly concentrated – in 2013, the top 10 pharmaceutical firms owned more than 2/3rds of all NMEs, while the top 5 pharmaceutical firms owns over 40%.
Kinch, Michael S., Austin Haynesworth, Sarah L. Kinch, and Denton Hoyer. 2014. An Overview of FDA-Approved New Molecular Entities: 1827-2013. Drug Discovery Today 19 (8, August): 1033-1039.
Much of this concentration is due to mergers & acquisitions. Panel 1 shows the rise of company-gobbler Pfizer versus internal developer Eli Lilly. Panels 2 and 3 show NMEs owned by firms that develop none!
Ever wondered what profit is good for?
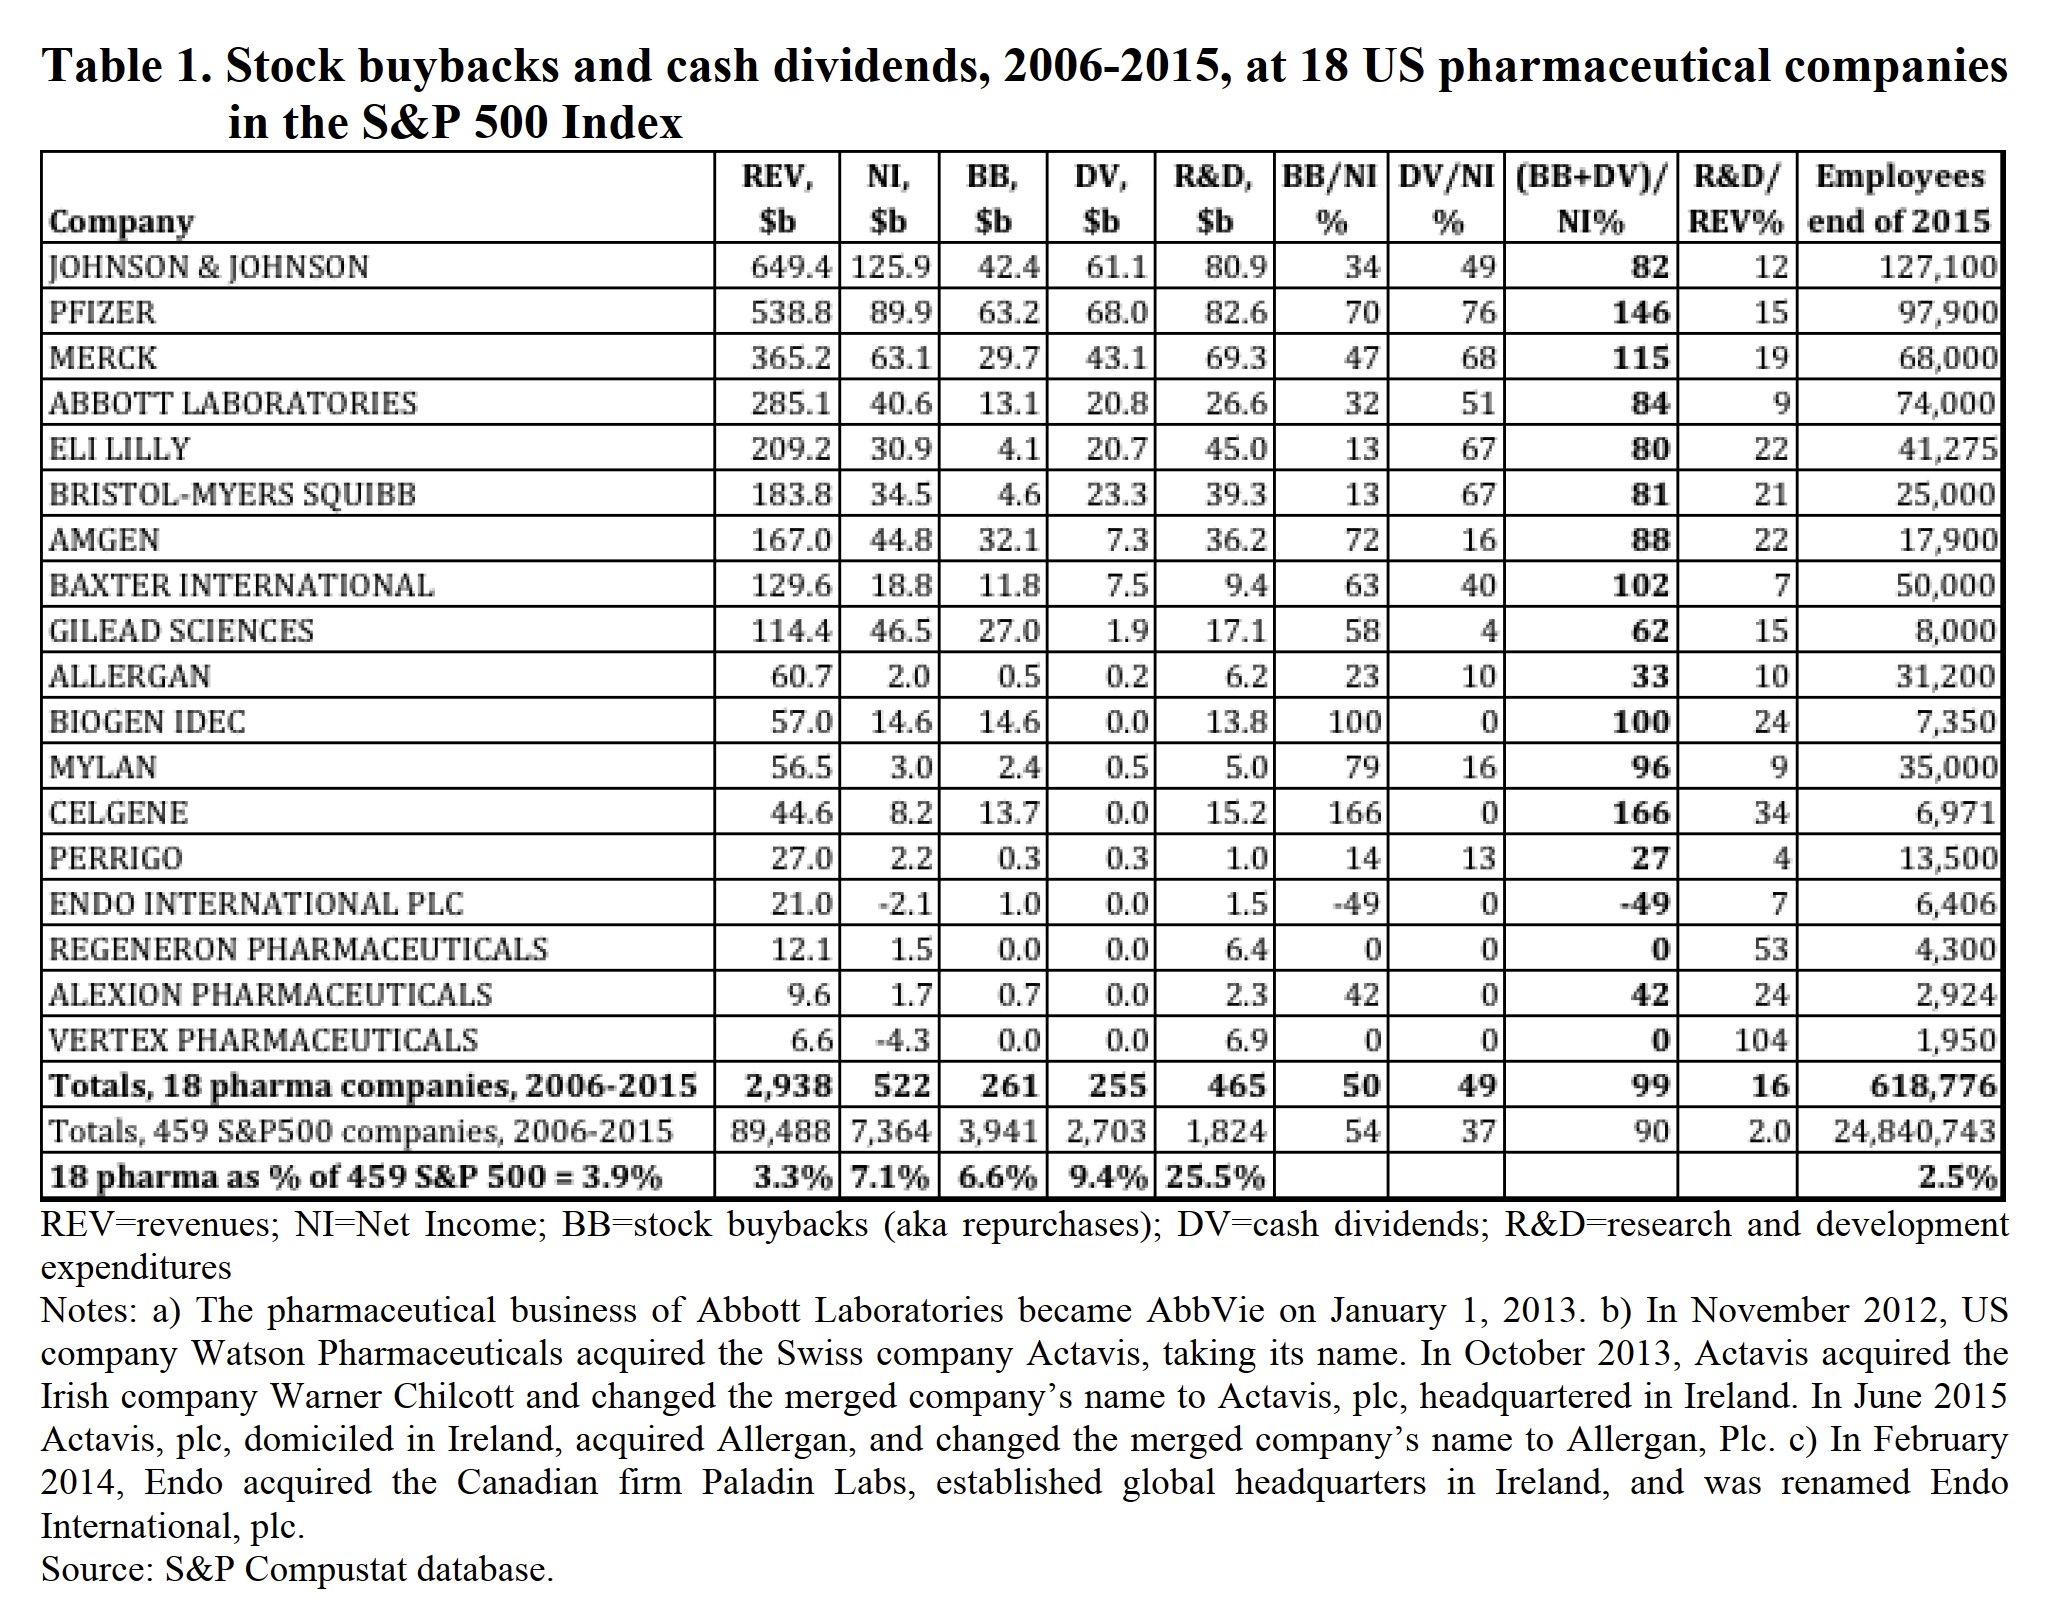
Lazonick et. al. show that, in 2006-2015, the 18 U.S. pharmaceutical firms in the S&P500 used 99% of their net income to buy back their own stocks and pay dividends. The number for the rest of the S&P500 was 90%.
Lazonick, William, Matt Hopkins, Ken Jacobson, Mustafa Erdem Sakinç, and Öner Tulum. 2017. US Pharma’s Financialized Business Model. Institute for New Economic Thinking Working Papers (July 13): 1-28.
- This reply was modified 4 years, 6 months ago by Jonathan Nitzan.
Power? What Power. Pharmaceutical company defenders claim that patent protection helps companies finance their R&D — and, moreover, that protection is temporary: once removed, generic prices drop precipitately.
IMS Institute for Healthcare Informatics. 2016. Price Declines after Branded Medicines Lose Exclusivity in the U.S. January. Parsippany, NJ.
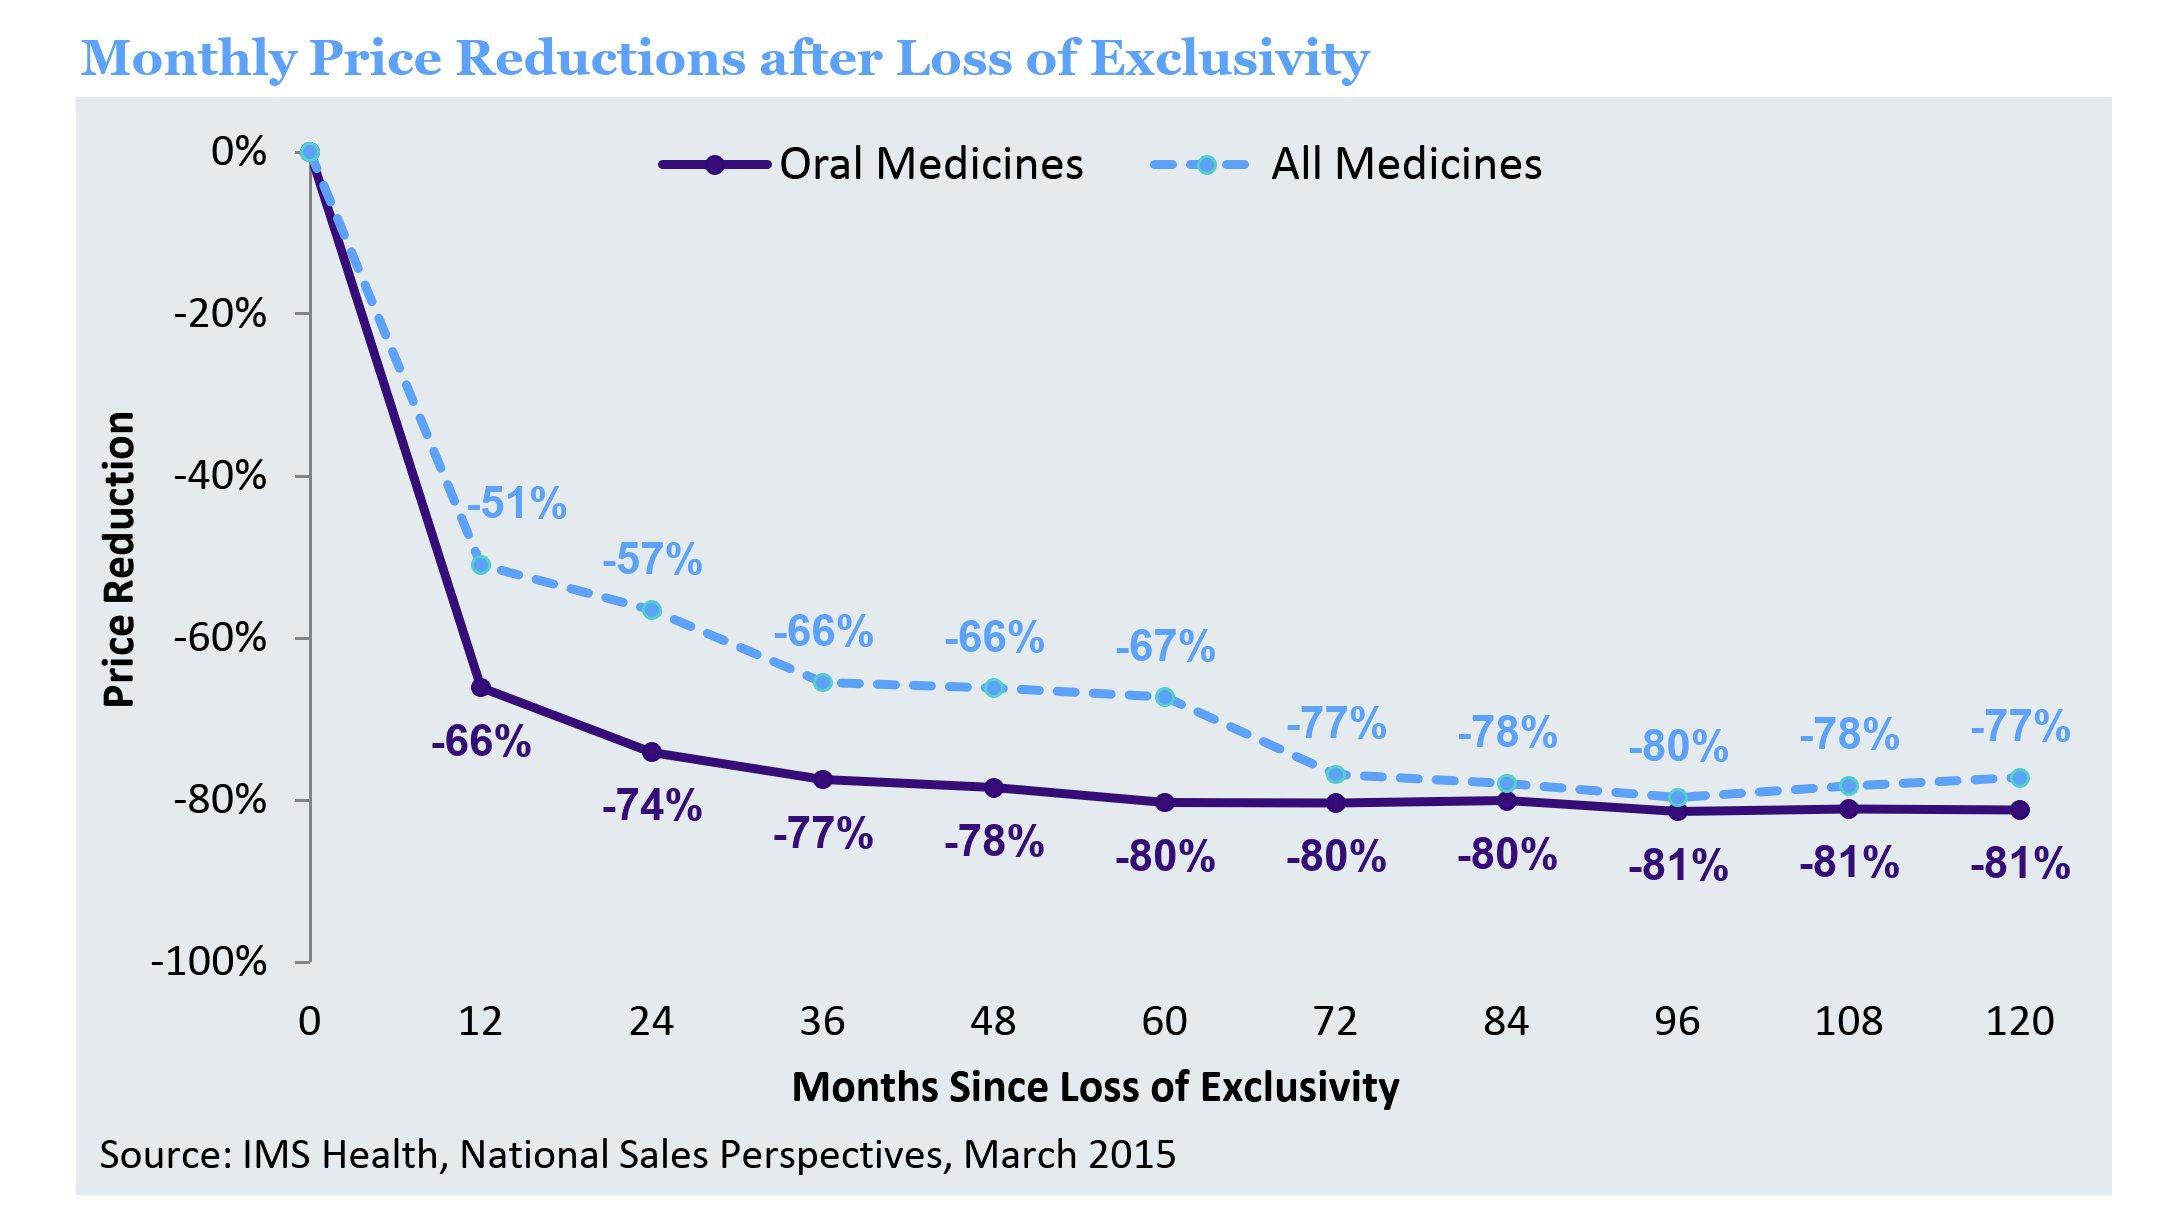
But wait. Generic pharmaceuticals have grown so concentrated, that generic drug prices are rising! In 2008-13, they increased by 30%. In this chart, we see generic price increases for expensive drugs (top panel), medium priced (middle) and cheap (bottom).
Dave, Chintan V., Aaron S. Kesselheim, Erin R. Fox, Peihua Qiu, and Abraham Hatzema. 2017. High Generic Drug Prices and Market Competition. A Retrospective Cohort Study. Annals of Internal Medicine 167 (3): 1-8.
-
AuthorReplies
